GNAQ
[ENSRNOP00000019174]
Main page
| | | Plot |
Mito |
Lyso |
|
Perox |
ER |
Golgi |
PM |
Cytosol |
Nucleus |
|
| Expt A |
 12
12
peptides |
32
spectra |
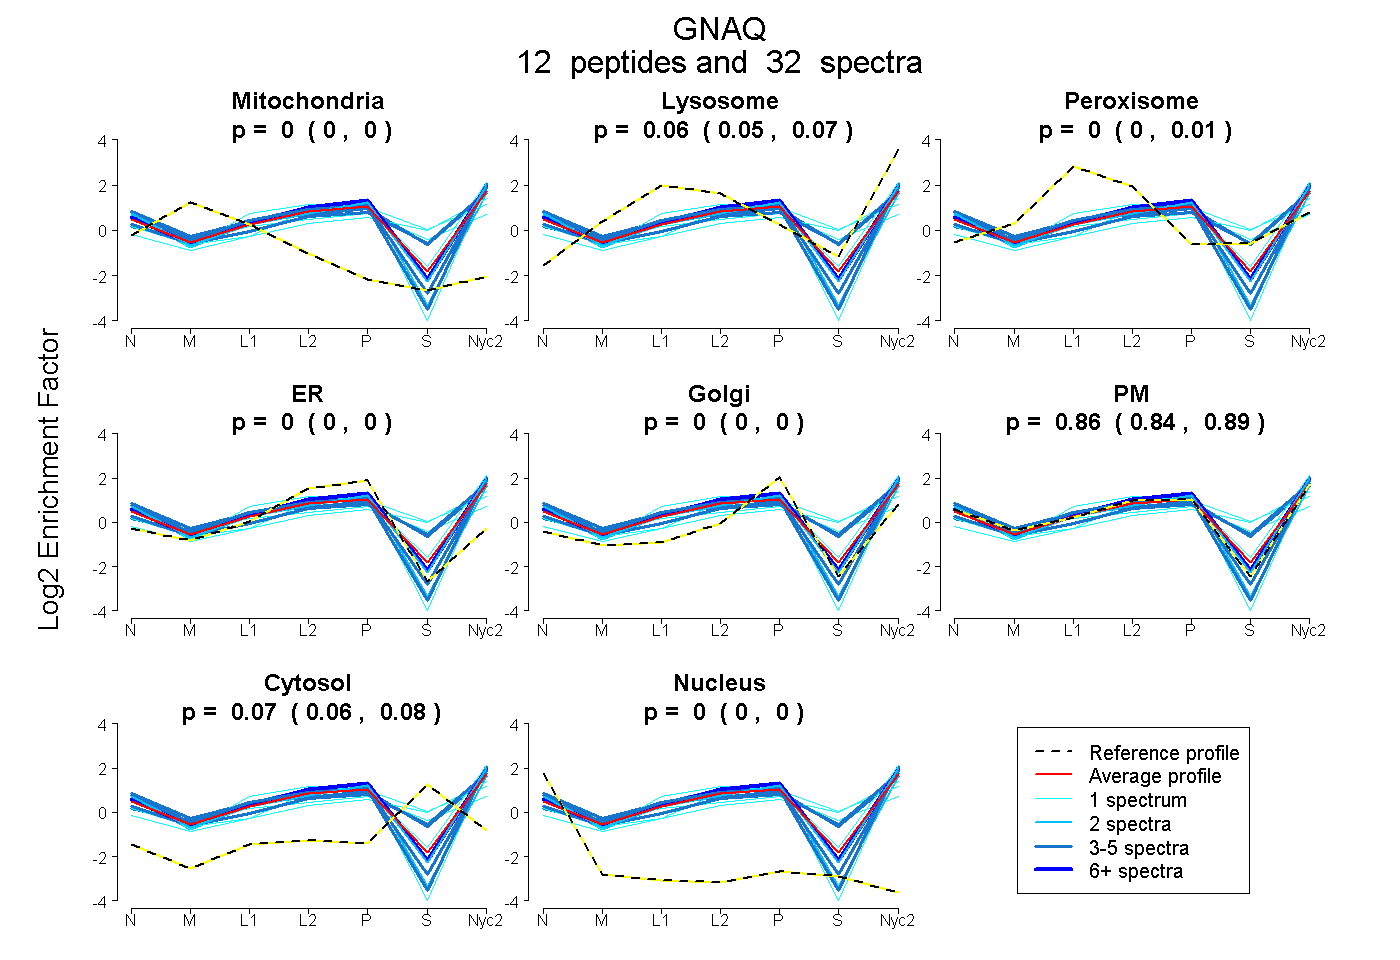 |
0.000
0.000 | 0.000 |
0.062
0.047 | 0.073 |
|
0.000
0.000 | 0.009 |
0.000
0.000 | 0.000 |
0.000
0.000 | 0.000 |
0.864
0.838 | 0.885 |
0.073
0.060 | 0.083 |
0.000
0.000 | 0.000 |
|
| | | Plot |
Mito |
|
Lyso or Perox |
|
ER |
Golgi |
PM |
Cytosol |
Nucleus |
|
| Expt B |
7
peptides |
9
spectra |
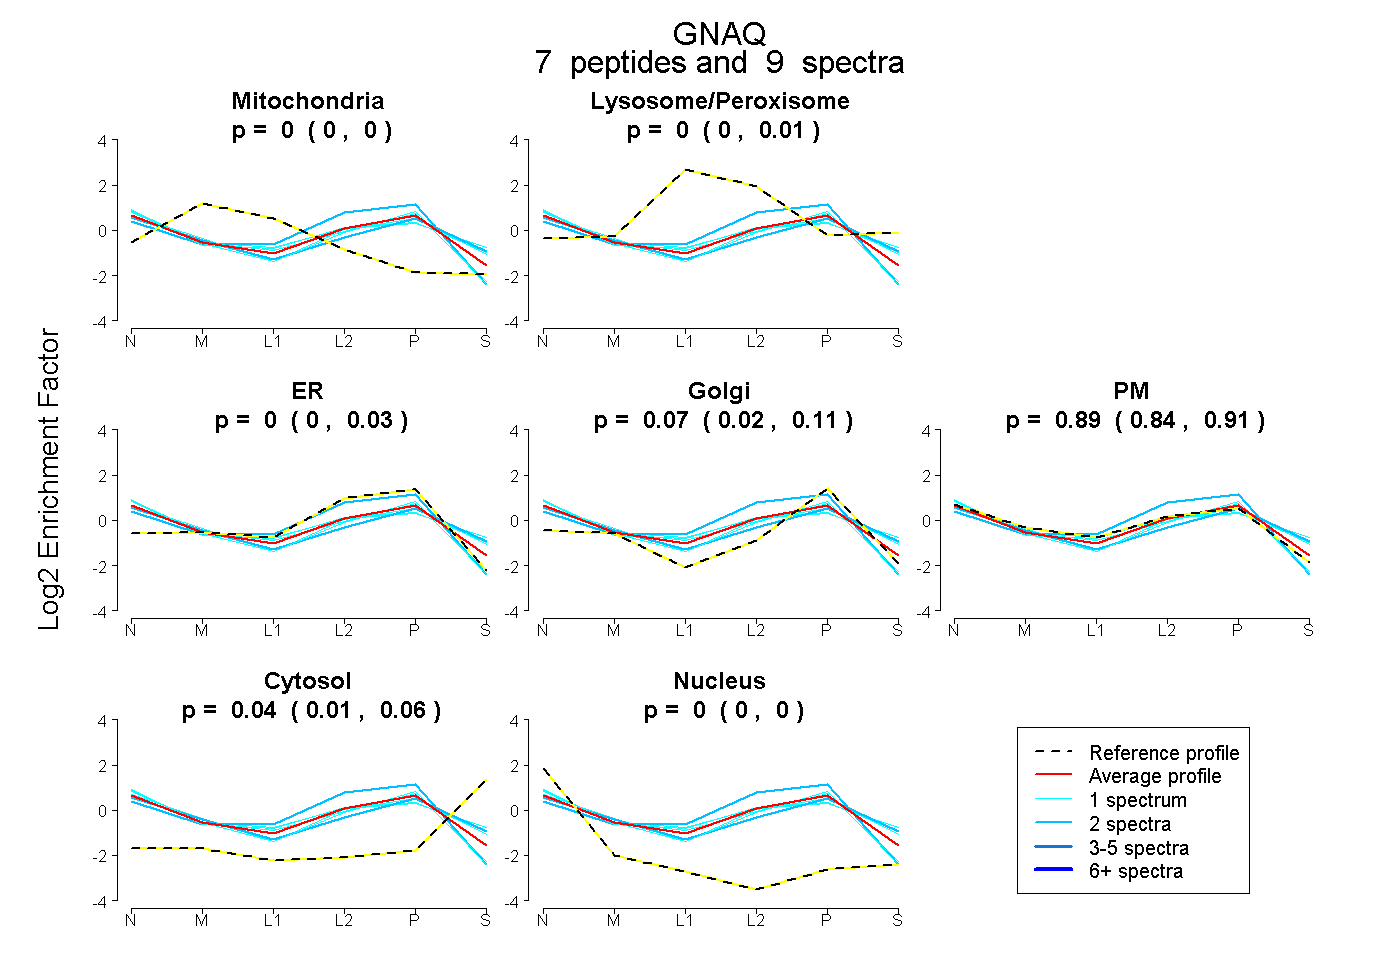 |
0.000
0.000 | 0.000 |
|
0.000
0.000 | 0.015 |
|
0.000
0.000 | 0.030 |
0.067
0.020 | 0.111 |
0.890
0.838 | 0.912 |
0.043
0.012 | 0.065 |
0.000
0.000 | 0.004 |
|
| 2 spectra, EVDVEK |
0.000 |
|
0.000 |
|
0.524 |
0.000 |
0.476 |
0.000 |
0.000 |
|
| 1 spectrum, INDEIER |
0.000 |
|
0.000 |
|
0.055 |
0.042 |
0.861 |
0.000 |
0.042 |
|
| 2 spectra, VSAFENPYVDAIK |
0.000 |
|
0.000 |
|
0.000 |
0.093 |
0.746 |
0.161 |
0.000 |
|
| 1 spectrum, FVFAAVK |
0.000 |
|
0.074 |
|
0.000 |
0.000 |
0.810 |
0.106 |
0.011 |
|
| 1 spectrum, YYLNDLDR |
0.000 |
|
0.000 |
|
0.049 |
0.207 |
0.692 |
0.000 |
0.053 |
|
| 1 spectrum, MVDVGGQR |
0.000 |
|
0.000 |
|
0.000 |
0.059 |
0.823 |
0.117 |
0.000 |
|
| 1 spectrum, AMDTLK |
0.000 |
|
0.086 |
|
0.000 |
0.000 |
0.775 |
0.139 |
0.000 |
|
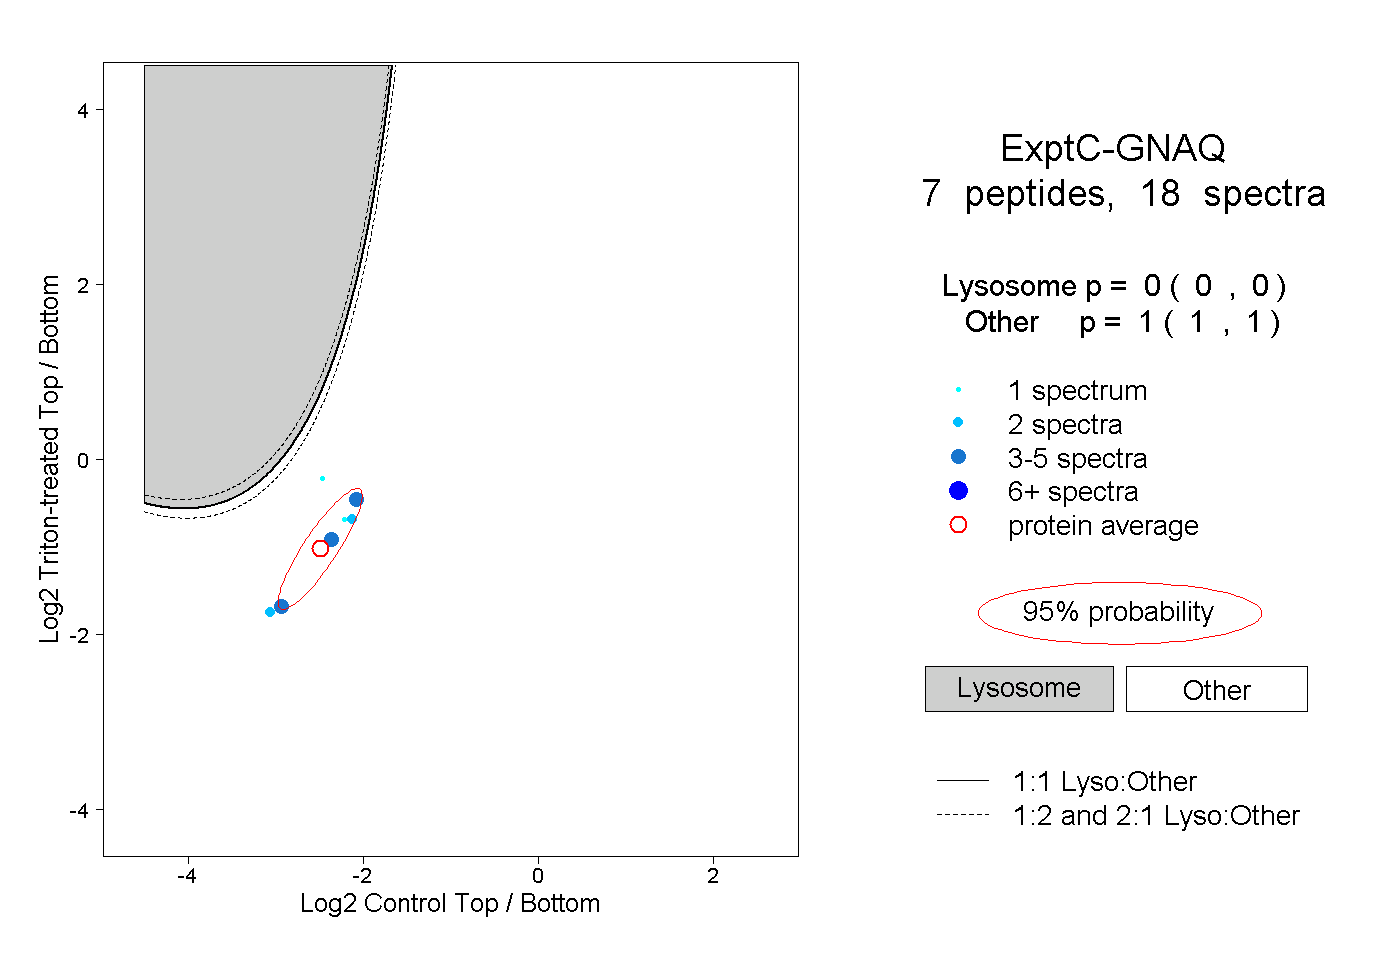
| | | Plot |
|
Lyso |
|
|
|
|
|
|
|
Other |
| Expt C |
7
peptides |
18
spectra |
 |
|
0.000
0.000 | 0.000 |
|
|
|
|
|
|
|
1.000
1.000 | 1.000 |
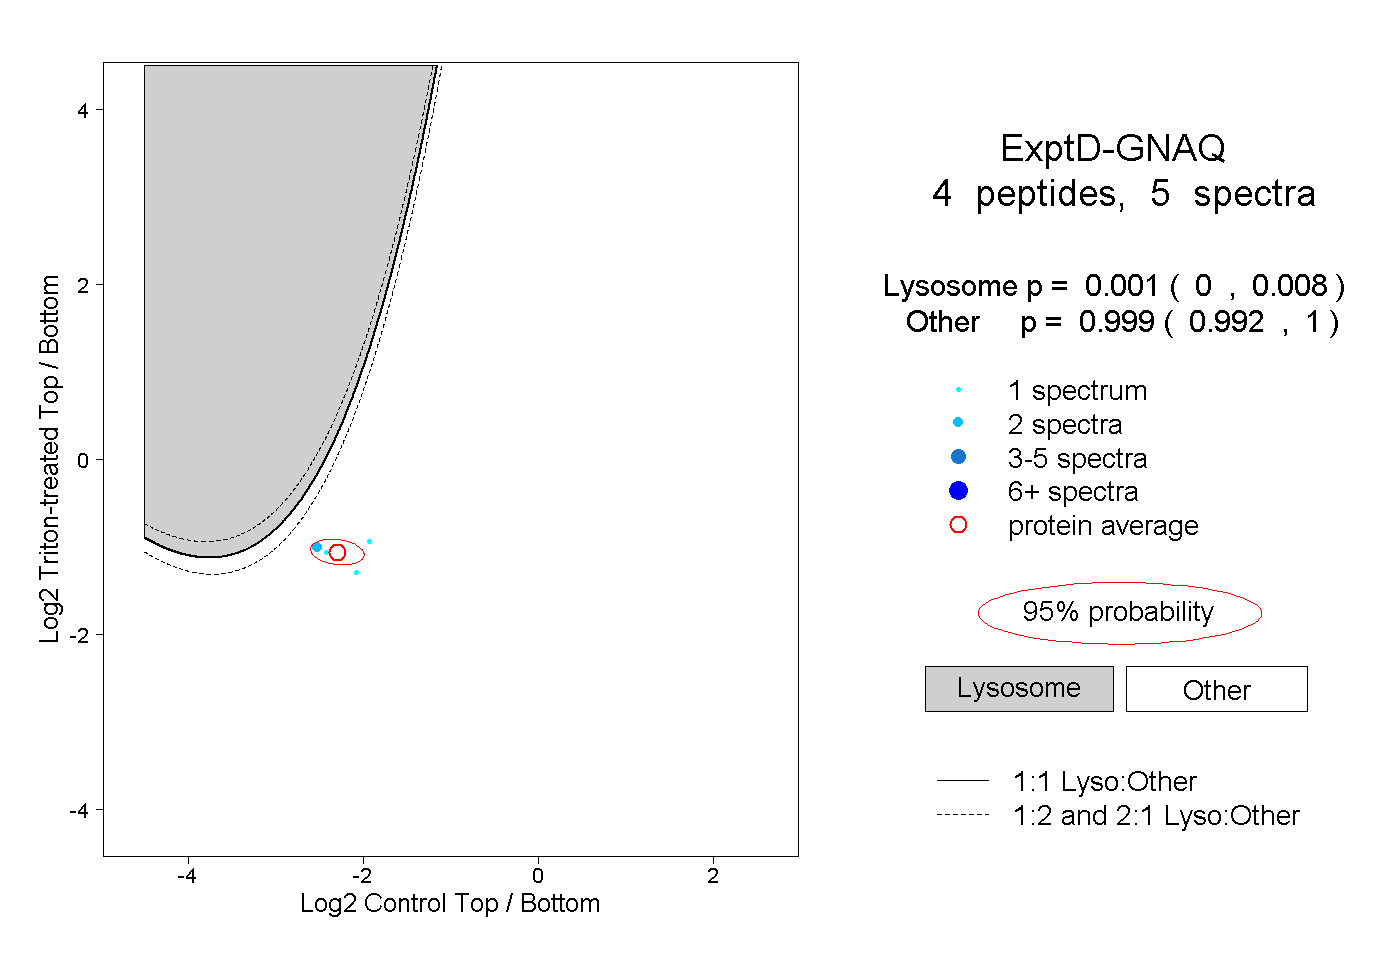
| | | Plot |
|
Lyso |
|
|
|
|
|
|
|
Other |
| Expt D |
4
peptides |
5
spectra |
 |
|
0.001
0.000 | 0.008 |
|
|
|
|
|
|
|
0.999
0.992 | 1.000 |