 15
15peptides
spectra
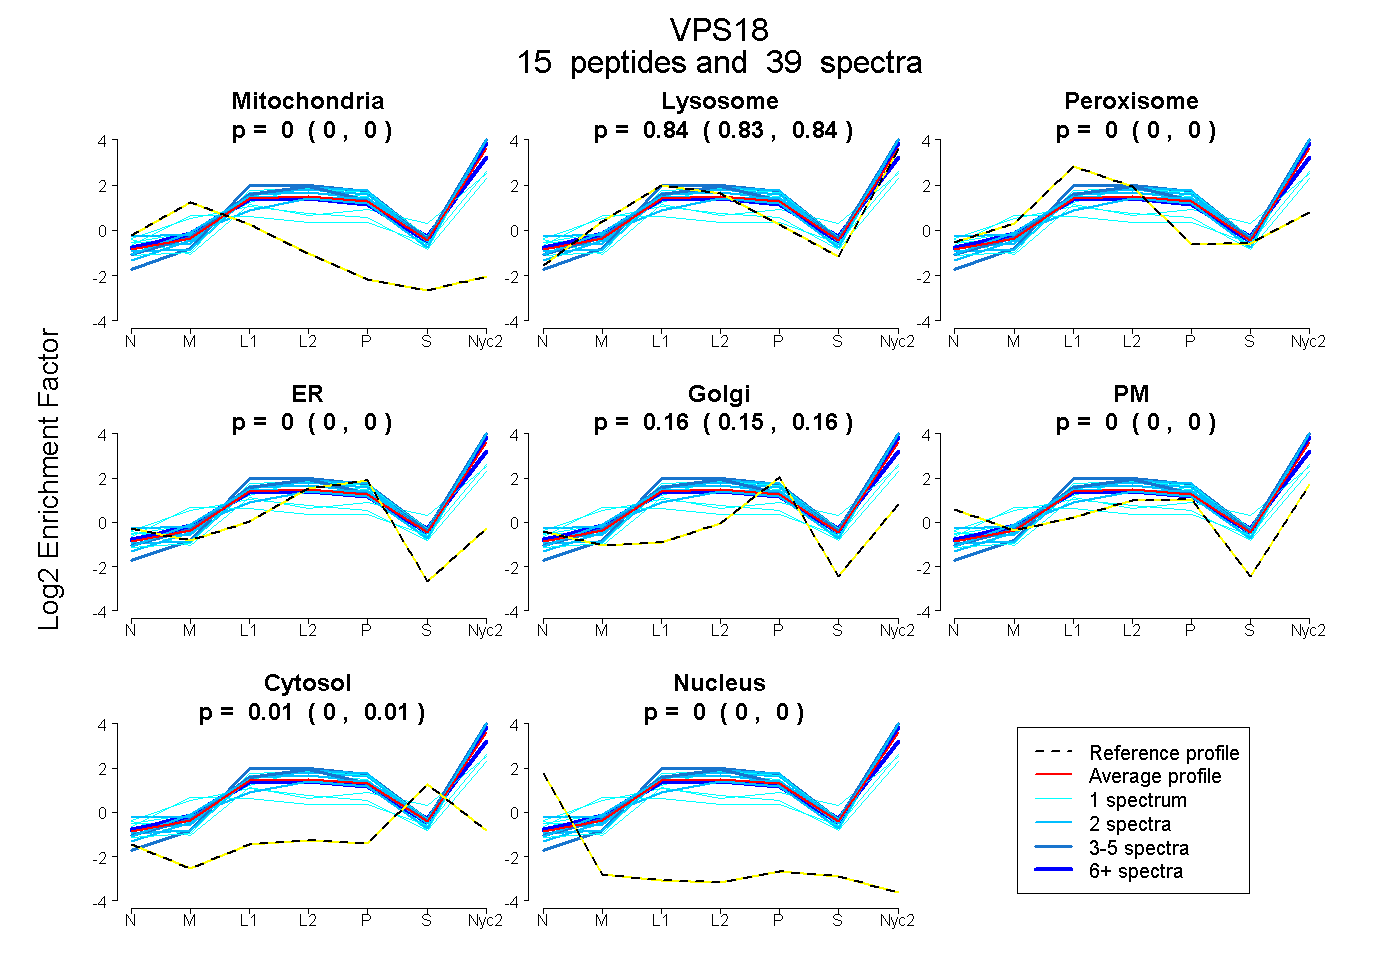
0.000 | 0.000
0.829 | 0.842
0.000 | 0.000
0.000 | 0.000
0.150 | 0.162
0.000 | 0.000
0.002 | 0.012
0.000 | 0.000
6peptides
spectra
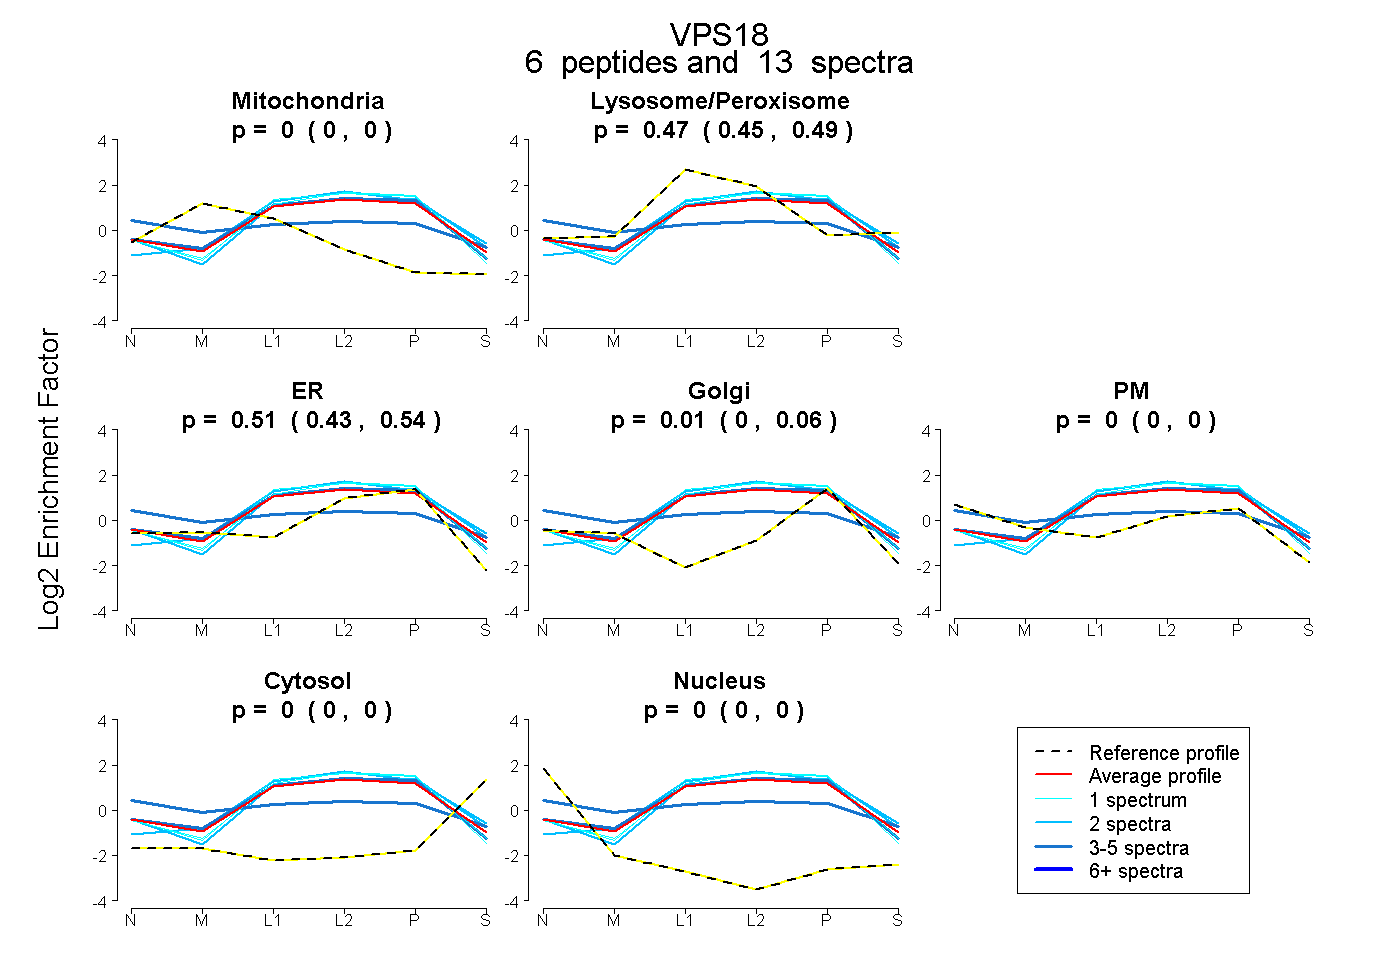
0.000 | 0.000
0.451 | 0.495
0.430 | 0.543
0.000 | 0.062
0.000 | 0.000
0.000 | 0.000
0.000 | 0.000
28peptides
spectra
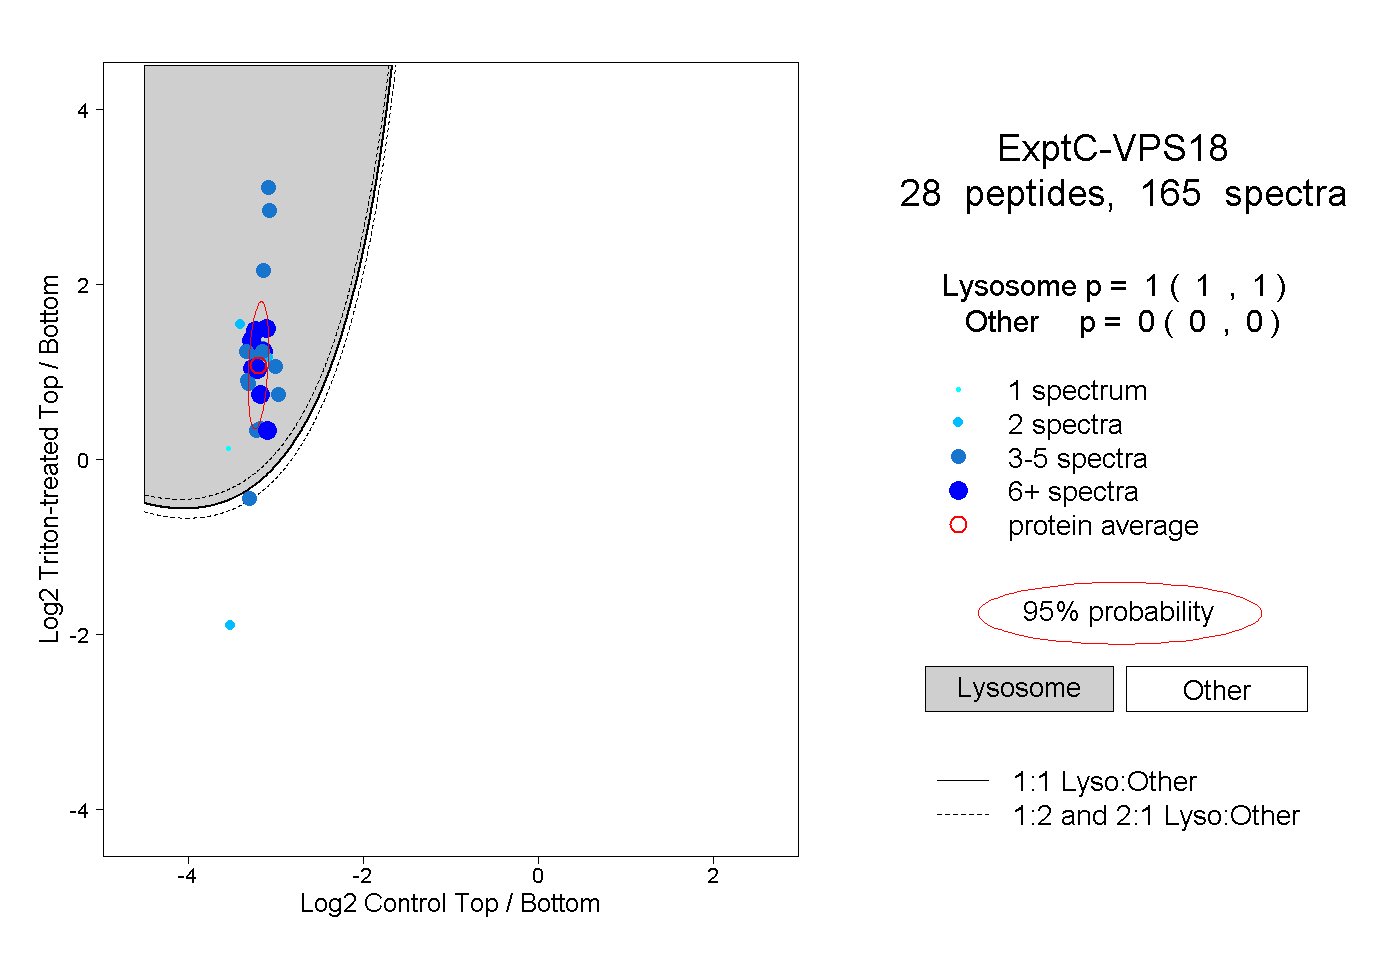
1.000 | 1.000
0.000 | 0.000
4peptides
spectra
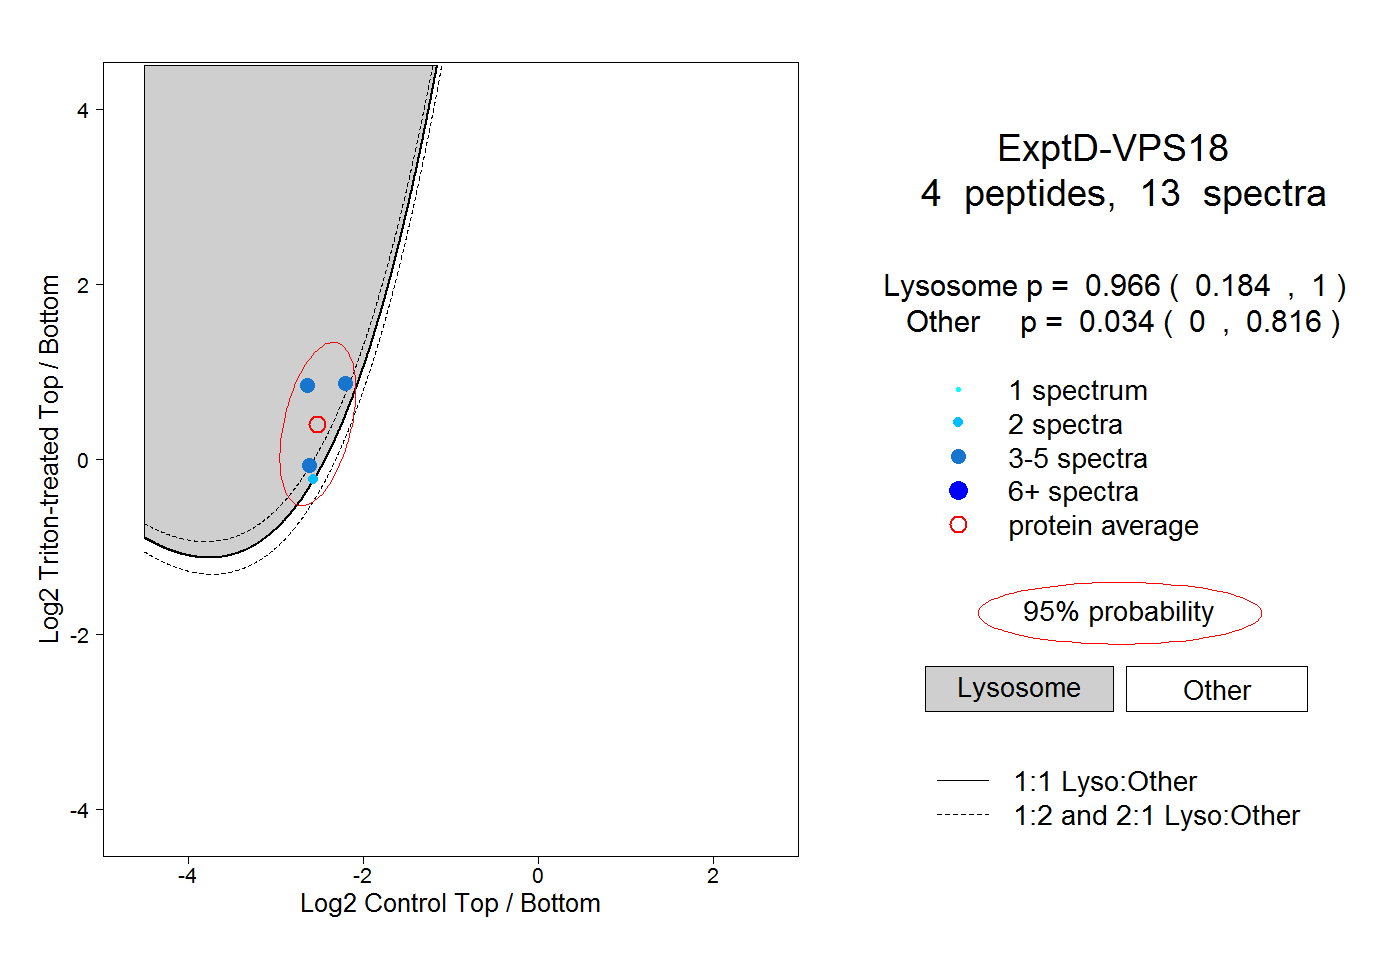
0.184 | 1.000
0.000 | 0.816