 15
15peptides
spectra
0.000 | 0.000
0.829 | 0.842
0.000 | 0.000
0.000 | 0.000
0.150 | 0.162
0.000 | 0.000
0.002 | 0.012
0.000 | 0.000
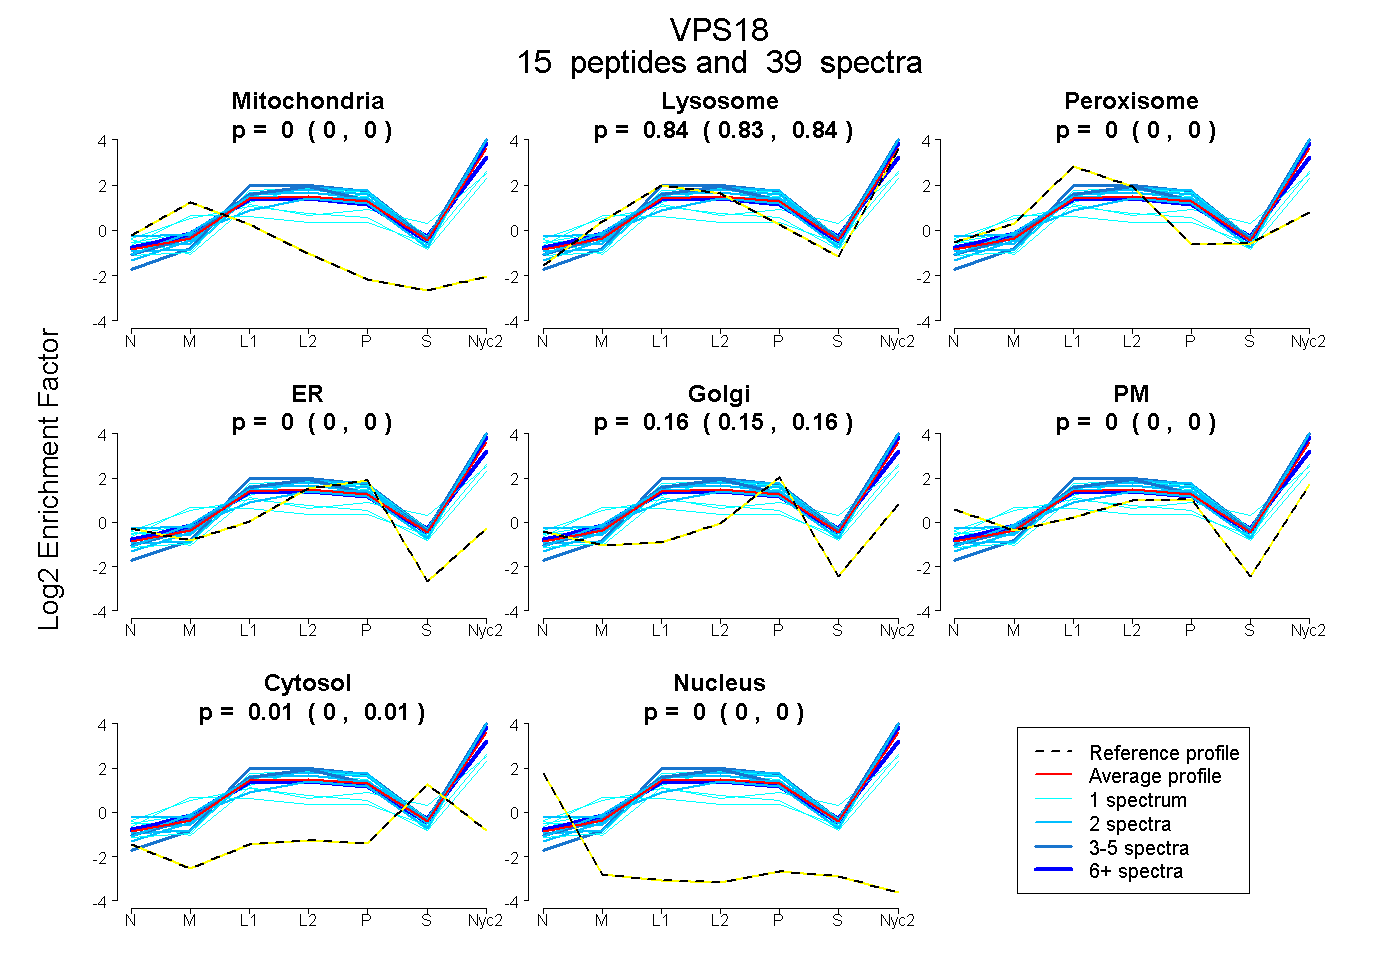
| Plot | Mito | Lyso | Perox | ER | Golgi | PM | Cytosol | Nucleus | |||||
| Expt A |
15 peptides |
39 spectra |
|
0.000 0.000 | 0.000 |
0.836 0.829 | 0.842 |
0.000 0.000 | 0.000 |
0.000 0.000 | 0.000 |
0.157 0.150 | 0.162 |
0.000 0.000 | 0.000 |
0.007 0.002 | 0.012 |
0.000 0.000 | 0.000 |
| 7 spectra, GFVIATTR | 0.000 | 0.866 | 0.000 | 0.000 | 0.120 | 0.014 | 0.000 | 0.000 | ||
| 5 spectra, QEEALAEFLQR | 0.000 | 0.930 | 0.000 | 0.000 | 0.070 | 0.000 | 0.000 | 0.000 | ||
| 2 spectra, IDFTPSER | 0.000 | 0.912 | 0.000 | 0.000 | 0.088 | 0.000 | 0.000 | 0.000 | ||
| 1 spectrum, CYALTQSYFEEIALK | 0.042 | 0.500 | 0.056 | 0.000 | 0.000 | 0.320 | 0.081 | 0.000 | ||
| 5 spectra, EMEEATASAQR | 0.000 | 0.952 | 0.000 | 0.000 | 0.048 | 0.000 | 0.000 | 0.000 | ||
| 1 spectrum, ASILDEYEDSLSR | 0.000 | 0.752 | 0.000 | 0.000 | 0.000 | 0.248 | 0.000 | 0.000 | ||
| 2 spectra, LAGLKPTER | 0.000 | 0.681 | 0.000 | 0.000 | 0.000 | 0.319 | 0.000 | 0.000 | ||
| 6 spectra, EADFCFR | 0.000 | 0.773 | 0.000 | 0.000 | 0.095 | 0.070 | 0.063 | 0.000 | ||
| 1 spectrum, TFLSSPR | 0.044 | 0.598 | 0.000 | 0.000 | 0.031 | 0.182 | 0.144 | 0.000 | ||
| 2 spectra, EAEAGAAAVGPSR | 0.000 | 0.886 | 0.000 | 0.000 | 0.114 | 0.000 | 0.000 | 0.000 | ||
| 1 spectrum, EAICSSLK | 0.000 | 0.564 | 0.000 | 0.000 | 0.000 | 0.177 | 0.259 | 0.000 | ||
| 1 spectrum, LGALQGDPDALNLYR | 0.000 | 0.894 | 0.000 | 0.000 | 0.106 | 0.000 | 0.000 | 0.000 | ||
| 2 spectra, TYLDMNR | 0.000 | 0.890 | 0.000 | 0.000 | 0.110 | 0.000 | 0.000 | 0.000 | ||
| 2 spectra, FSPVLIR | 0.000 | 0.848 | 0.000 | 0.000 | 0.152 | 0.000 | 0.000 | 0.000 | ||
| 1 spectrum, ASEPNR | 0.000 | 0.785 | 0.000 | 0.000 | 0.012 | 0.203 | 0.000 | 0.000 |
| Plot | Mito | Lyso or Perox | ER | Golgi | PM | Cytosol | Nucleus | ||||||
| Expt B |
6 peptides |
13 spectra |
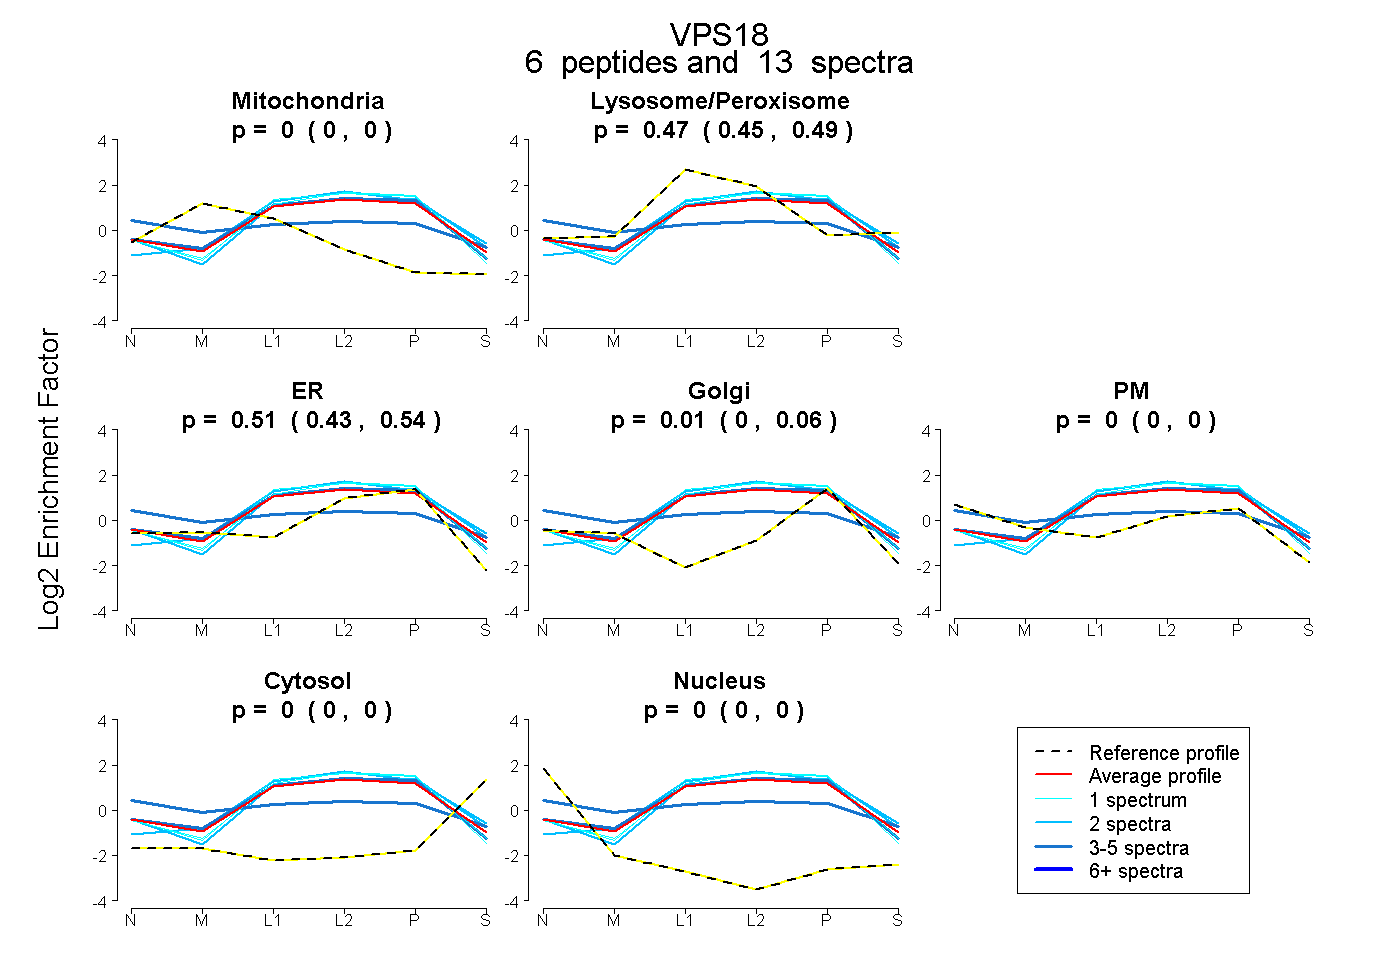 |
0.000 0.000 | 0.000 |
0.472 0.451 | 0.495 |
0.514 0.430 | 0.543 |
0.015 0.000 | 0.062 |
0.000 0.000 | 0.000 |
0.000 0.000 | 0.000 |
0.000 0.000 | 0.000 |
|||
| Plot | Lyso | Other | |||||||||||
| Expt C |
28 peptides |
165 spectra |
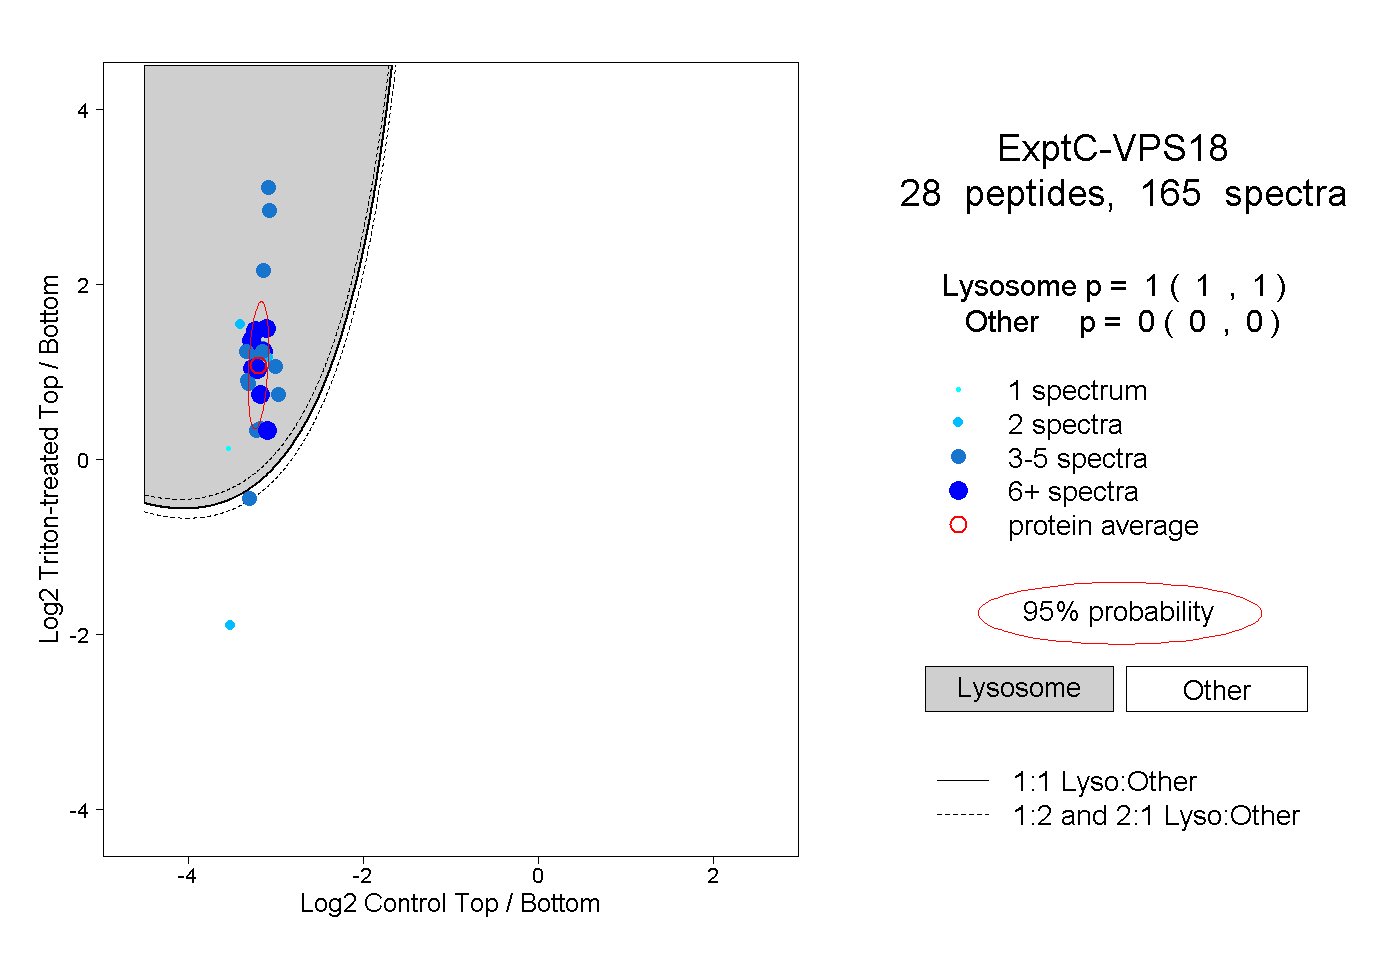 |
1.000 1.000 | 1.000 |
0.000 0.000 | 0.000 |
||||||||
| Plot | Lyso | Other | |||||||||||
| Expt D |
4 peptides |
13 spectra |
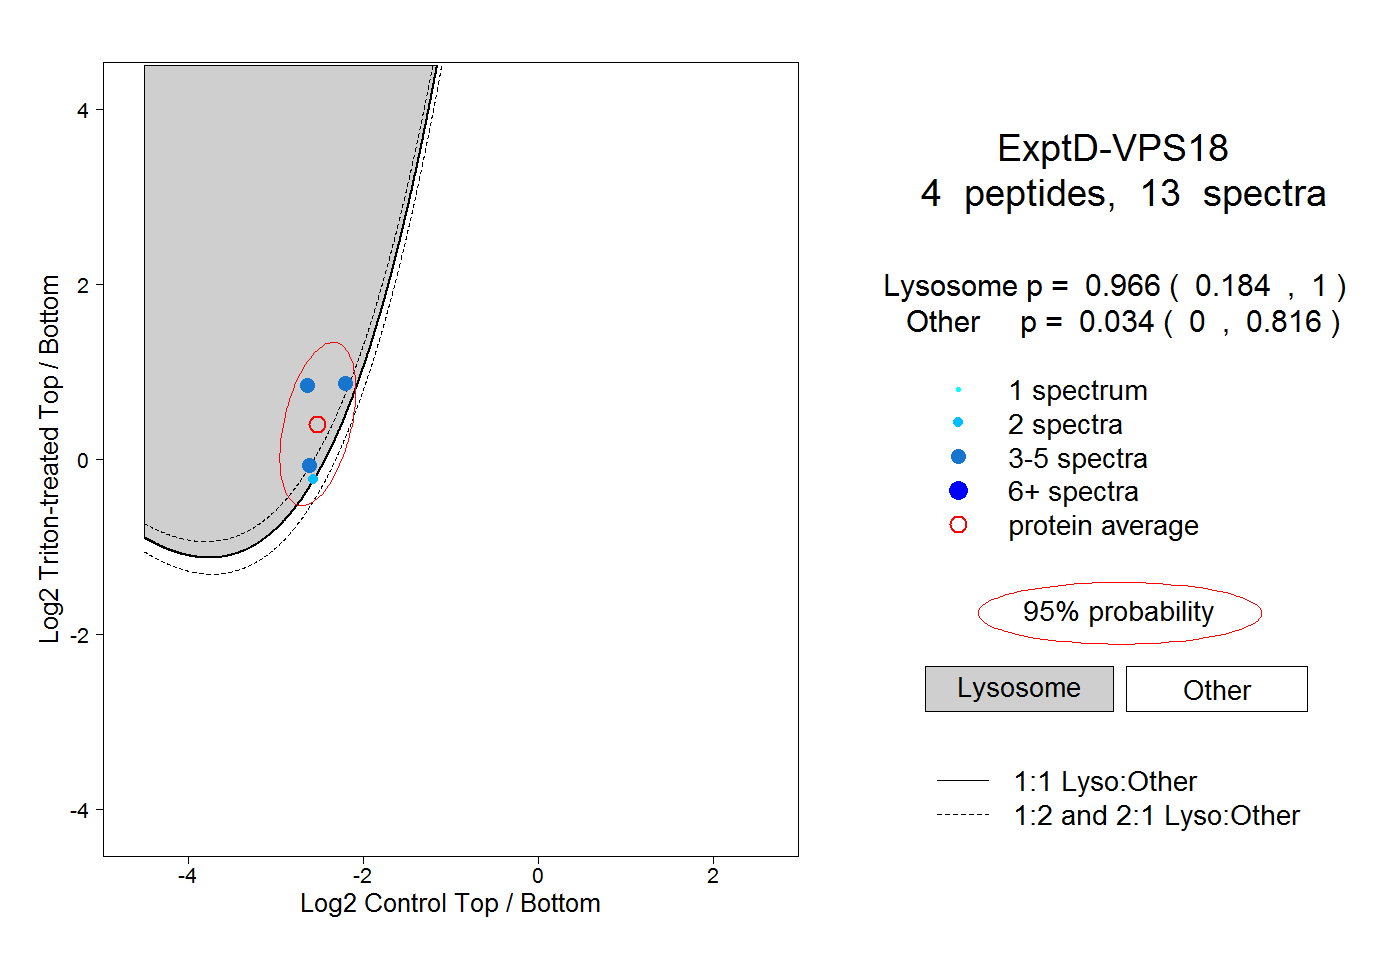 |
0.966 0.184 | 1.000 |
0.034 0.000 | 0.816 |