VPS18
[ENSRNOP00000018717]
Main page
| | | Plot |
Mito |
Lyso |
|
Perox |
ER |
Golgi |
PM |
Cytosol |
Nucleus |
|
| Expt A |
 15
15
peptides |
39
spectra |
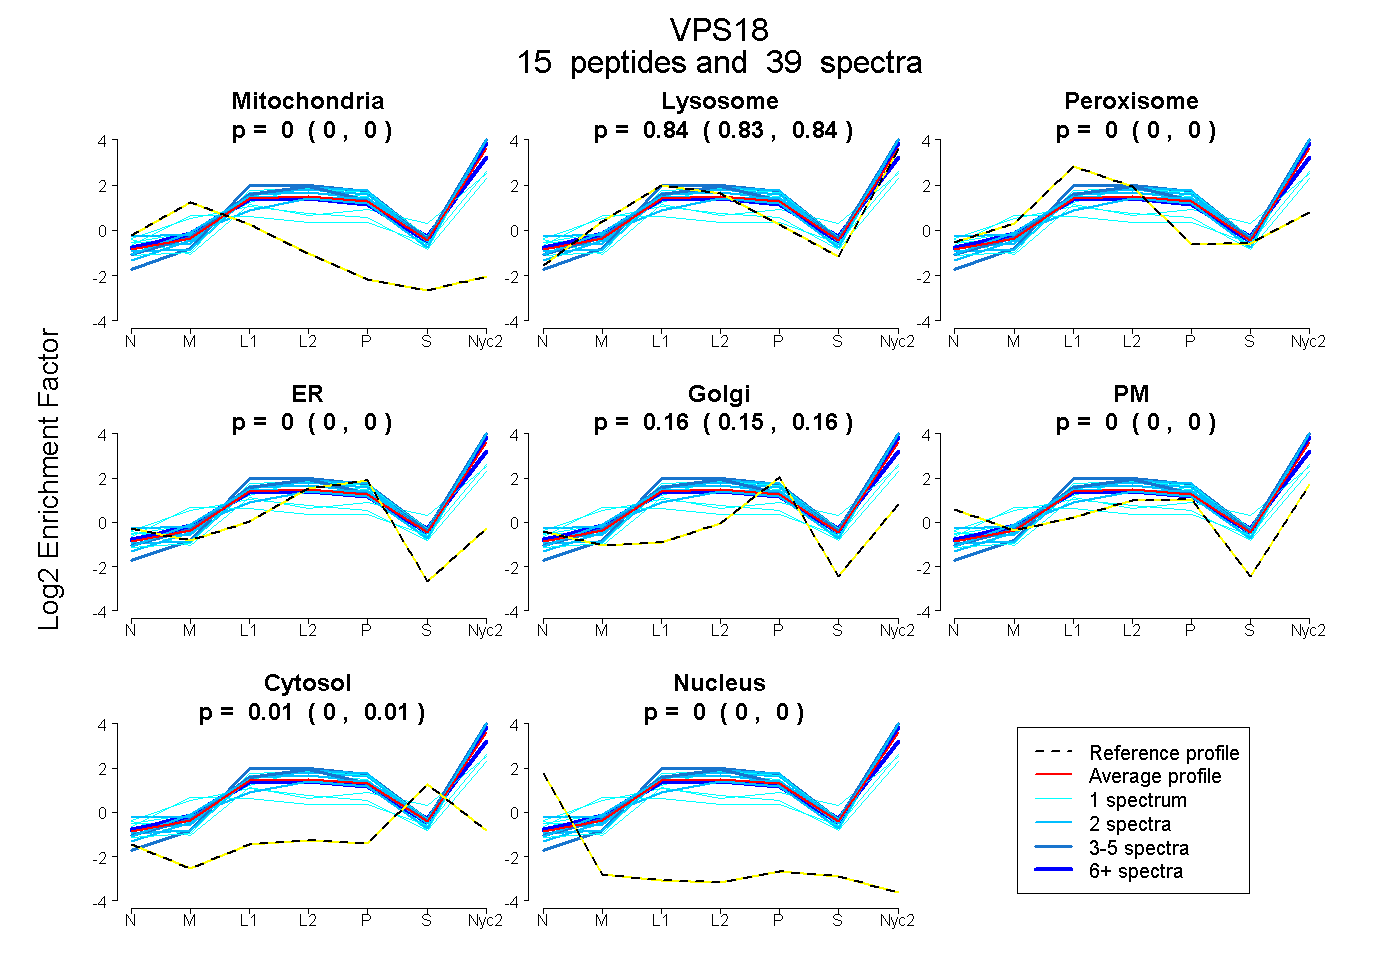 |
0.000
0.000 | 0.000 |
0.836
0.829 | 0.842 |
|
0.000
0.000 | 0.000 |
0.000
0.000 | 0.000 |
0.157
0.150 | 0.162 |
0.000
0.000 | 0.000 |
0.007
0.002 | 0.012 |
0.000
0.000 | 0.000 |
|
| | | Plot |
Mito |
|
Lyso or Perox |
|
ER |
Golgi |
PM |
Cytosol |
Nucleus |
|
| Expt B |
6
peptides |
13
spectra |
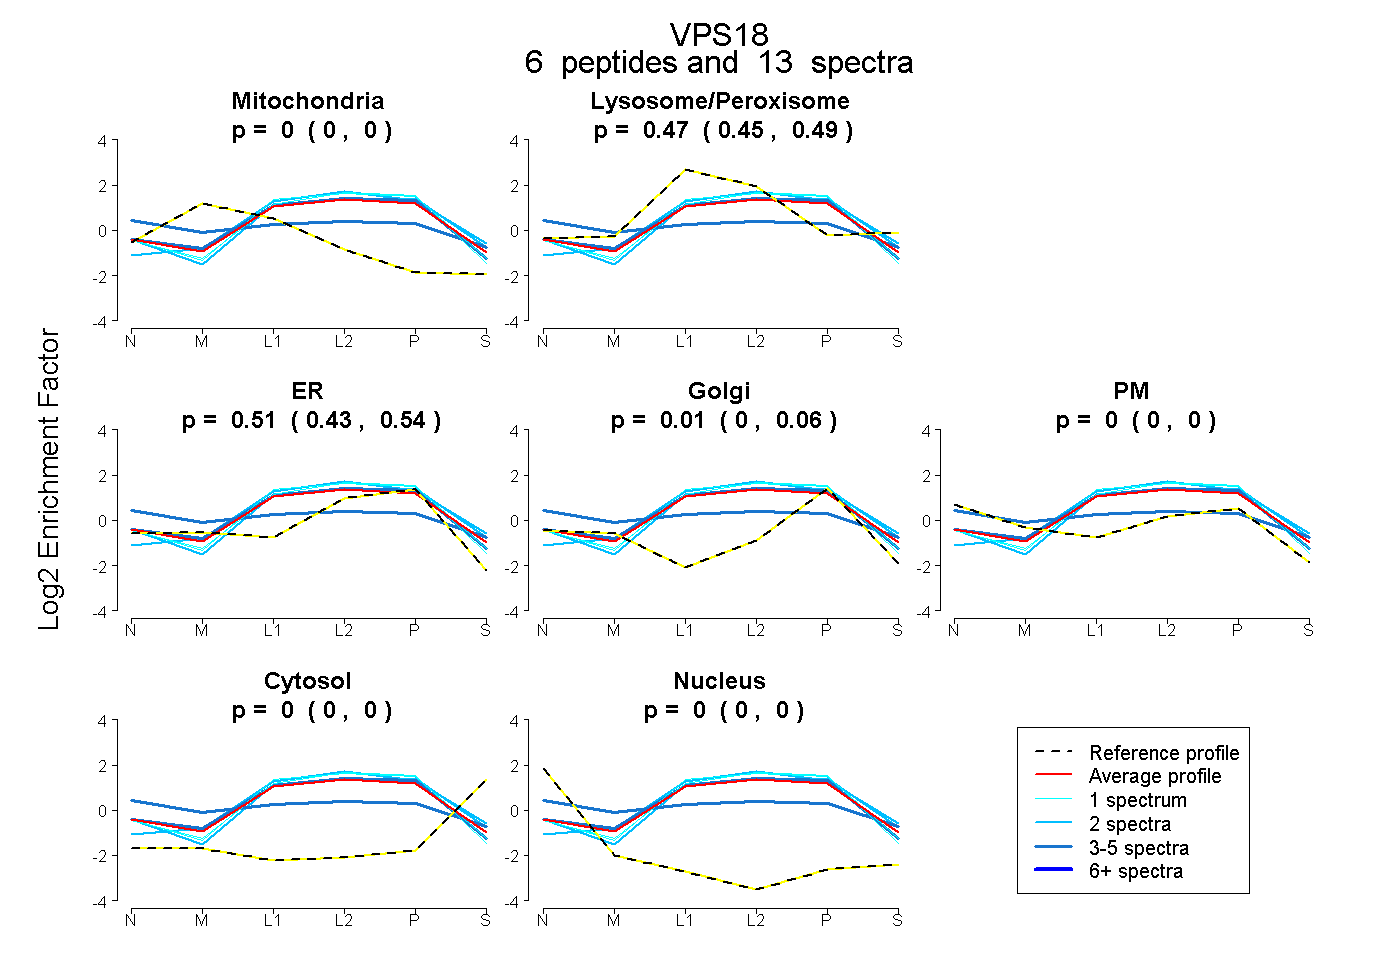 |
0.000
0.000 | 0.000 |
|
0.472
0.451 | 0.495 |
|
0.514
0.430 | 0.543 |
0.015
0.000 | 0.062 |
0.000
0.000 | 0.000 |
0.000
0.000 | 0.000 |
0.000
0.000 | 0.000 |
|
| 3 spectra, GFVIATTR |
0.000 |
|
0.446 |
|
0.554 |
0.000 |
0.000 |
0.000 |
0.000 |
|
| 1 spectrum, QEEALAEFLQR |
0.000 |
|
0.484 |
|
0.516 |
0.000 |
0.000 |
0.000 |
0.000 |
|
| 4 spectra, LCAEHGHHR |
0.000 |
|
0.320 |
|
0.000 |
0.000 |
0.605 |
0.074 |
0.000 |
|
| 2 spectra, DLQELR |
0.000 |
|
0.491 |
|
0.482 |
0.027 |
0.000 |
0.000 |
0.000 |
|
| 1 spectrum, TFLSSPR |
0.000 |
|
0.424 |
|
0.576 |
0.000 |
0.000 |
0.000 |
0.000 |
|
| 2 spectra, DHFLEK |
0.000 |
|
0.555 |
|
0.445 |
0.000 |
0.000 |
0.000 |
0.000 |
|
| | | Plot |
|
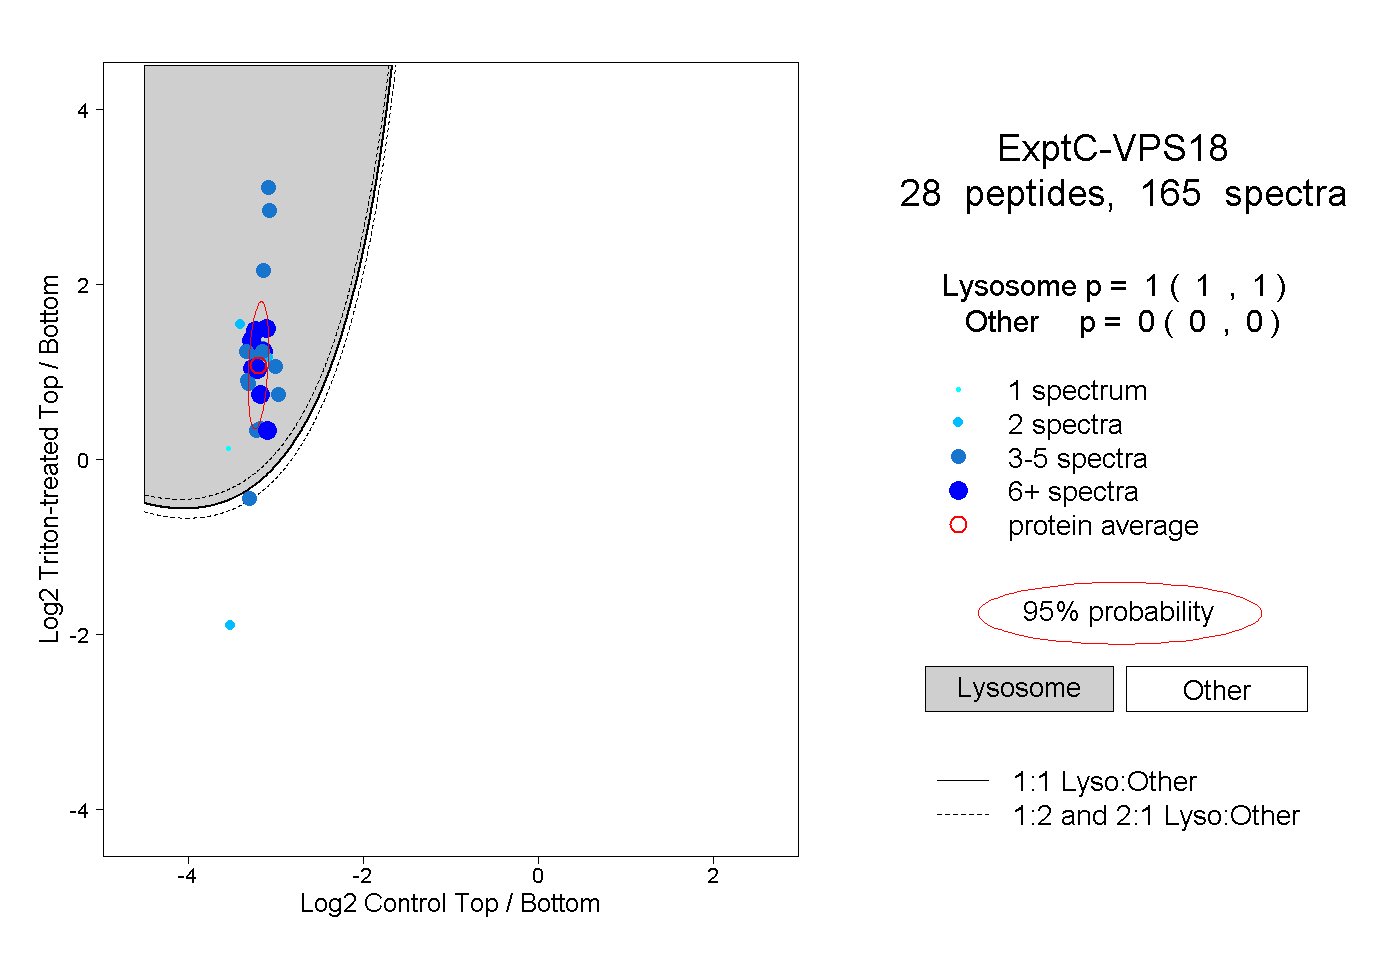
Lyso |
|
|
|
|
|
|
|
Other |
| Expt C |
28
peptides |
165
spectra |
 |
|
1.000
1.000 | 1.000 |
|
|
|
|
|
|
|
0.000
0.000 | 0.000 |
| | | Plot |
|
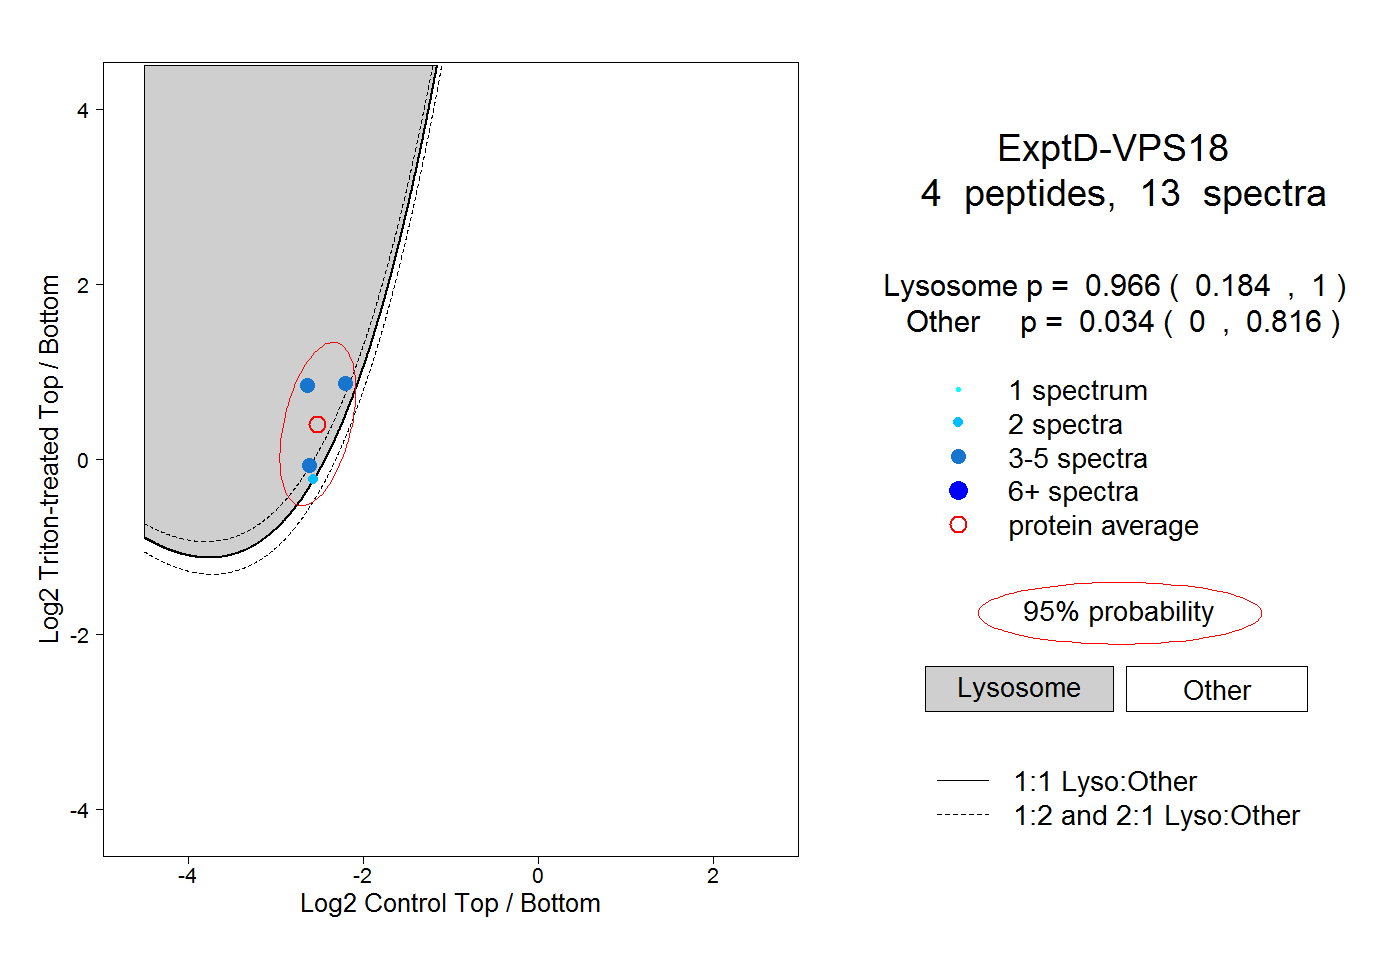
Lyso |
|
|
|
|
|
|
|
Other |
| Expt D |
4
peptides |
13
spectra |
 |
|
0.966
0.184 | 1.000 |
|
|
|
|
|
|
|
0.034
0.000 | 0.816 |