 15
15peptides
spectra
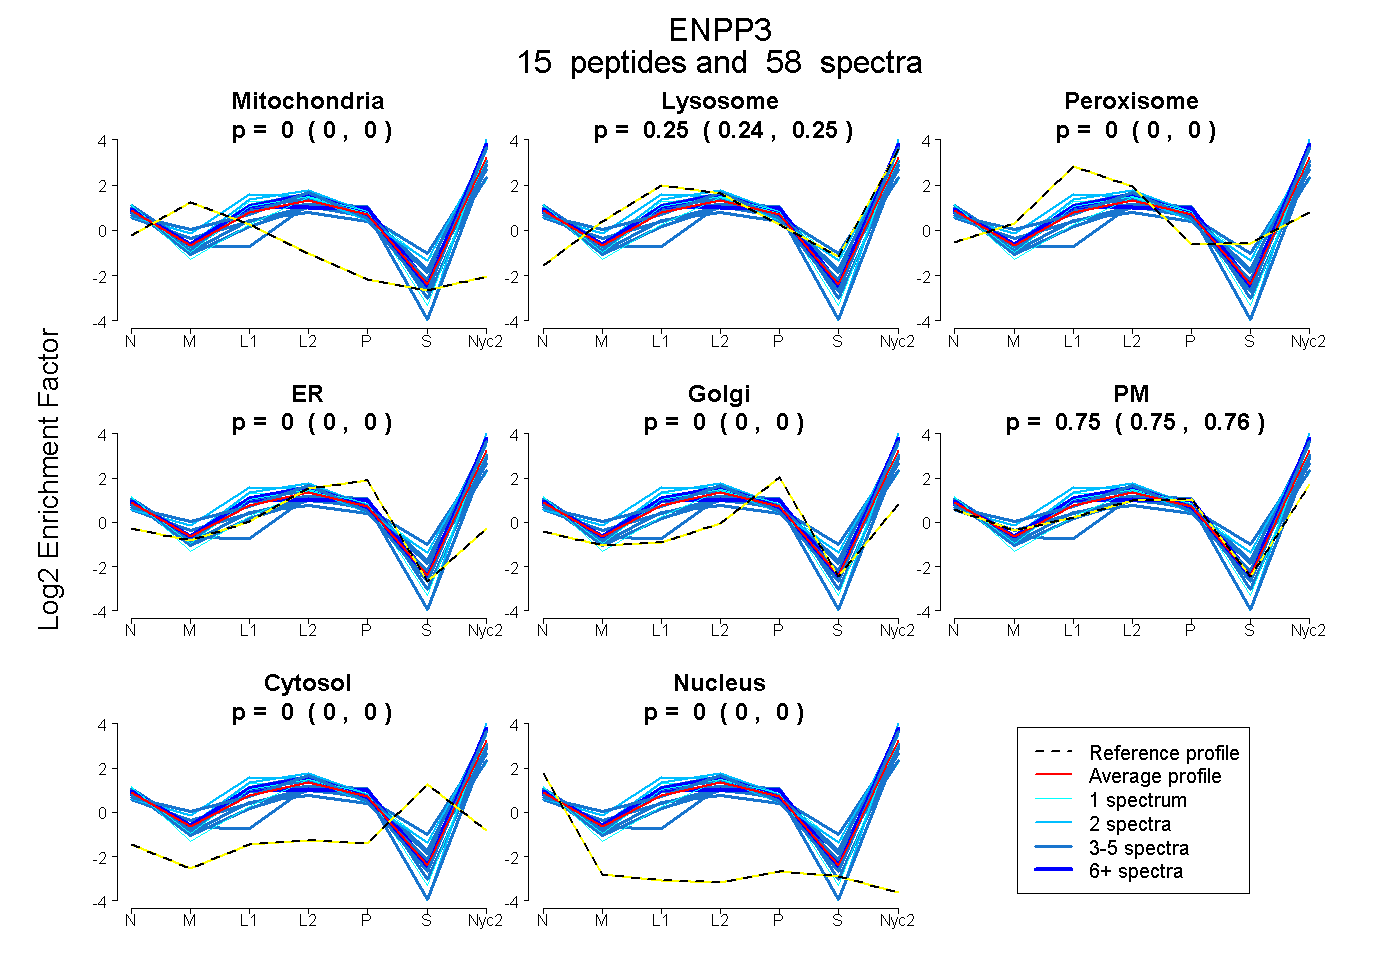
0.000 | 0.000
0.237 | 0.253
0.000 | 0.000
0.000 | 0.000
0.000 | 0.000
0.745 | 0.761
0.000 | 0.000
0.000 | 0.000
7peptides
spectra
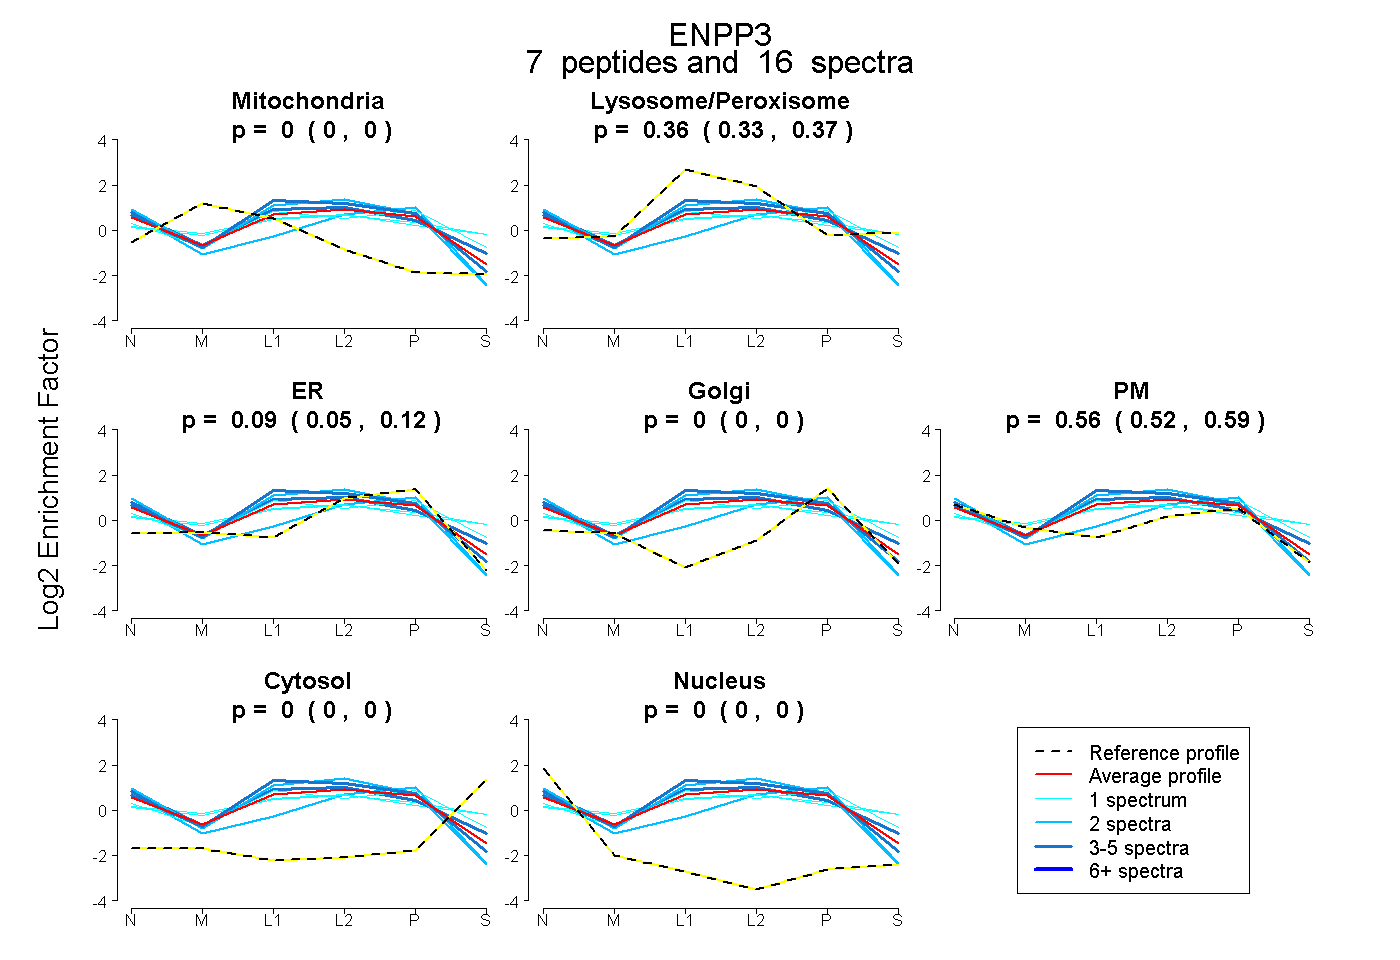
0.000 | 0.000
0.330 | 0.375
0.048 | 0.123
0.000 | 0.000
0.520 | 0.586
0.000 | 0.000
0.000 | 0.000
23peptides
spectra
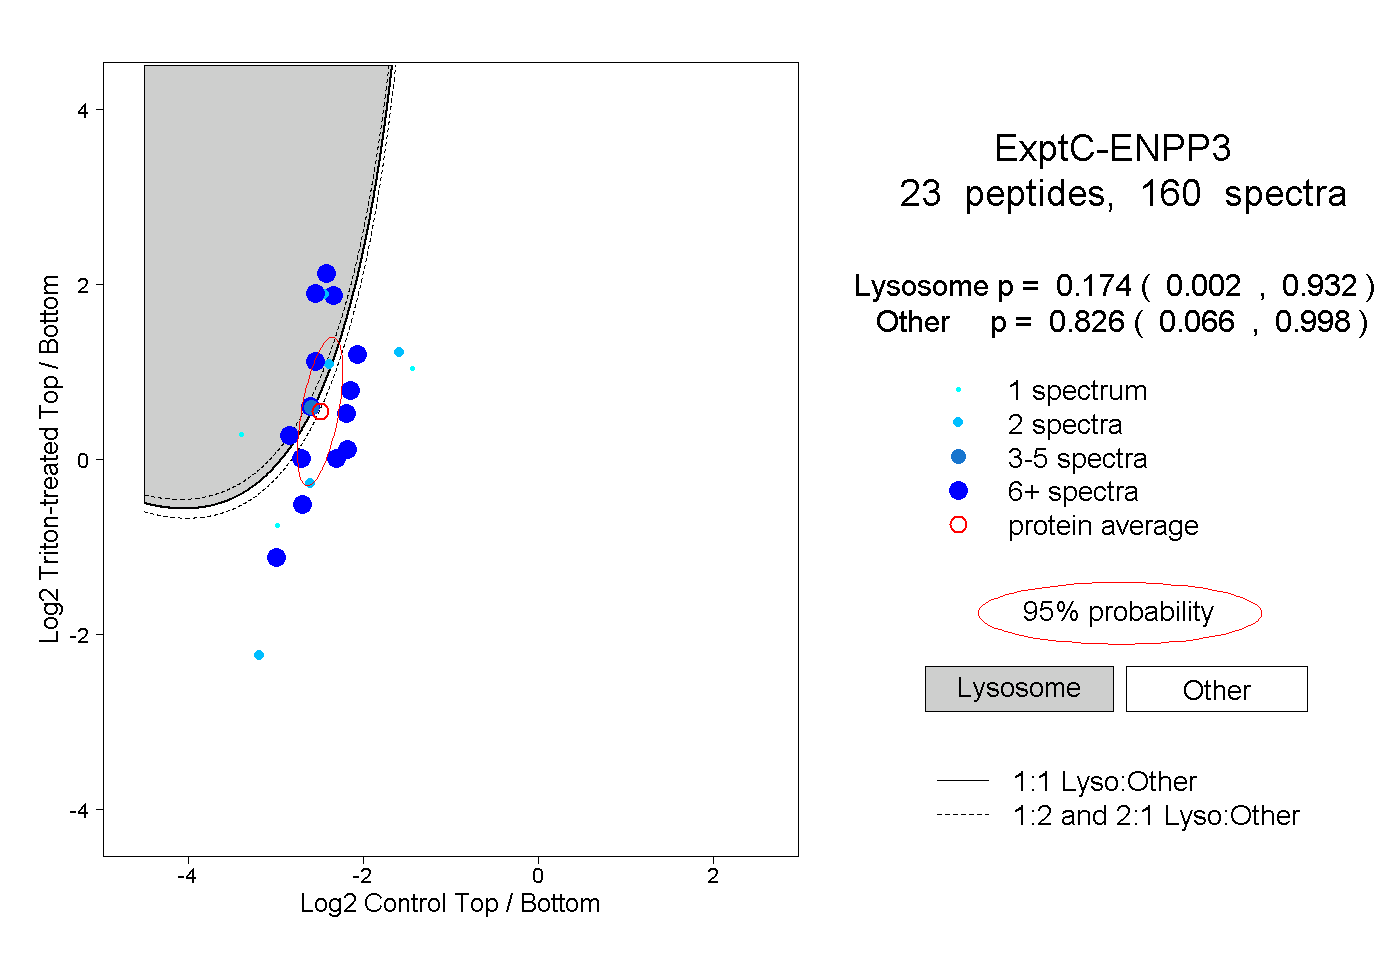
0.002 | 0.932
0.066 | 0.998
11peptides
spectra
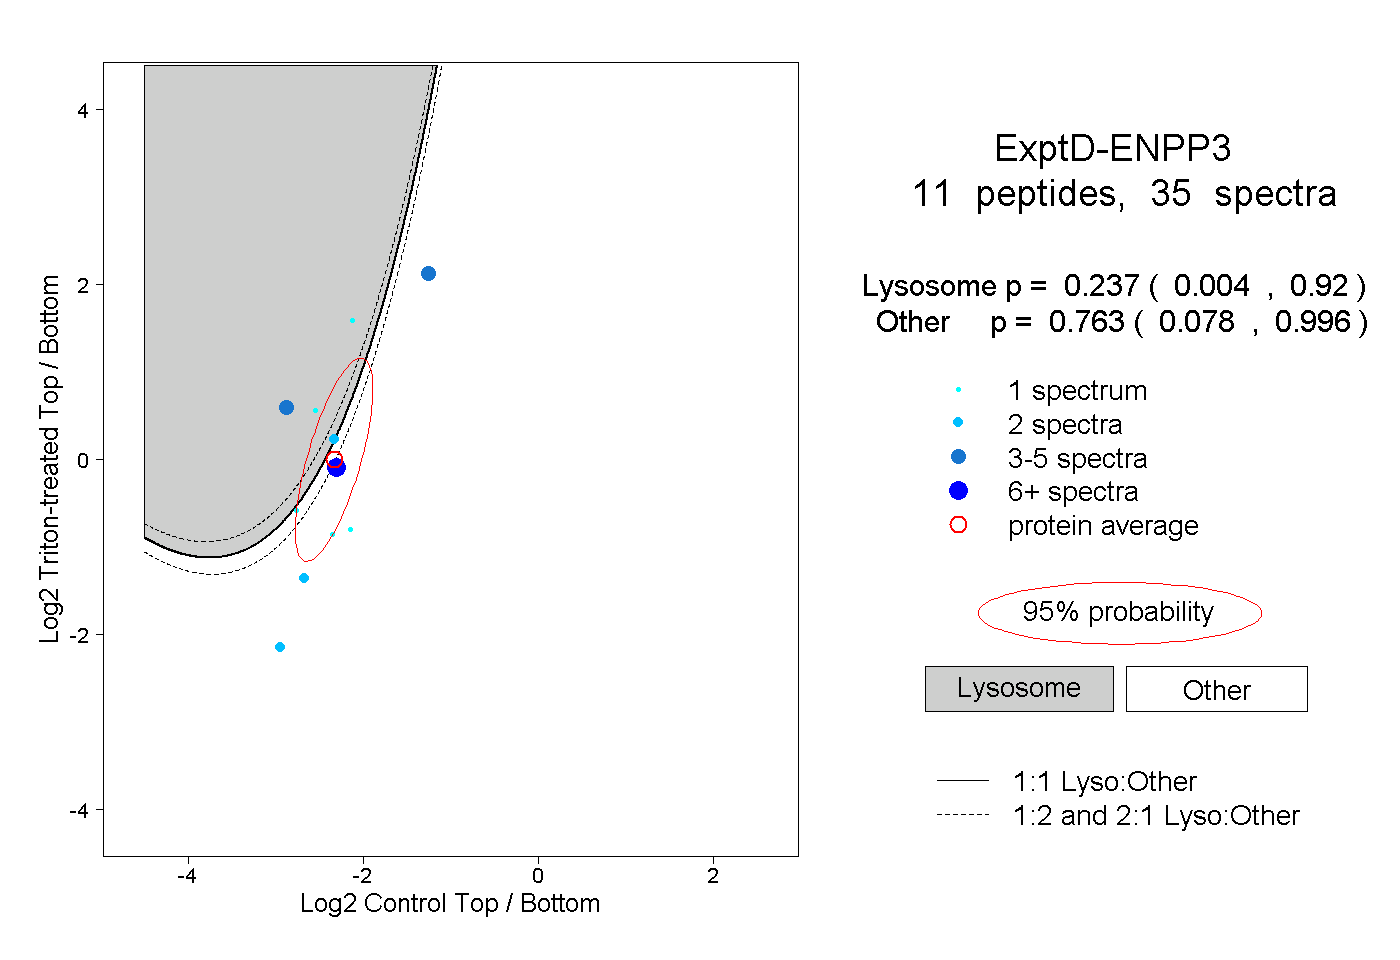
0.004 | 0.920
0.078 | 0.996