 15
15peptides
spectra
0.000 | 0.000
0.237 | 0.253
0.000 | 0.000
0.000 | 0.000
0.000 | 0.000
0.745 | 0.761
0.000 | 0.000
0.000 | 0.000
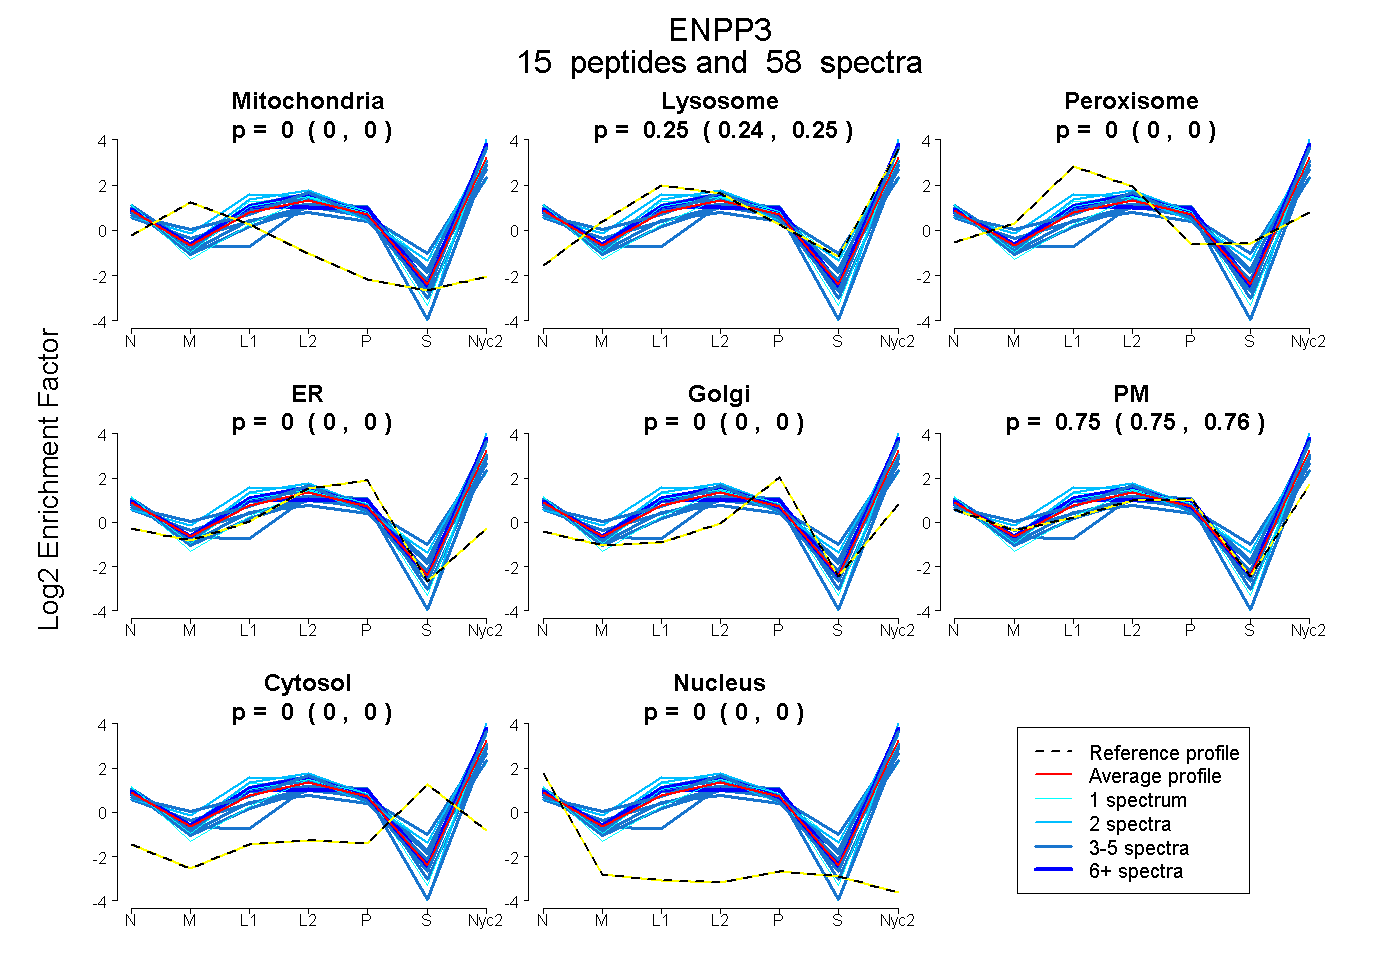
| Plot | Mito | Lyso | Perox | ER | Golgi | PM | Cytosol | Nucleus | |||||
| Expt A |
15 peptides |
58 spectra |
|
0.000 0.000 | 0.000 |
0.246 0.237 | 0.253 |
0.000 0.000 | 0.000 |
0.000 0.000 | 0.000 |
0.000 0.000 | 0.000 |
0.754 0.745 | 0.761 |
0.000 0.000 | 0.000 |
0.000 0.000 | 0.000 |
| 2 spectra, SMEAIFLAHGPSFK | 0.000 | 0.563 | 0.000 | 0.000 | 0.000 | 0.437 | 0.000 | 0.000 | ||
| 4 spectra, SGPVSAGVIK | 0.000 | 0.402 | 0.000 | 0.000 | 0.000 | 0.598 | 0.000 | 0.000 | ||
| 6 spectra, MWDYFHK | 0.000 | 0.329 | 0.000 | 0.000 | 0.000 | 0.671 | 0.000 | 0.000 | ||
| 3 spectra, DCCTDYK | 0.000 | 0.120 | 0.000 | 0.000 | 0.000 | 0.880 | 0.000 | 0.000 | ||
| 3 spectra, APFYQPSHAEELSK | 0.000 | 0.363 | 0.000 | 0.000 | 0.000 | 0.583 | 0.054 | 0.000 | ||
| 3 spectra, AEDLWVEER | 0.000 | 0.099 | 0.000 | 0.000 | 0.000 | 0.872 | 0.029 | 0.000 | ||
| 1 spectrum, TQPVSEILQLK | 0.000 | 0.102 | 0.000 | 0.000 | 0.000 | 0.898 | 0.000 | 0.000 | ||
| 1 spectrum, VDPSESQK | 0.000 | 0.187 | 0.000 | 0.000 | 0.000 | 0.813 | 0.000 | 0.000 | ||
| 18 spectra, TNLPFGRPR | 0.000 | 0.353 | 0.000 | 0.000 | 0.000 | 0.647 | 0.000 | 0.000 | ||
| 3 spectra, QWLAYR | 0.000 | 0.167 | 0.000 | 0.000 | 0.000 | 0.827 | 0.000 | 0.007 | ||
| 4 spectra, VHLMVDR | 0.000 | 0.363 | 0.000 | 0.000 | 0.000 | 0.637 | 0.000 | 0.000 | ||
| 2 spectra, SAGCGFTTPLPK | 0.000 | 0.258 | 0.000 | 0.000 | 0.000 | 0.742 | 0.000 | 0.000 | ||
| 1 spectrum, GDCCWDFEDTCVK | 0.000 | 0.120 | 0.212 | 0.000 | 0.000 | 0.668 | 0.000 | 0.000 | ||
| 4 spectra, STQIWTCNSFR | 0.000 | 0.084 | 0.000 | 0.000 | 0.000 | 0.916 | 0.000 | 0.000 | ||
| 3 spectra, GLEGCR | 0.000 | 0.000 | 0.000 | 0.000 | 0.000 | 0.932 | 0.068 | 0.000 |
| Plot | Mito | Lyso or Perox | ER | Golgi | PM | Cytosol | Nucleus | ||||||
| Expt B |
7 peptides |
16 spectra |
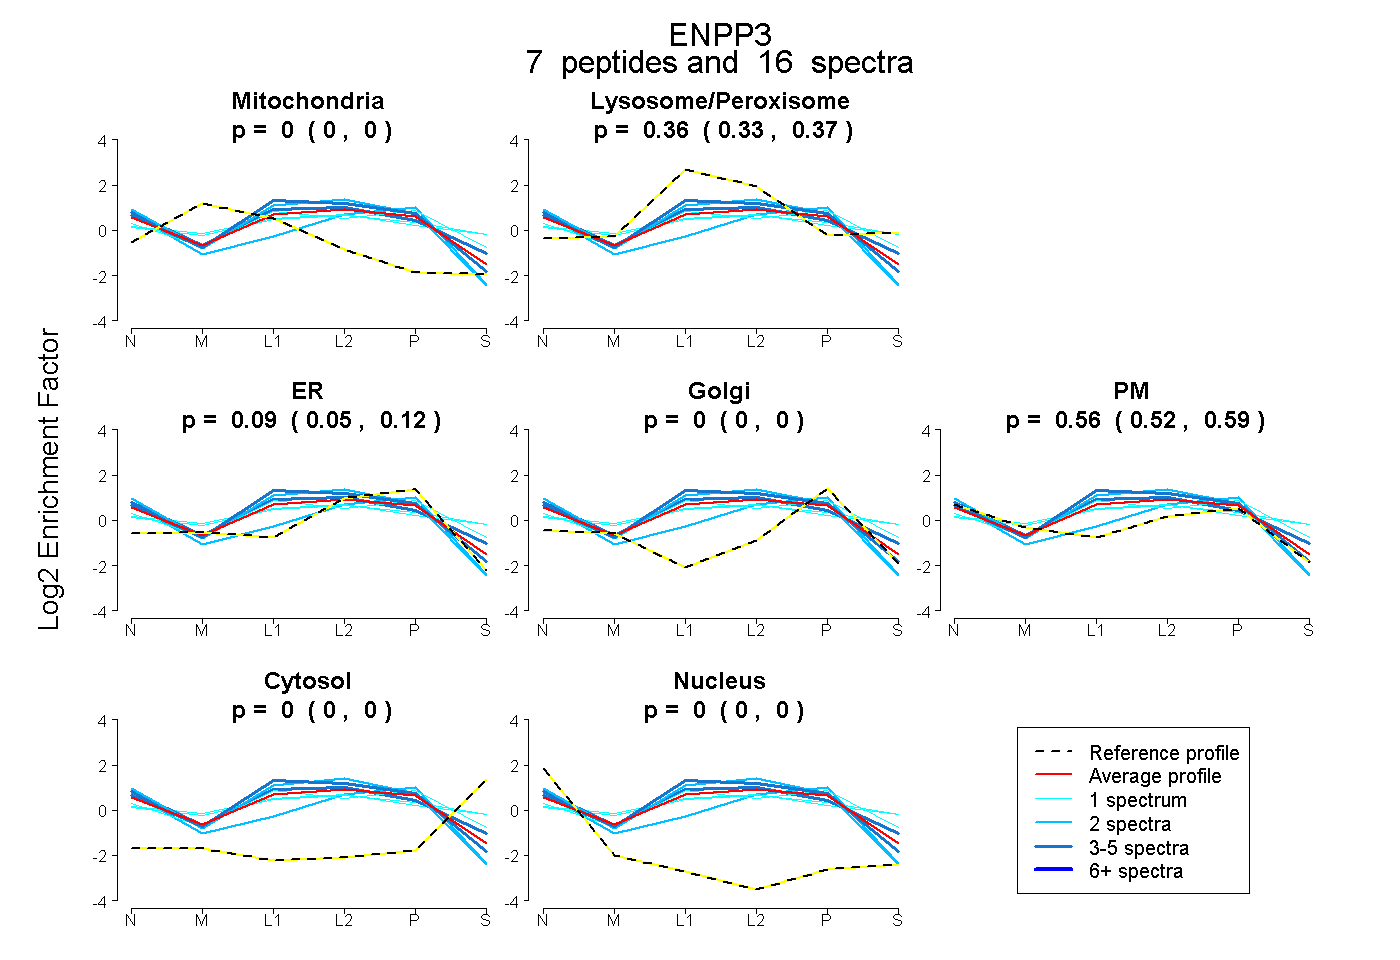 |
0.000 0.000 | 0.000 |
0.355 0.330 | 0.375 |
0.089 0.048 | 0.123 |
0.000 0.000 | 0.000 |
0.556 0.520 | 0.586 |
0.000 0.000 | 0.000 |
0.000 0.000 | 0.000 |
|||
| Plot | Lyso | Other | |||||||||||
| Expt C |
23 peptides |
160 spectra |
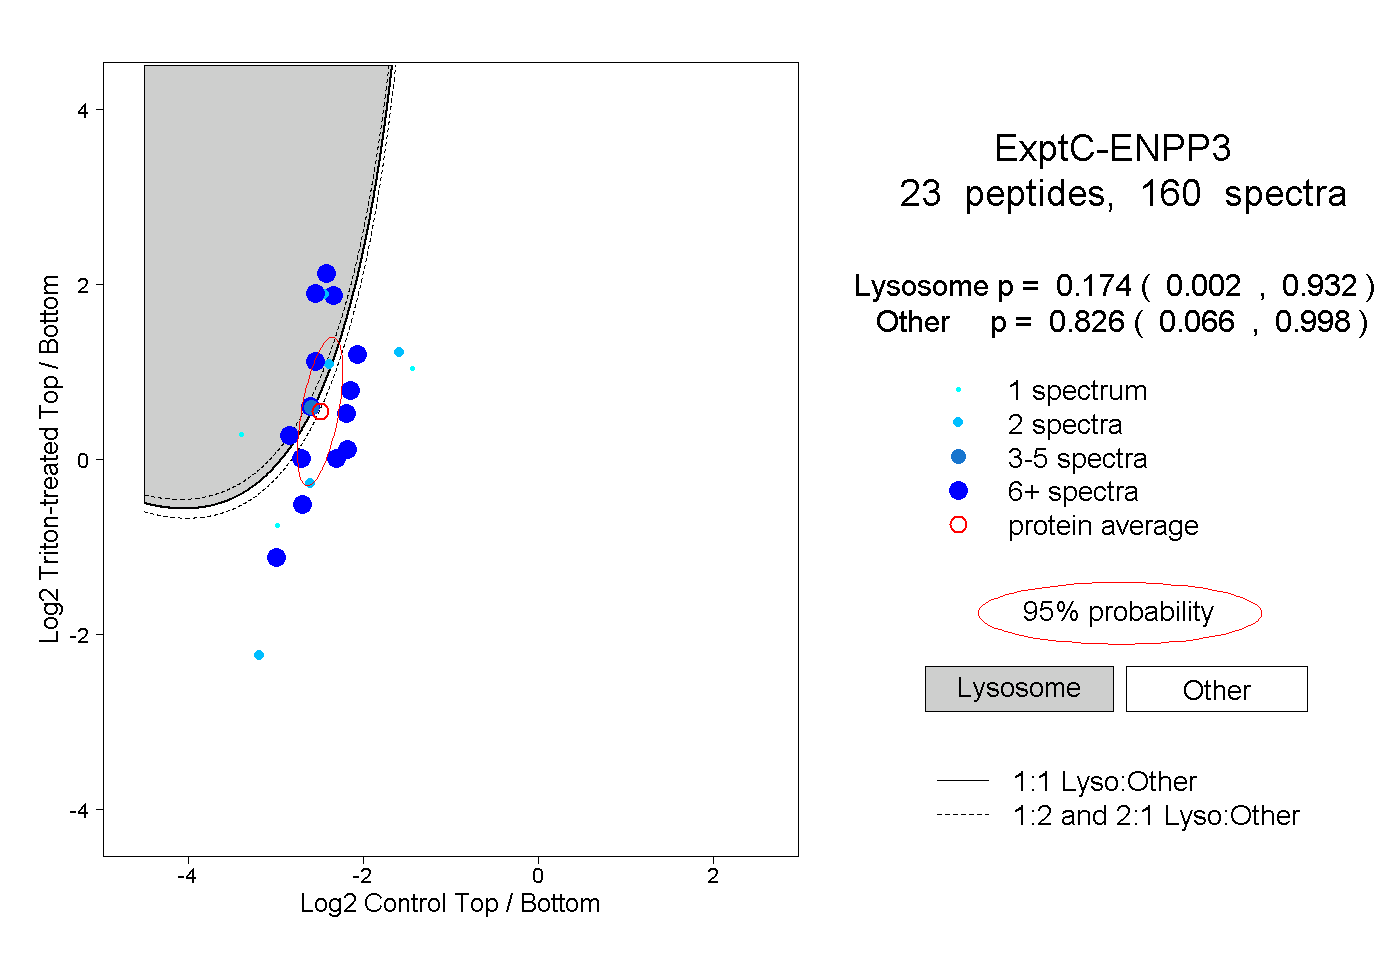 |
0.174 0.002 | 0.932 |
0.826 0.066 | 0.998 |
||||||||
| Plot | Lyso | Other | |||||||||||
| Expt D |
11 peptides |
35 spectra |
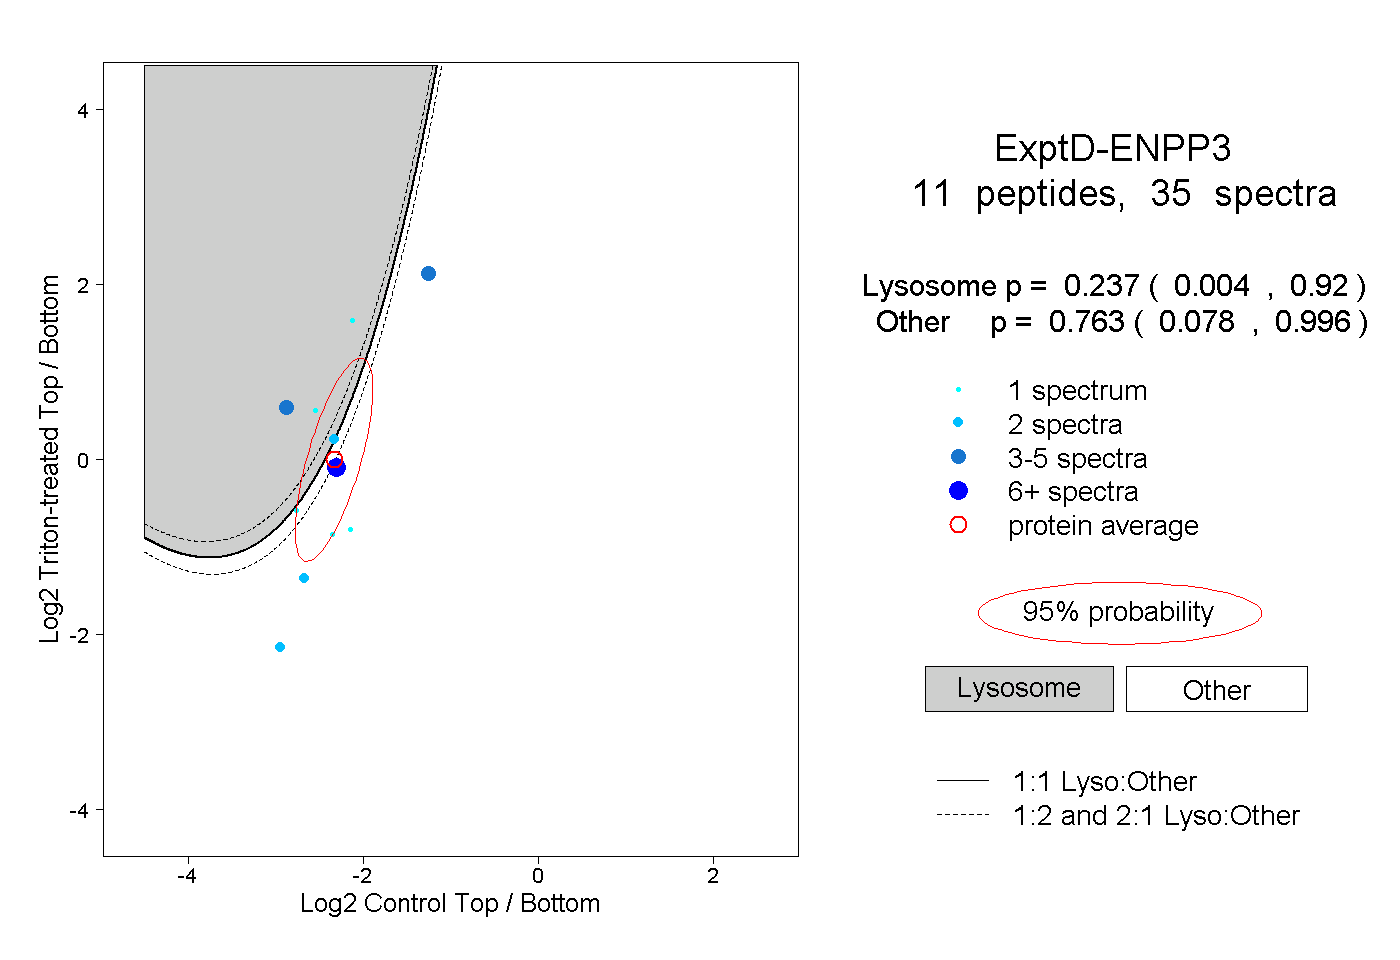 |
0.237 0.004 | 0.920 |
0.763 0.078 | 0.996 |