 9
9peptides
spectra
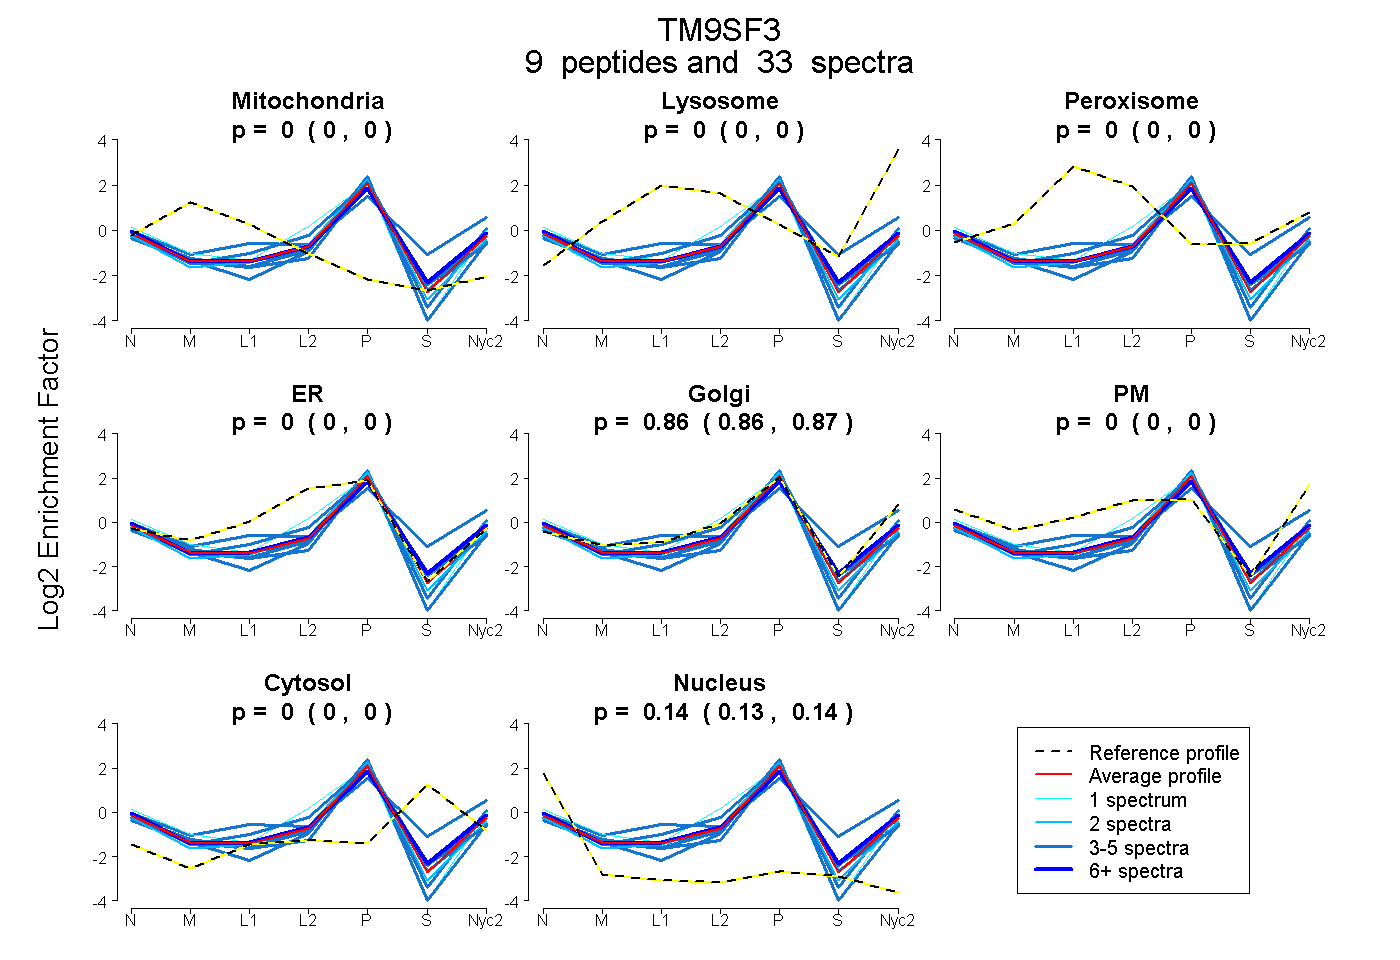
0.000 | 0.000
0.000 | 0.000
0.000 | 0.000
0.000 | 0.000
0.857 | 0.866
0.000 | 0.000
0.000 | 0.000
0.133 | 0.142
3peptides
spectra
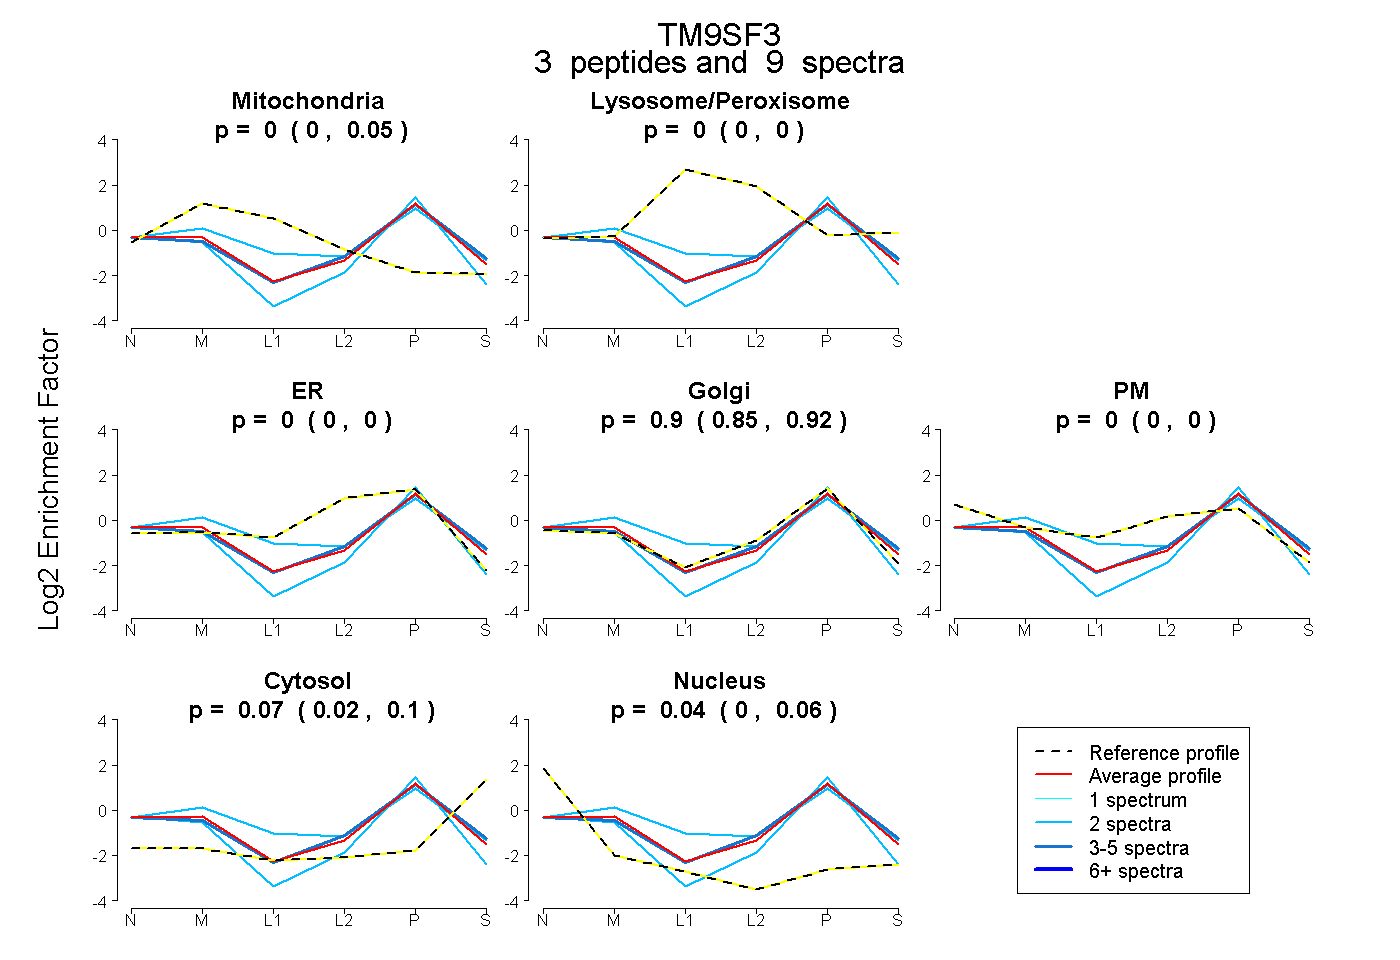
0.000 | 0.054
0.000 | 0.000
0.000 | 0.000
0.853 | 0.917
0.000 | 0.000
0.022 | 0.097
0.003 | 0.059
10peptides
spectra
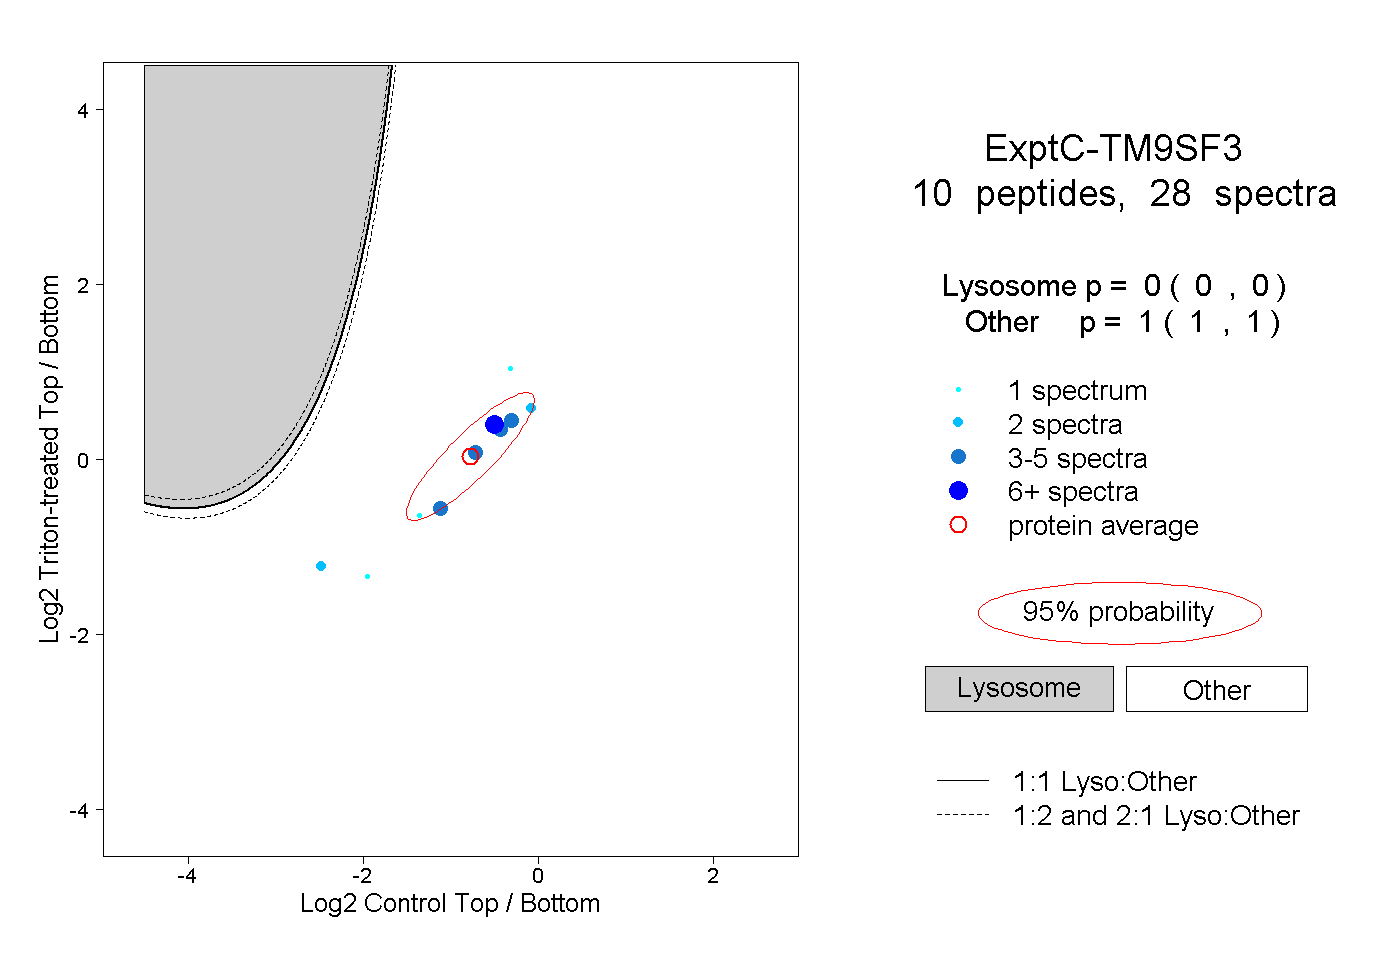
0.000 | 0.000
1.000 | 1.000
2peptides
spectra
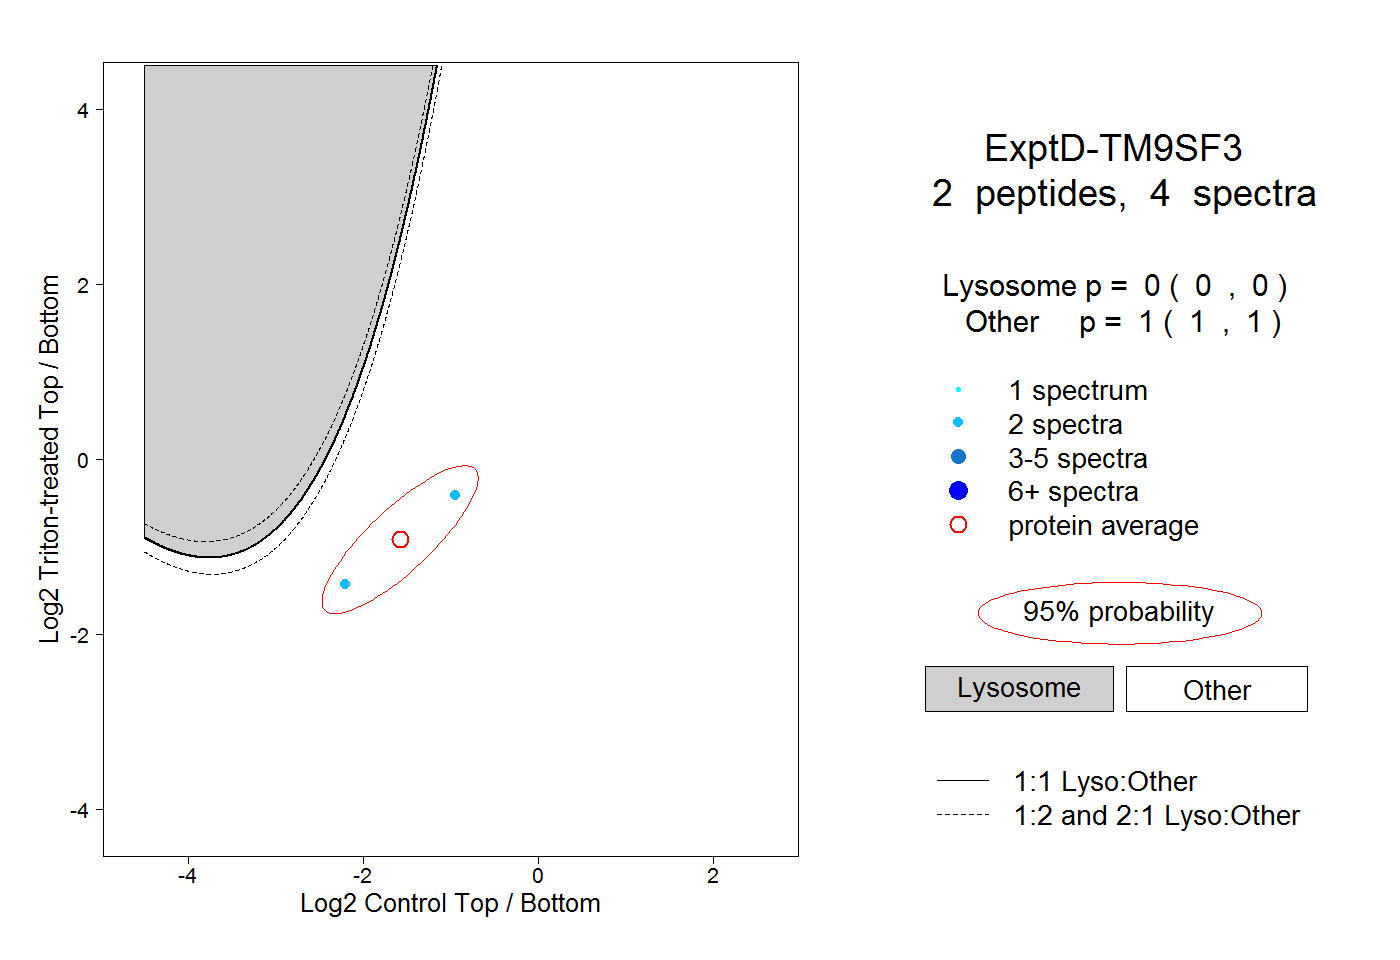
0.000 | 0.000
1.000 | 1.000