TM9SF3
[ENSRNOP00000018043]
Main page
| | | Plot |
Mito |
Lyso |
|
Perox |
ER |
Golgi |
PM |
Cytosol |
Nucleus |
|
| Expt A |
 9
9
peptides |
33
spectra |
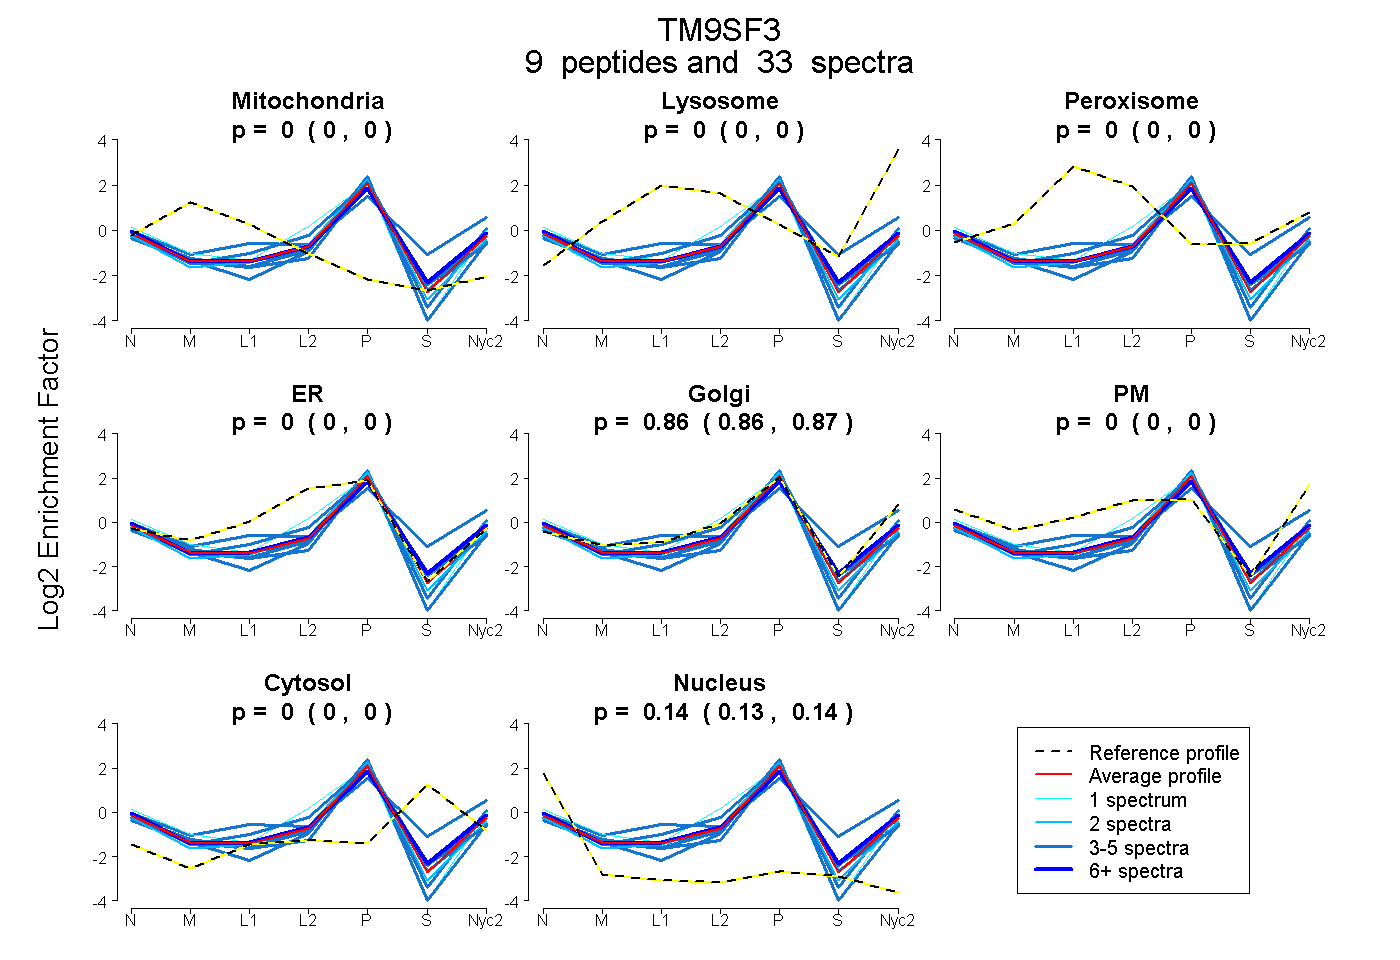 |
0.000
0.000 | 0.000 |
0.000
0.000 | 0.000 |
|
0.000
0.000 | 0.000 |
0.000
0.000 | 0.000 |
0.862
0.857 | 0.866 |
0.000
0.000 | 0.000 |
0.000
0.000 | 0.000 |
0.138
0.133 | 0.142 |
|
| | | Plot |
Mito |
|
Lyso or Perox |
|
ER |
Golgi |
PM |
Cytosol |
Nucleus |
|
| Expt B |
3
peptides |
9
spectra |
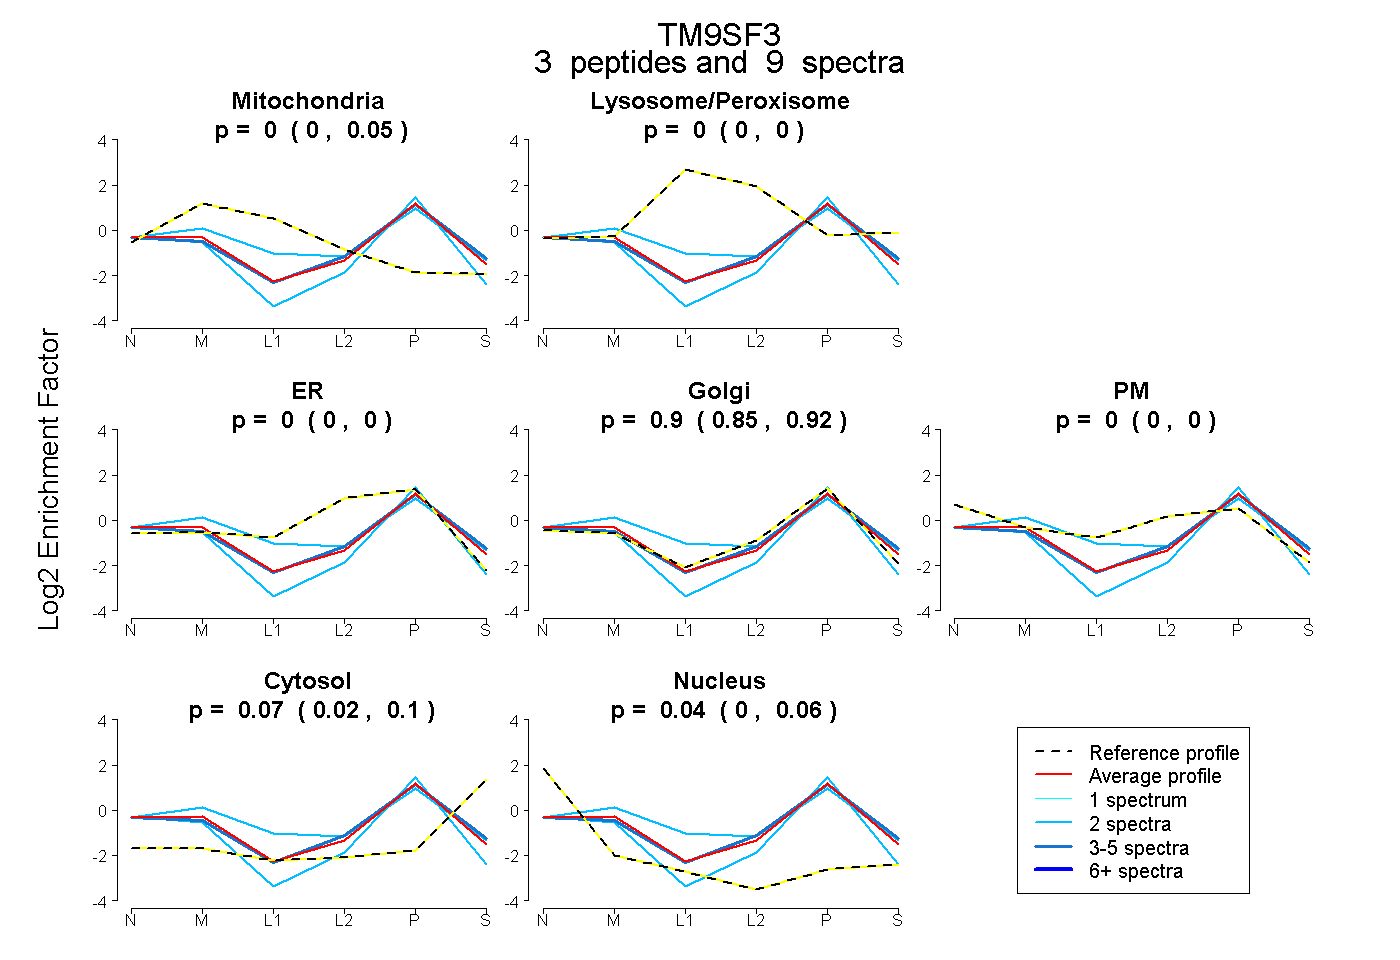 |
0.000
0.000 | 0.054 |
|
0.000
0.000 | 0.000 |
|
0.000
0.000 | 0.000 |
0.898
0.853 | 0.917 |
0.000
0.000 | 0.000 |
0.065
0.022 | 0.097 |
0.036
0.003 | 0.059 |
|
| 2 spectra, NLSGQPNFPCR |
0.185 |
|
0.074 |
|
0.000 |
0.717 |
0.000 |
0.025 |
0.000 |
|
| 5 spectra, YFSLPFCVGSK |
0.000 |
|
0.000 |
|
0.000 |
0.871 |
0.000 |
0.124 |
0.005 |
|
| 2 spectra, DAFVYAIK |
0.000 |
|
0.000 |
|
0.000 |
0.881 |
0.000 |
0.000 |
0.119 |
|
| | | Plot |
|
Lyso |
|
|
|
|
|
|
|
Other |
| Expt C |
10
peptides |
28
spectra |
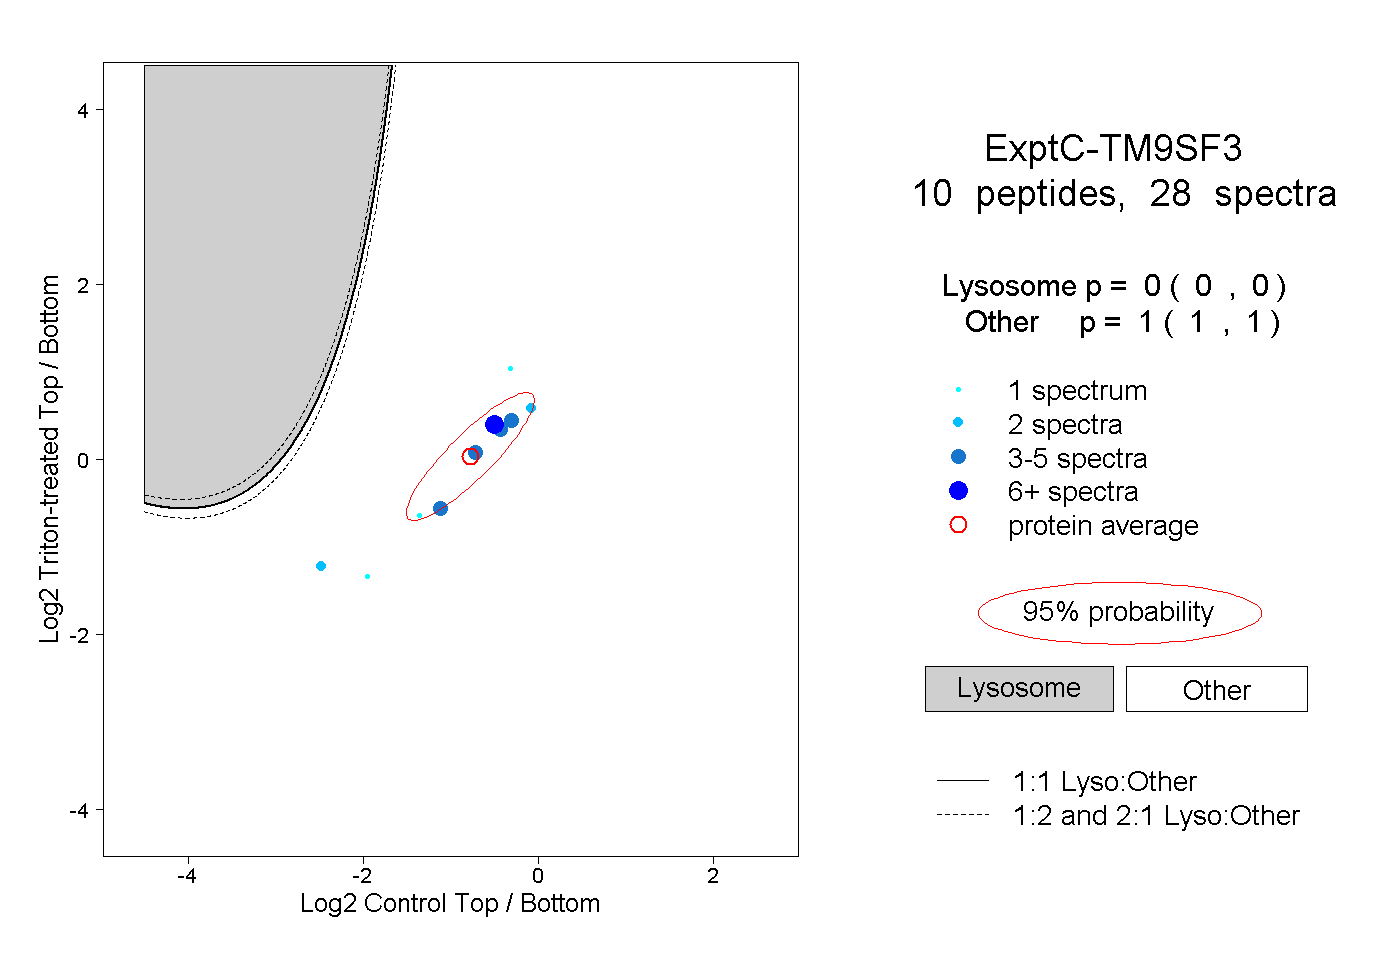 |
|
0.000
0.000 | 0.000 |
|
|
|
|
|
|
|
1.000
1.000 | 1.000 |
| | | Plot |
|
Lyso |
|
|
|
|
|
|
|
Other |
| Expt D |
2
peptides |
4
spectra |
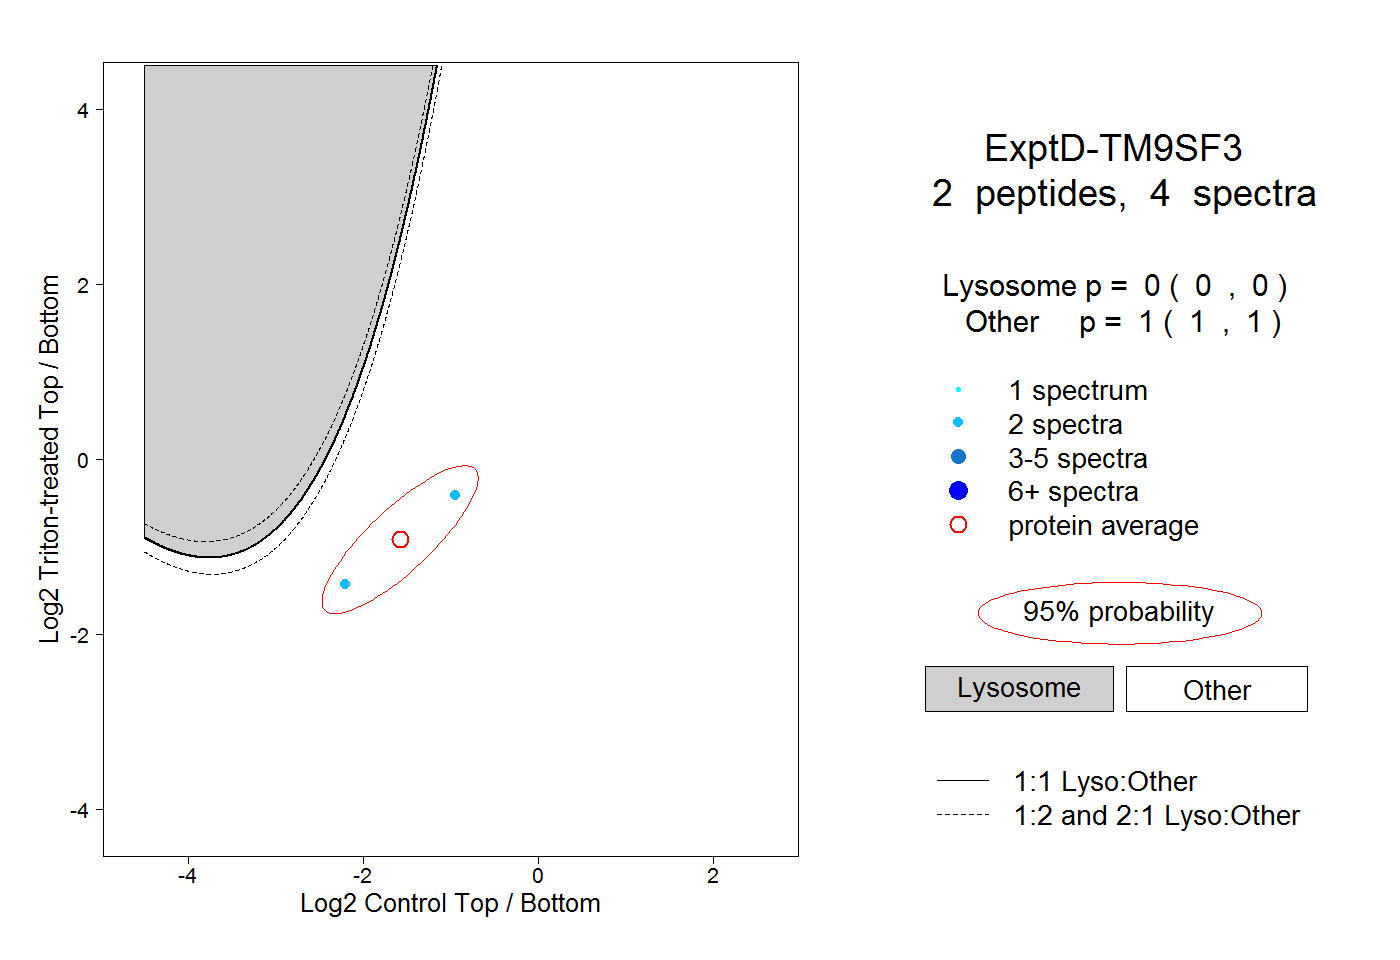 |
|
0.000
0.000 | 0.000 |
|
|
|
|
|
|
|
1.000
1.000 | 1.000 |