 9
9peptides
spectra
0.000 | 0.000
0.000 | 0.000
0.000 | 0.000
0.000 | 0.000
0.857 | 0.866
0.000 | 0.000
0.000 | 0.000
0.133 | 0.142
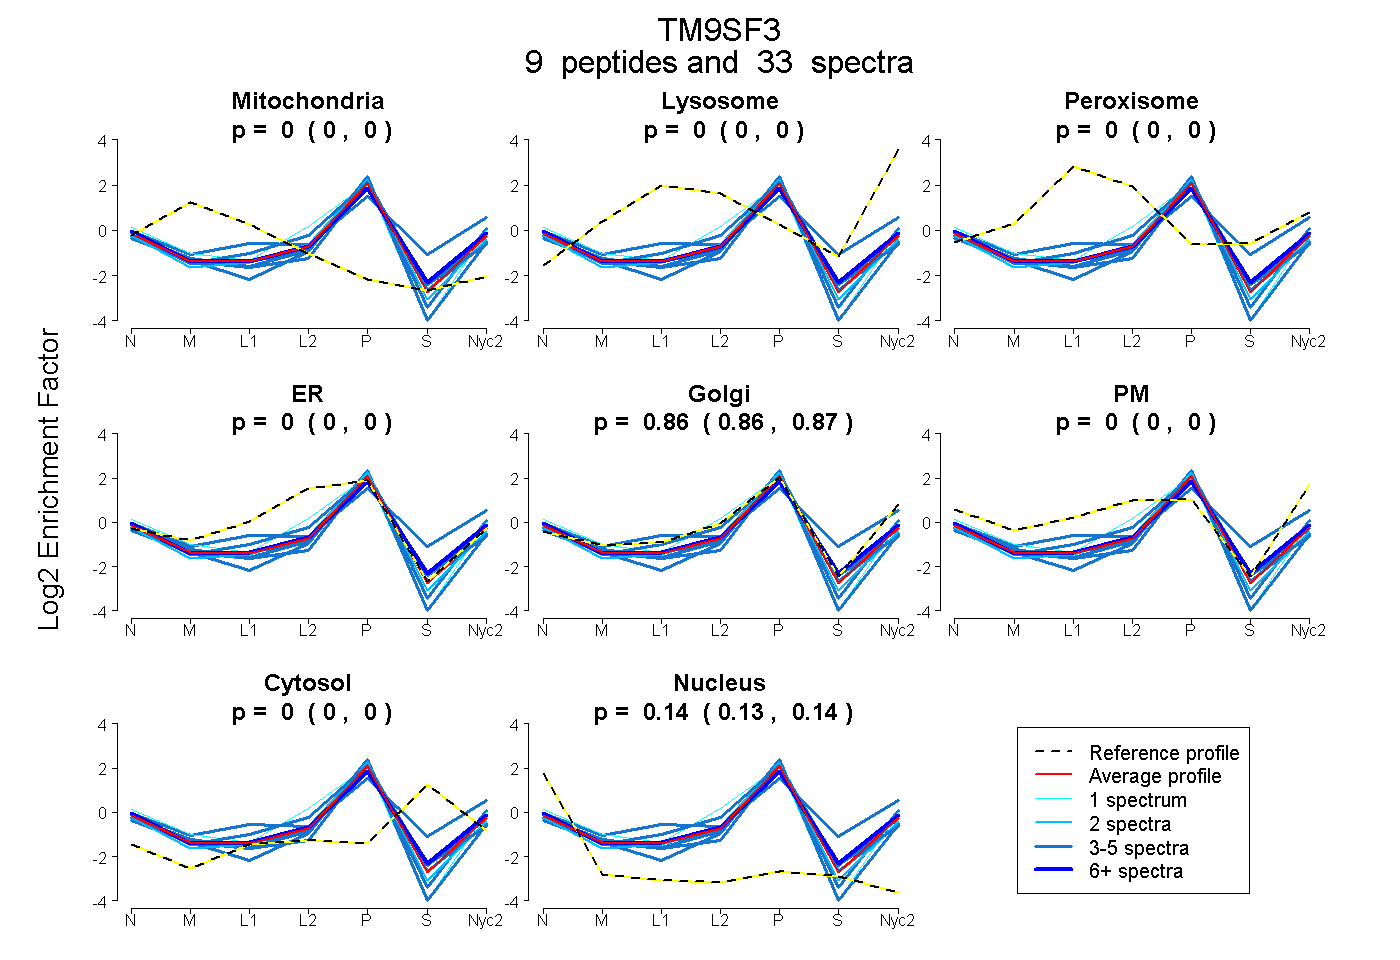
| Plot | Mito | Lyso | Perox | ER | Golgi | PM | Cytosol | Nucleus | |||||
| Expt A |
9 peptides |
33 spectra |
|
0.000 0.000 | 0.000 |
0.000 0.000 | 0.000 |
0.000 0.000 | 0.000 |
0.000 0.000 | 0.000 |
0.862 0.857 | 0.866 |
0.000 0.000 | 0.000 |
0.000 0.000 | 0.000 |
0.138 0.133 | 0.142 |
| 4 spectra, NLSGQPNFPCR | 0.000 | 0.000 | 0.000 | 0.000 | 0.822 | 0.000 | 0.000 | 0.178 | ||
| 8 spectra, YLDPSFFQHR | 0.000 | 0.000 | 0.000 | 0.000 | 0.851 | 0.000 | 0.000 | 0.149 | ||
| 2 spectra, VNAVPRPIPEK | 0.000 | 0.000 | 0.000 | 0.018 | 0.843 | 0.000 | 0.000 | 0.140 | ||
| 1 spectrum, IYTNVK | 0.000 | 0.000 | 0.000 | 0.295 | 0.610 | 0.000 | 0.000 | 0.095 | ||
| 5 spectra, DAFVYAIK | 0.000 | 0.000 | 0.000 | 0.000 | 0.878 | 0.000 | 0.000 | 0.122 | ||
| 4 spectra, YFSLPFCVGSK | 0.000 | 0.000 | 0.000 | 0.269 | 0.595 | 0.000 | 0.000 | 0.136 | ||
| 3 spectra, DLGDEYGWK | 0.000 | 0.000 | 0.000 | 0.000 | 0.823 | 0.000 | 0.000 | 0.177 | ||
| 3 spectra, IQMSYSVK | 0.000 | 0.000 | 0.023 | 0.000 | 0.642 | 0.111 | 0.223 | 0.000 | ||
| 3 spectra, LVPNTK | 0.000 | 0.000 | 0.000 | 0.000 | 0.856 | 0.000 | 0.000 | 0.144 |
| Plot | Mito | Lyso or Perox | ER | Golgi | PM | Cytosol | Nucleus | ||||||
| Expt B |
3 peptides |
9 spectra |
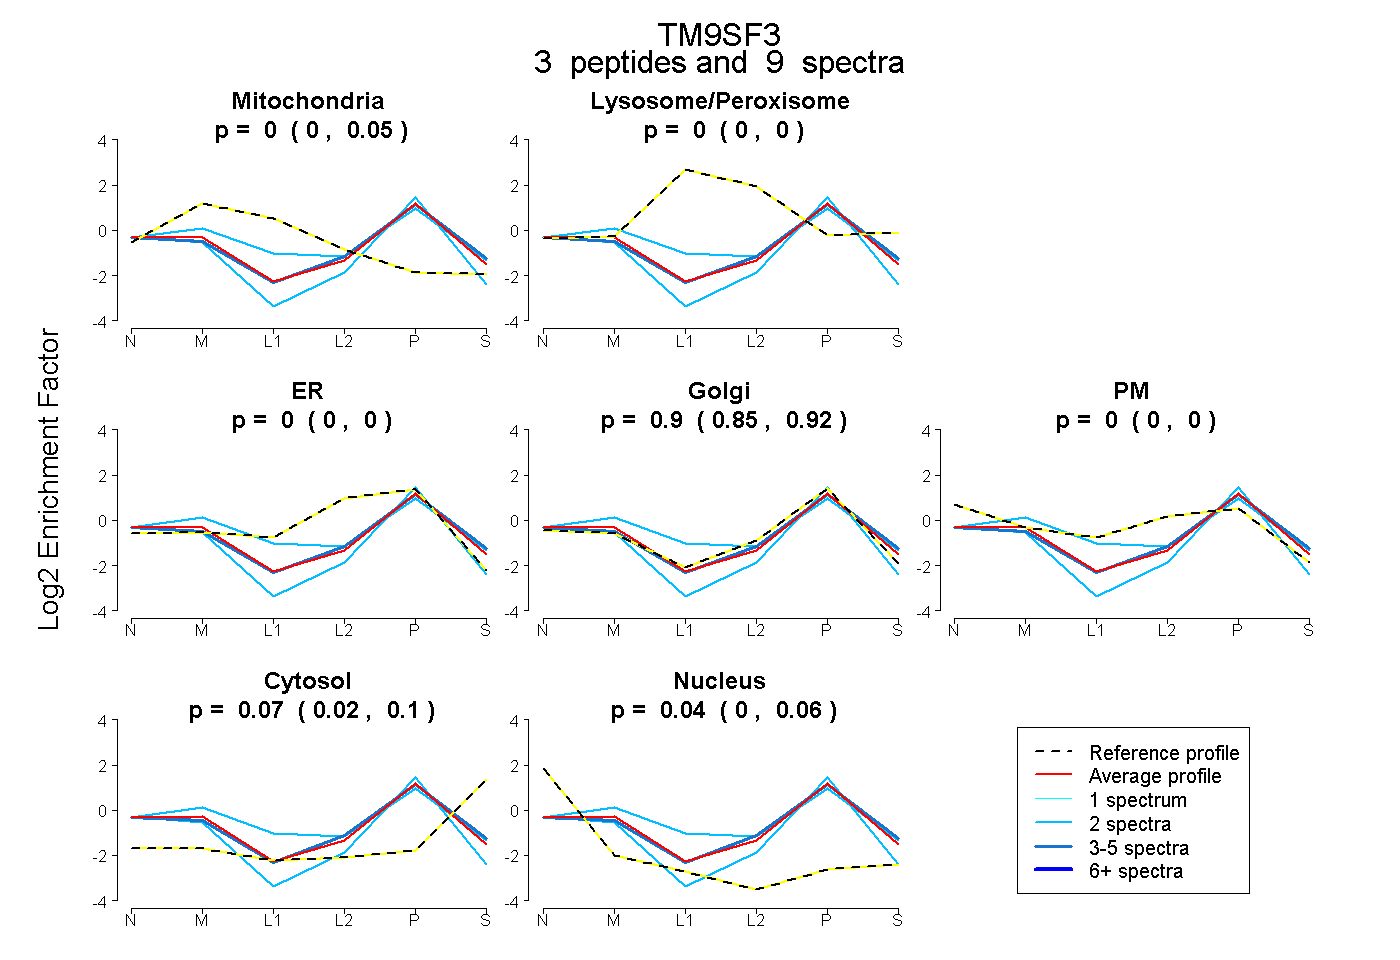 |
0.000 0.000 | 0.054 |
0.000 0.000 | 0.000 |
0.000 0.000 | 0.000 |
0.898 0.853 | 0.917 |
0.000 0.000 | 0.000 |
0.065 0.022 | 0.097 |
0.036 0.003 | 0.059 |
|||
| Plot | Lyso | Other | |||||||||||
| Expt C |
10 peptides |
28 spectra |
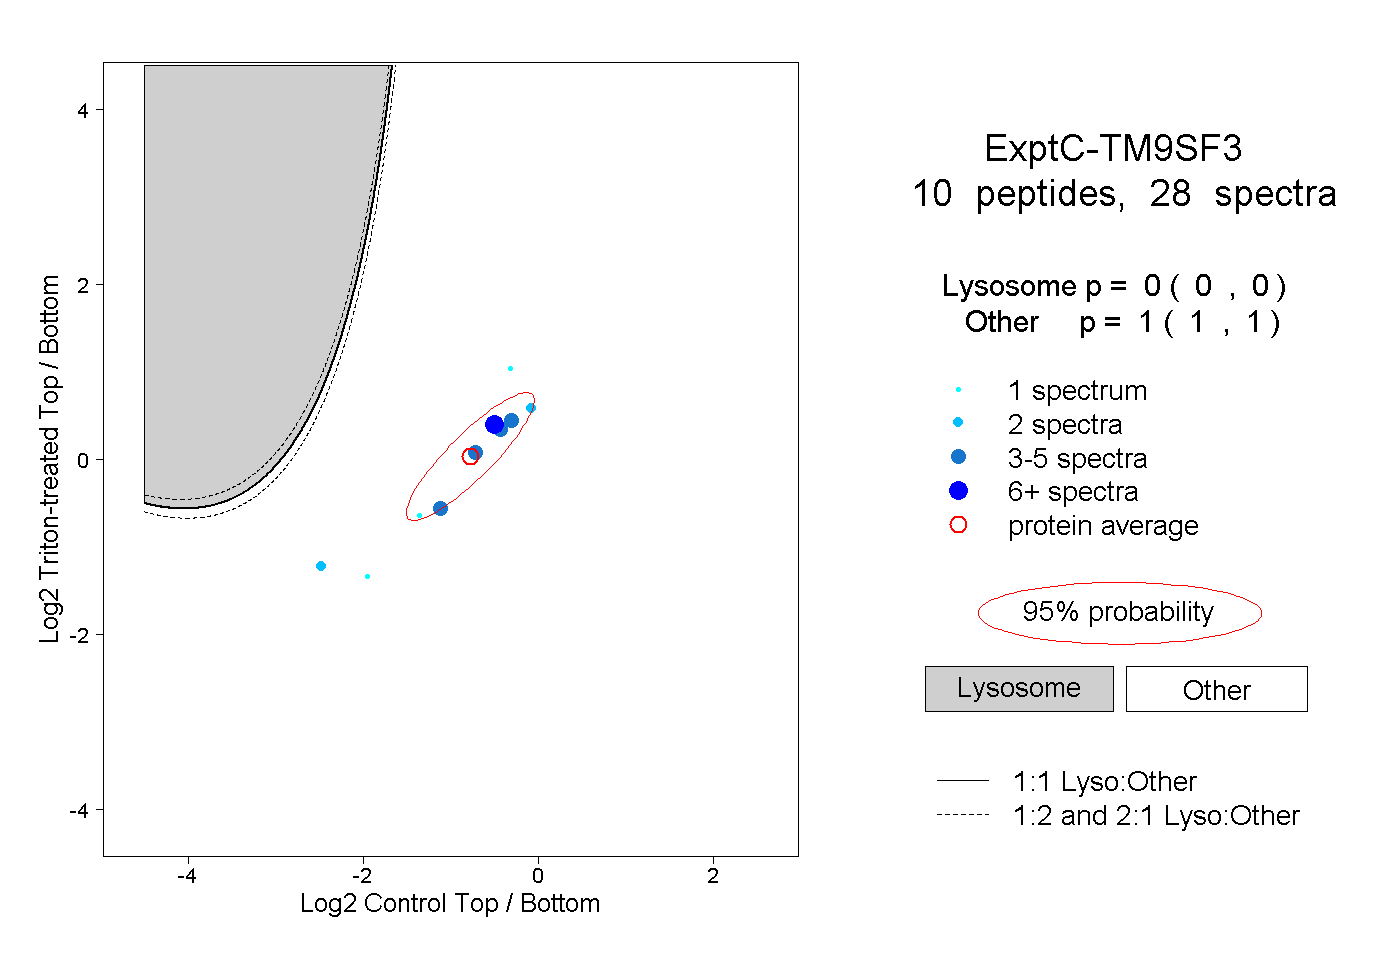 |
0.000 0.000 | 0.000 |
1.000 1.000 | 1.000 |
||||||||
| Plot | Lyso | Other | |||||||||||
| Expt D |
2 peptides |
4 spectra |
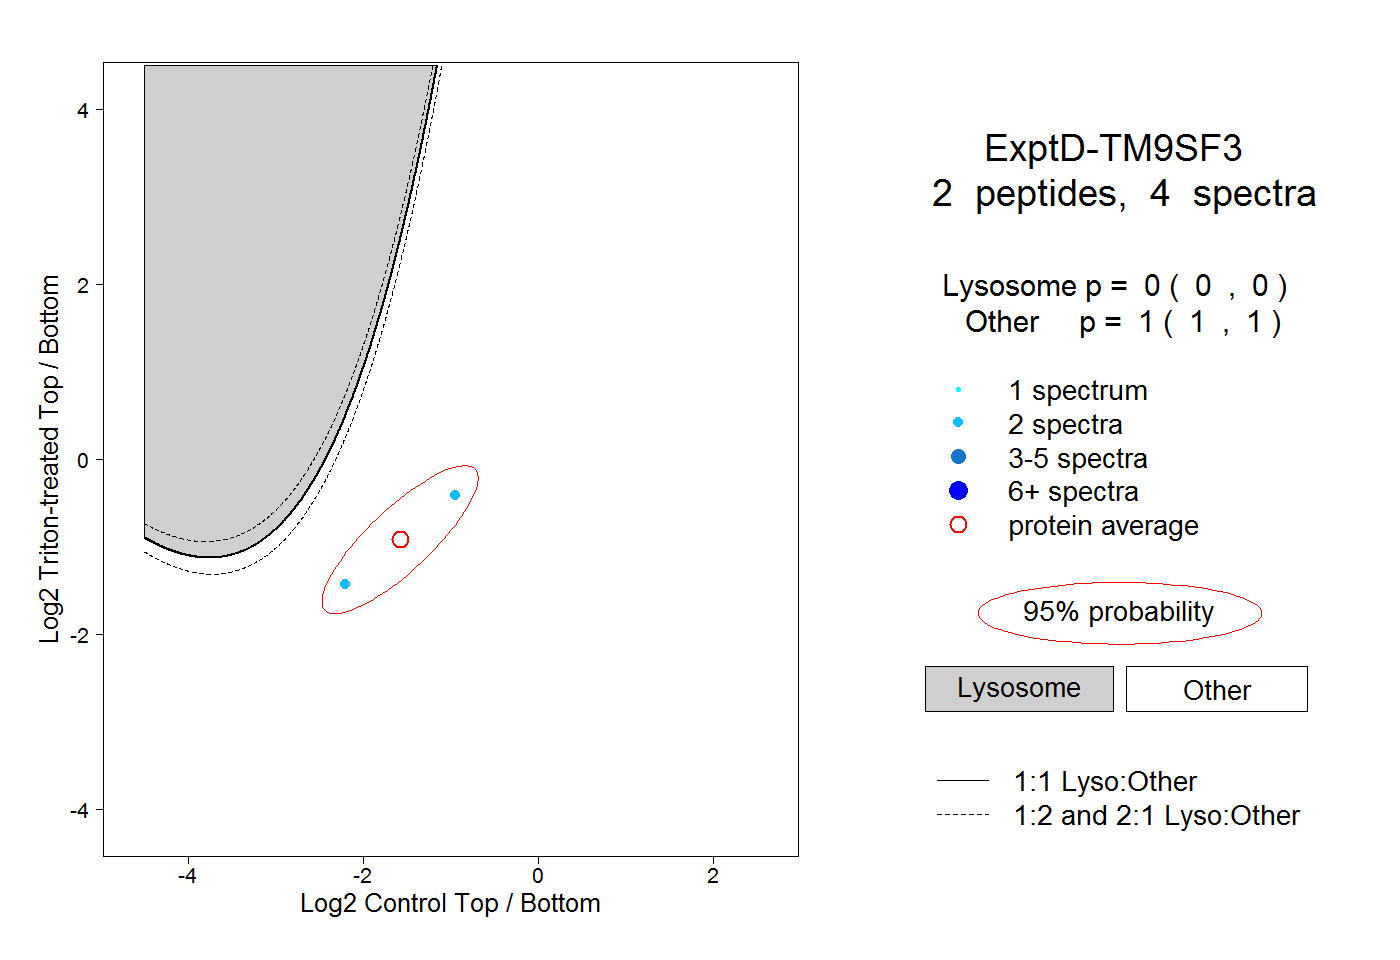 |
0.000 0.000 | 0.000 |
1.000 1.000 | 1.000 |