 25
25peptides
spectra
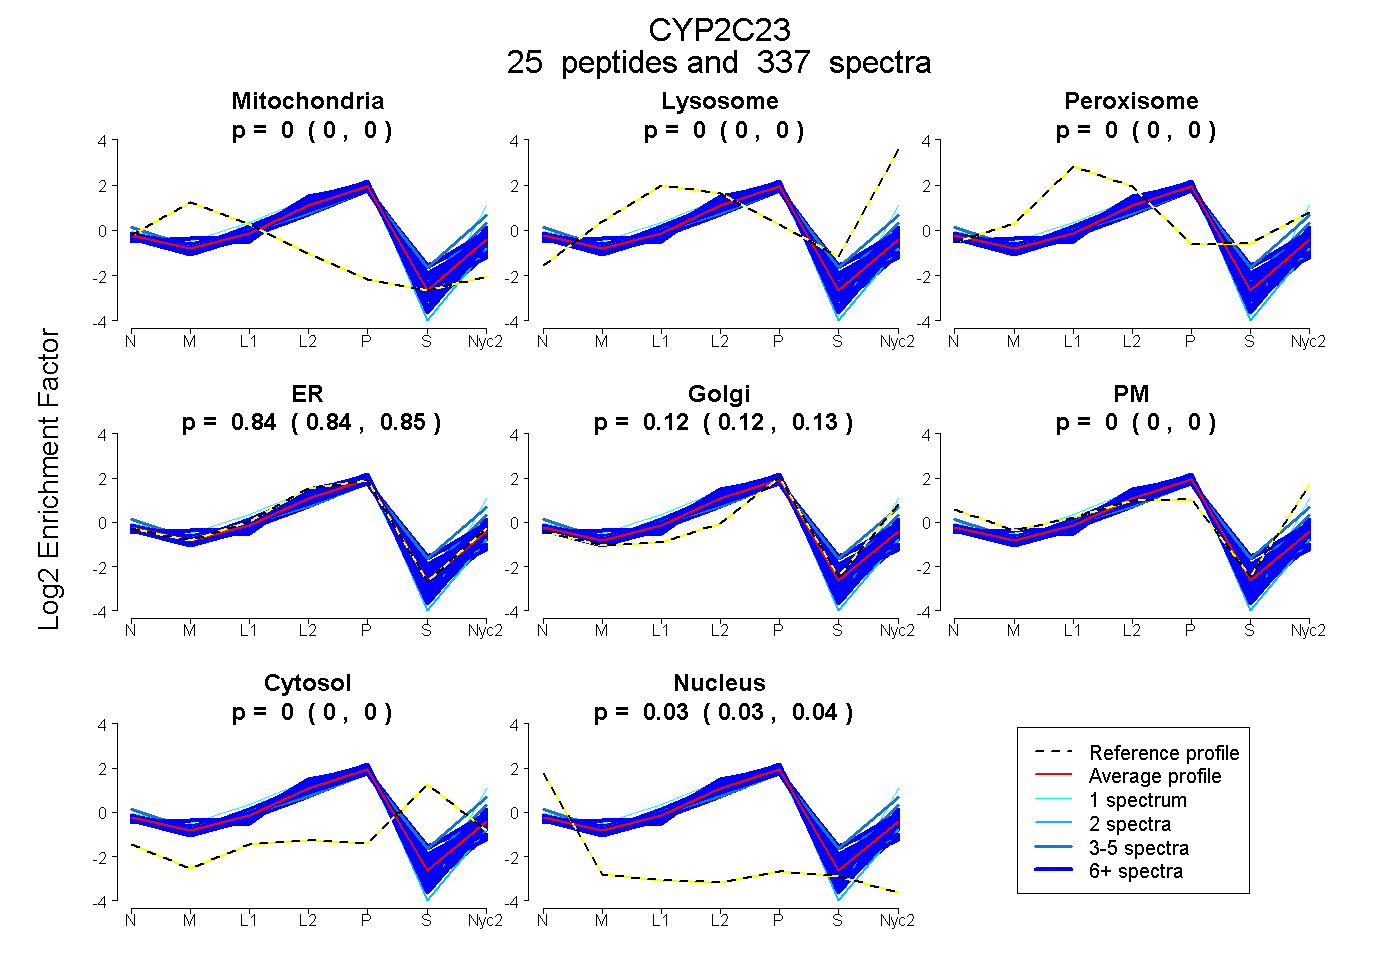
0.000 | 0.000
0.000 | 0.000
0.000 | 0.000
0.840 | 0.845
0.119 | 0.126
0.000 | 0.000
0.000 | 0.000
0.034 | 0.035
23peptides
spectra
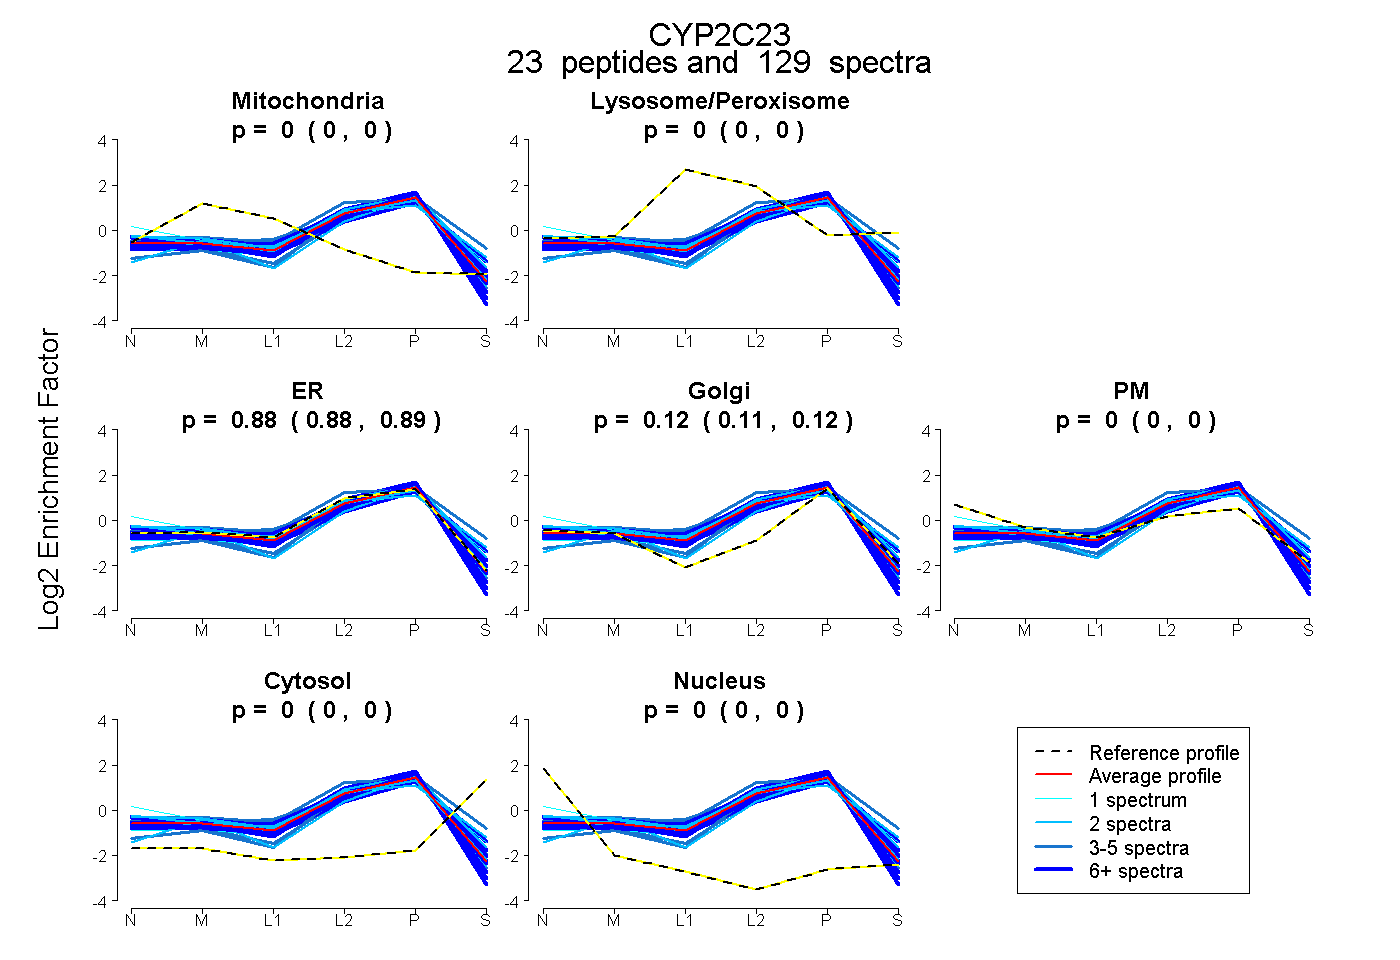
0.000 | 0.000
0.000 | 0.000
0.881 | 0.888
0.112 | 0.118
0.000 | 0.000
0.000 | 0.000
0.000 | 0.000
29peptides
spectra
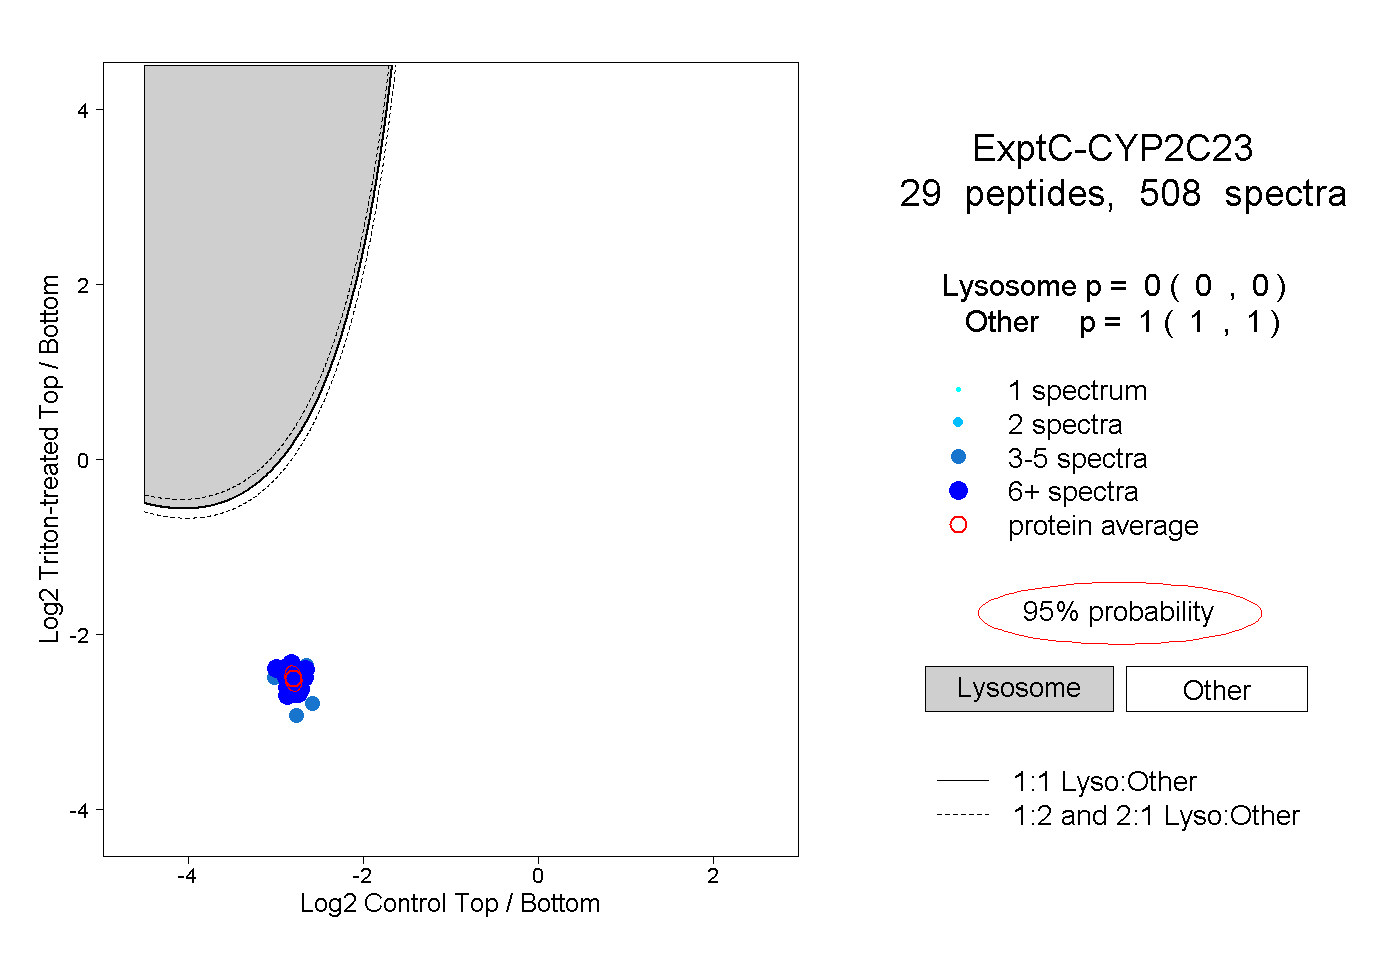
0.000 | 0.000
1.000 | 1.000
17peptides
spectra
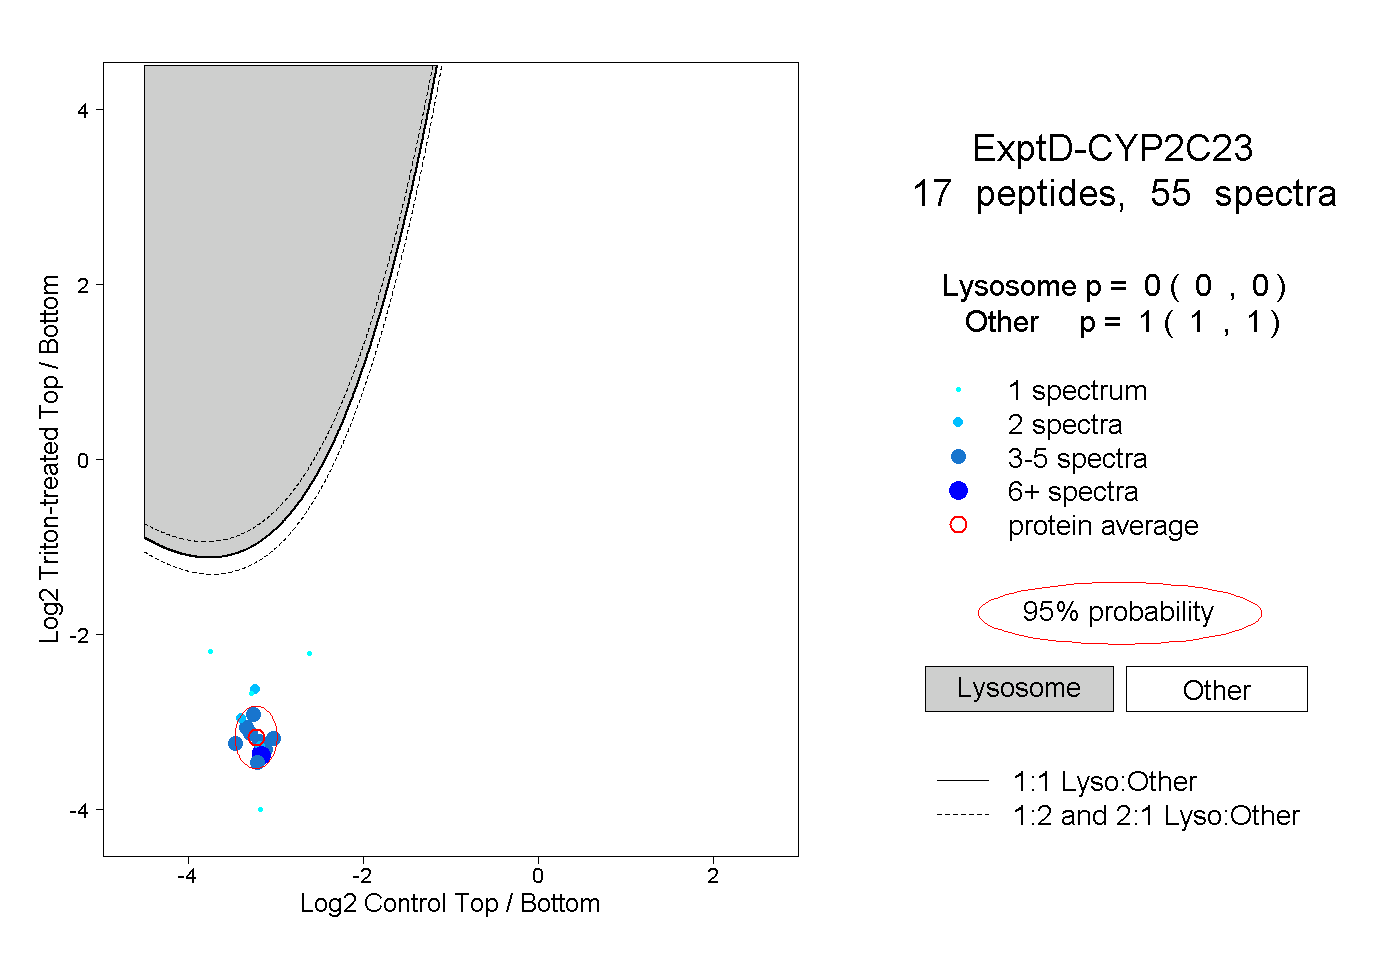
0.000 | 0.000
1.000 | 1.000