 25
25peptides
spectra
0.000 | 0.000
0.000 | 0.000
0.000 | 0.000
0.840 | 0.845
0.119 | 0.126
0.000 | 0.000
0.000 | 0.000
0.034 | 0.035
| Plot | Mito | Lyso | Perox | ER | Golgi | PM | Cytosol | Nucleus | |||||
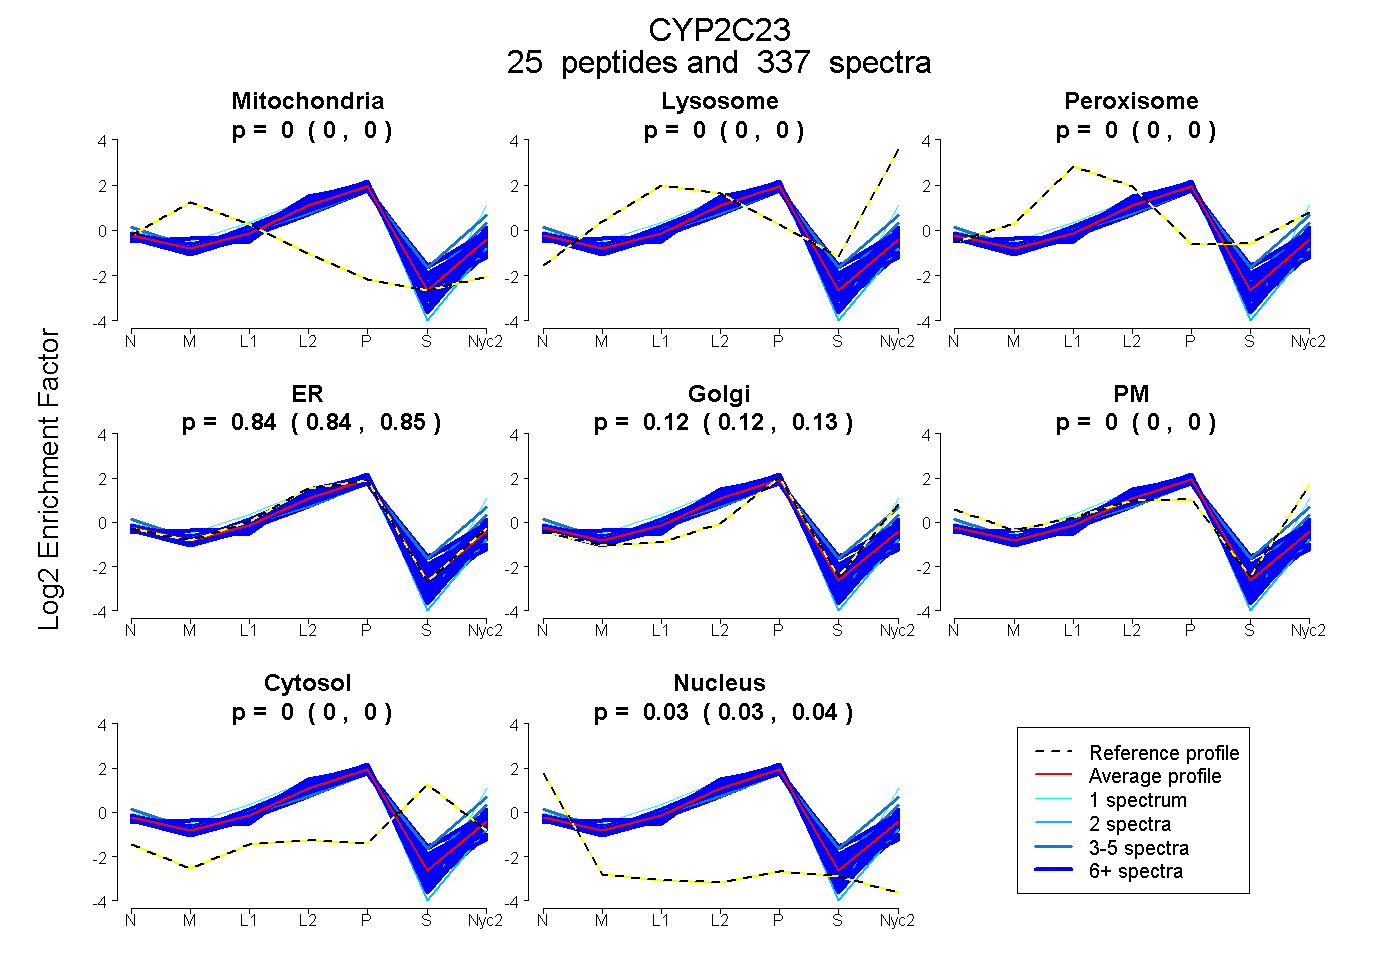
| Expt A |
25 peptides |
337 spectra |
|
0.000 0.000 | 0.000 |
0.000 0.000 | 0.000 |
0.000 0.000 | 0.000 |
0.843 0.840 | 0.845 |
0.123 0.119 | 0.126 |
0.000 0.000 | 0.000 |
0.000 0.000 | 0.000 |
0.034 0.034 | 0.035 |
| 19 spectra, GPLPIIEDTHK | 0.000 | 0.000 | 0.000 | 0.885 | 0.050 | 0.000 | 0.000 | 0.065 | ||
| 15 spectra, FDPGHFLDK | 0.000 | 0.000 | 0.000 | 0.841 | 0.067 | 0.000 | 0.047 | 0.046 | ||
| 12 spectra, EALLQQGDEFLGR | 0.000 | 0.000 | 0.000 | 0.939 | 0.000 | 0.000 | 0.000 | 0.061 | ||
| 7 spectra, GTTVLPMLSSVMLDQK | 0.000 | 0.000 | 0.044 | 0.585 | 0.259 | 0.000 | 0.113 | 0.000 | ||
| 51 spectra, HQPPSMK | 0.000 | 0.000 | 0.000 | 0.799 | 0.167 | 0.000 | 0.027 | 0.008 | ||
| 8 spectra, YPEVQAK | 0.037 | 0.000 | 0.000 | 0.790 | 0.090 | 0.000 | 0.071 | 0.011 | ||
| 5 spectra, TDYFVPFSLGK | 0.000 | 0.001 | 0.185 | 0.175 | 0.595 | 0.026 | 0.019 | 0.000 | ||
| 14 spectra, NFGMGK | 0.033 | 0.039 | 0.000 | 0.743 | 0.185 | 0.000 | 0.000 | 0.000 | ||
| 7 spectra, ACVGESLAR | 0.019 | 0.000 | 0.000 | 0.911 | 0.000 | 0.000 | 0.000 | 0.069 | ||
| 7 spectra, TLVEPK | 0.000 | 0.000 | 0.000 | 0.945 | 0.020 | 0.000 | 0.000 | 0.036 | ||
| 2 spectra, GYGLIFSNGER | 0.000 | 0.000 | 0.000 | 0.953 | 0.000 | 0.000 | 0.000 | 0.047 | ||
| 10 spectra, VQEEAR | 0.000 | 0.000 | 0.000 | 0.737 | 0.230 | 0.033 | 0.000 | 0.000 | ||
| 34 spectra, VHEEIDR | 0.000 | 0.000 | 0.000 | 0.943 | 0.050 | 0.000 | 0.000 | 0.007 | ||
| 11 spectra, HIEFAK | 0.010 | 0.000 | 0.022 | 0.850 | 0.026 | 0.000 | 0.091 | 0.000 | ||
| 7 spectra, NFILEK | 0.000 | 0.000 | 0.000 | 0.864 | 0.136 | 0.000 | 0.000 | 0.000 | ||
| 7 spectra, DIPASLSK | 0.000 | 0.000 | 0.000 | 0.680 | 0.146 | 0.000 | 0.174 | 0.000 | ||
| 5 spectra, FGLLLLMK | 0.000 | 0.000 | 0.000 | 0.615 | 0.049 | 0.297 | 0.039 | 0.000 | ||
| 17 spectra, EFANPEK | 0.025 | 0.000 | 0.000 | 0.810 | 0.148 | 0.000 | 0.000 | 0.017 | ||
| 1 spectrum, DFGMGK | 0.000 | 0.000 | 0.000 | 0.511 | 0.000 | 0.489 | 0.000 | 0.000 | ||
| 10 spectra, CLVEELQK | 0.009 | 0.000 | 0.000 | 0.962 | 0.000 | 0.000 | 0.000 | 0.029 | ||
| 13 spectra, DYIDCFLSK | 0.008 | 0.000 | 0.000 | 0.919 | 0.000 | 0.000 | 0.000 | 0.074 | ||
| 12 spectra, TFLNLMDLLNK | 0.000 | 0.000 | 0.000 | 0.838 | 0.148 | 0.000 | 0.000 | 0.014 | ||
| 29 spectra, SLDPANPR | 0.000 | 0.000 | 0.000 | 0.832 | 0.144 | 0.000 | 0.000 | 0.024 | ||
| 25 spectra, LCLVPR | 0.000 | 0.000 | 0.000 | 0.903 | 0.000 | 0.000 | 0.007 | 0.090 | ||
| 9 spectra, LPYTDAVLHEIQR | 0.000 | 0.000 | 0.000 | 0.863 | 0.000 | 0.000 | 0.081 | 0.055 |
| Plot | Mito | Lyso or Perox | ER | Golgi | PM | Cytosol | Nucleus | ||||||
| Expt B |
23 peptides |
129 spectra |
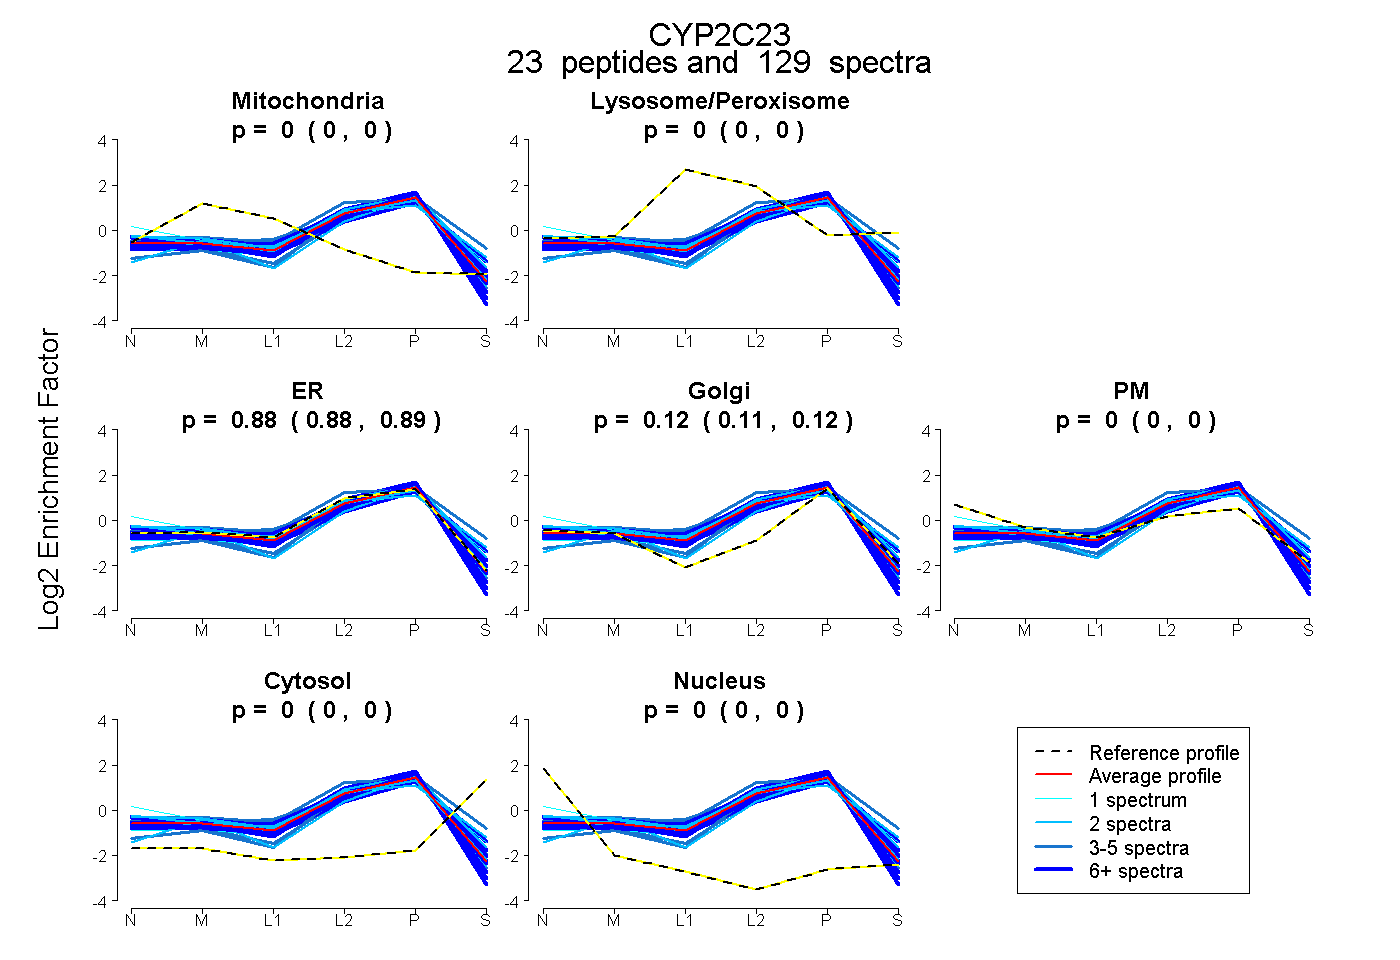 |
0.000 0.000 | 0.000 |
0.000 0.000 | 0.000 |
0.885 0.881 | 0.888 |
0.115 0.112 | 0.118 |
0.000 0.000 | 0.000 |
0.000 0.000 | 0.000 |
0.000 0.000 | 0.000 |
|||
| Plot | Lyso | Other | |||||||||||
| Expt C |
29 peptides |
508 spectra |
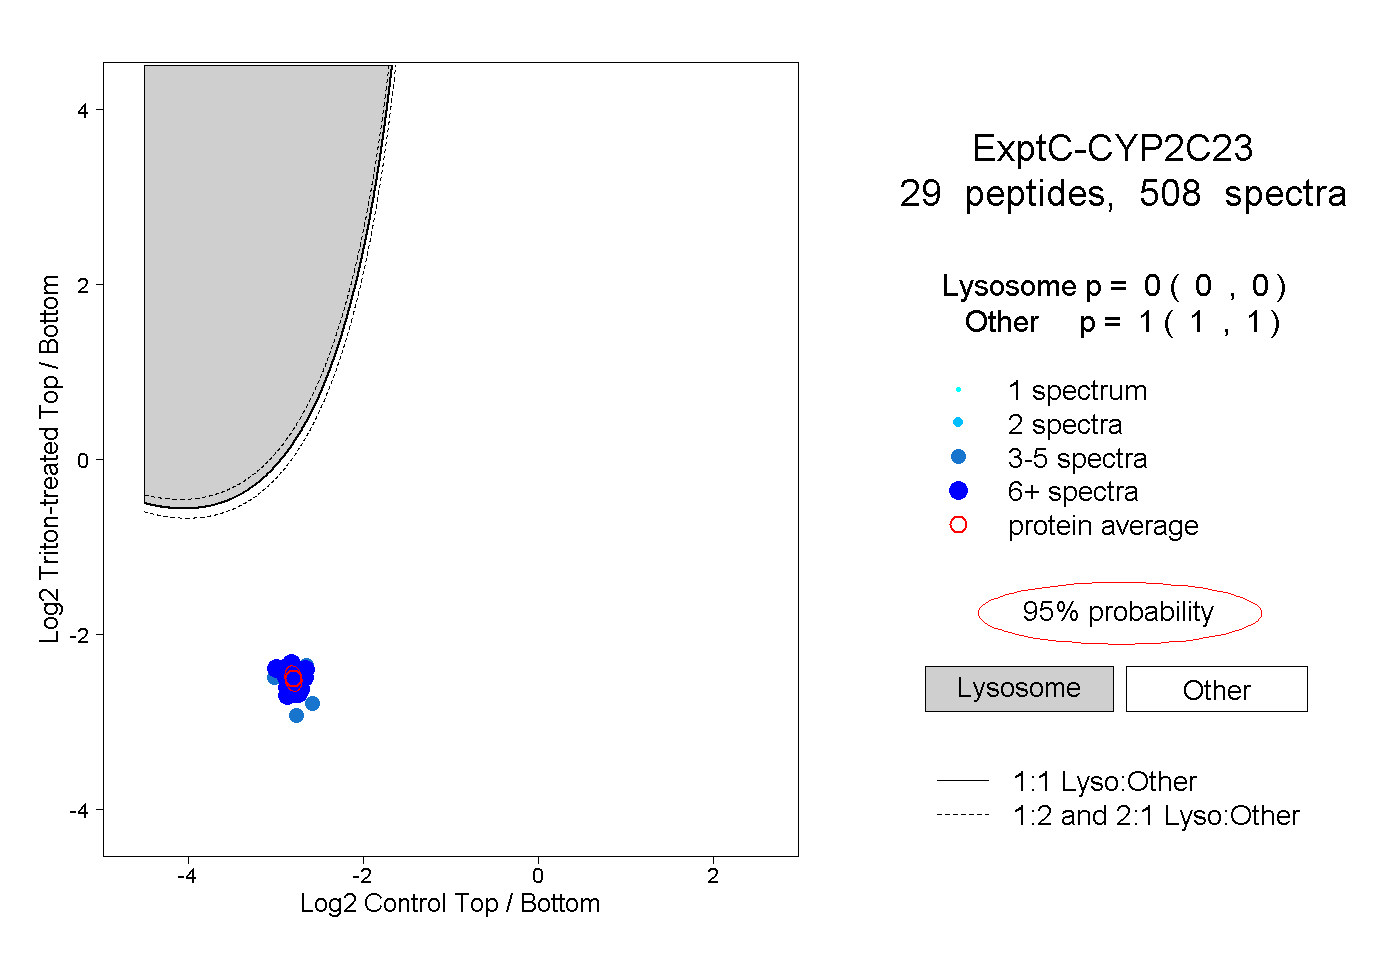 |
0.000 0.000 | 0.000 |
1.000 1.000 | 1.000 |
||||||||
| Plot | Lyso | Other | |||||||||||
| Expt D |
17 peptides |
55 spectra |
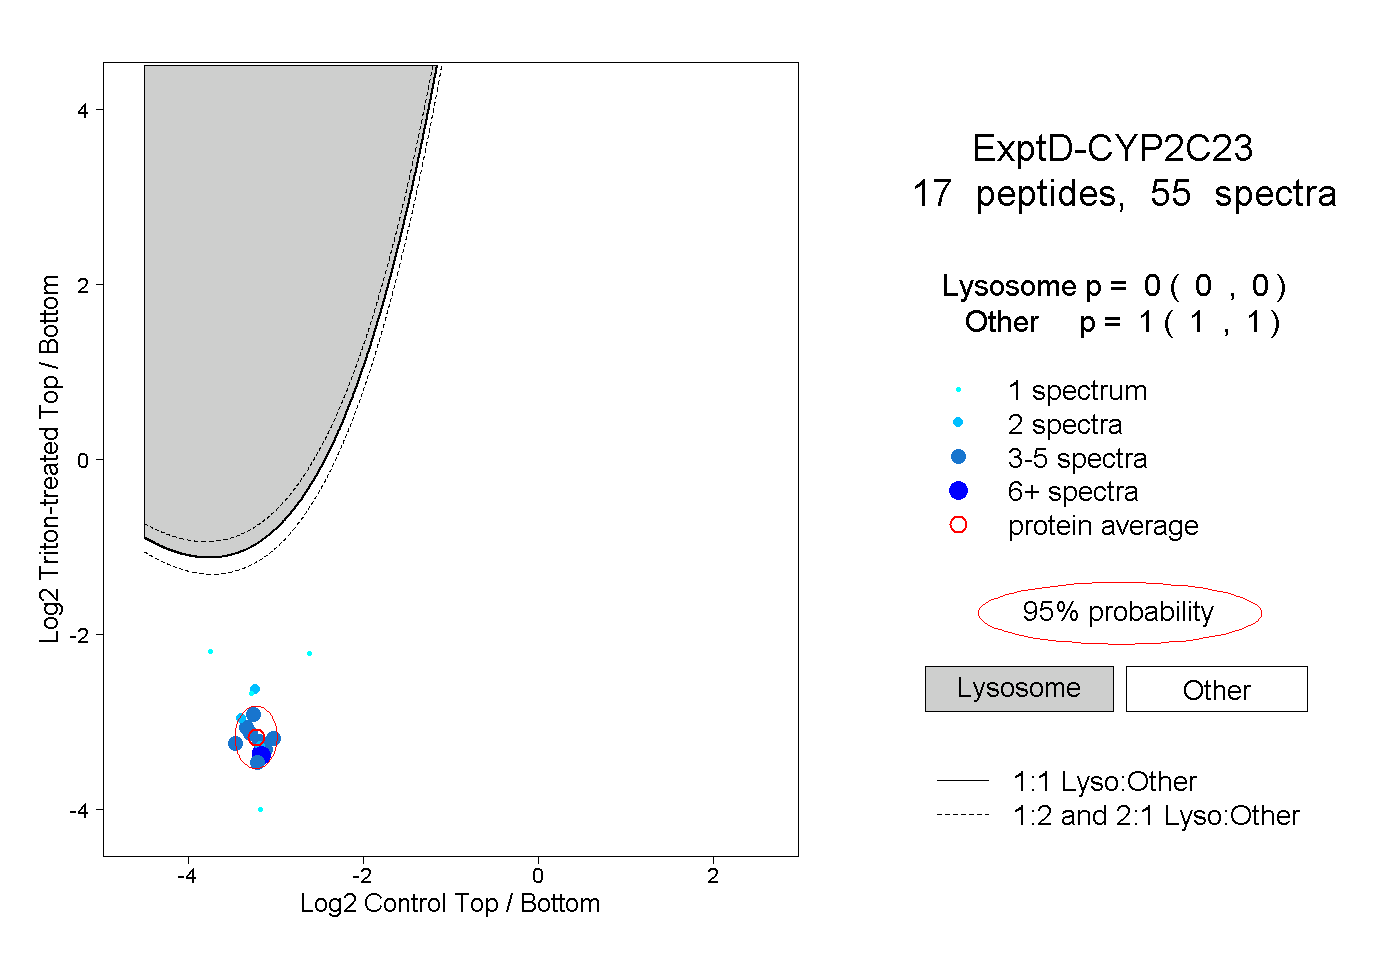 |
0.000 0.000 | 0.000 |
1.000 1.000 | 1.000 |