| 5 spectra, GPLPIIEDTHK |
0.017 |
|
0.024 |
|
0.918 |
0.042 |
0.000 |
0.000 |
0.000 |
|
| 9 spectra, FDPGHFLDK |
0.000 |
|
0.000 |
|
1.000 |
0.000 |
0.000 |
0.000 |
0.000 |
|
| 7 spectra, EALLQQGDEFLGR |
0.000 |
|
0.138 |
|
0.374 |
0.427 |
0.035 |
0.025 |
0.000 |
|
| 3 spectra, GTTVLPMLSSVMLDQK |
0.000 |
|
0.000 |
|
0.776 |
0.018 |
0.000 |
0.206 |
0.000 |
|
| 1 spectrum, HQPPSMK |
0.000 |
|
0.096 |
|
0.398 |
0.087 |
0.405 |
0.014 |
0.000 |
|
| 2 spectra, YPEVQAK |
0.000 |
|
0.000 |
|
0.777 |
0.002 |
0.221 |
0.000 |
0.000 |
|
| 11 spectra, TDYFVPFSLGK |
0.000 |
|
0.020 |
|
0.786 |
0.160 |
0.000 |
0.034 |
0.000 |
|
| 4 spectra, ACVGESLAR |
0.000 |
|
0.000 |
|
0.865 |
0.067 |
0.068 |
0.000 |
0.000 |
|
| 2 spectra, GYGLIFSNGER |
0.000 |
|
0.000 |
|
0.590 |
0.410 |
0.000 |
0.000 |
0.000 |
|
| 2 spectra, YITLLPSSLPHAVVQDTK |
0.000 |
|
0.134 |
|
0.549 |
0.143 |
0.115 |
0.059 |
0.000 |
|
| 8 spectra, VQEEAR |
0.000 |
|
0.000 |
|
0.809 |
0.191 |
0.000 |
0.000 |
0.000 |
|
| 2 spectra, VHEEIDR |
0.000 |
|
0.000 |
|
0.923 |
0.000 |
0.000 |
0.077 |
0.000 |
|
| 10 spectra, HIEFAK |
0.007 |
|
0.050 |
|
0.775 |
0.168 |
0.000 |
0.000 |
0.000 |
|
| 3 spectra, DIPASLSK |
0.000 |
|
0.000 |
|
0.650 |
0.350 |
0.000 |
0.000 |
0.000 |
|
| 2 spectra, NFILEK |
0.000 |
|
0.000 |
|
0.876 |
0.124 |
0.000 |
0.000 |
0.000 |
|
| 4 spectra, FGLLLLMK |
0.000 |
|
0.016 |
|
0.972 |
0.000 |
0.012 |
0.000 |
0.000 |
|
| 1 spectrum, EFANPEK |
0.000 |
|
0.000 |
|
0.869 |
0.131 |
0.000 |
0.000 |
0.000 |
|
| 5 spectra, CLVEELQK |
0.000 |
|
0.000 |
|
0.994 |
0.000 |
0.000 |
0.000 |
0.006 |
|
| 10 spectra, DYIDCFLSK |
0.000 |
|
0.000 |
|
0.842 |
0.045 |
0.101 |
0.000 |
0.012 |
|
| 11 spectra, TFLNLMDLLNK |
0.000 |
|
0.000 |
|
0.992 |
0.008 |
0.000 |
0.000 |
0.000 |
|
| 7 spectra, SLDPANPR |
0.000 |
|
0.000 |
|
0.875 |
0.125 |
0.000 |
0.000 |
0.000 |
|
| 7 spectra, LCLVPR |
0.000 |
|
0.003 |
|
0.853 |
0.000 |
0.144 |
0.000 |
0.000 |
|
| 13 spectra, LPYTDAVLHEIQR |
0.000 |
|
0.000 |
|
0.927 |
0.073 |
0.000 |
0.000 |
0.000 |
|
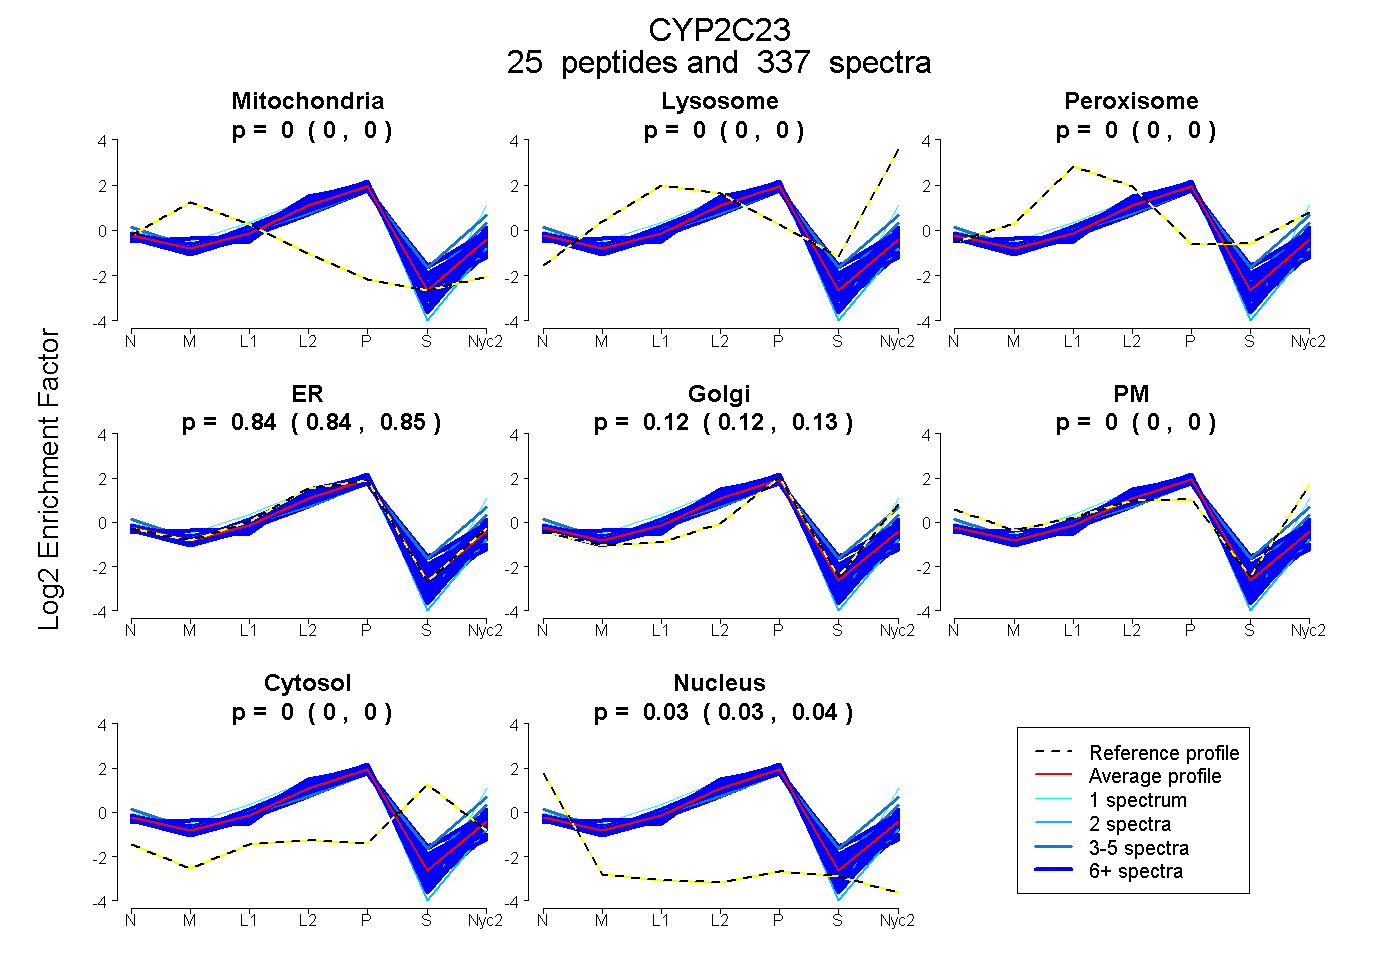
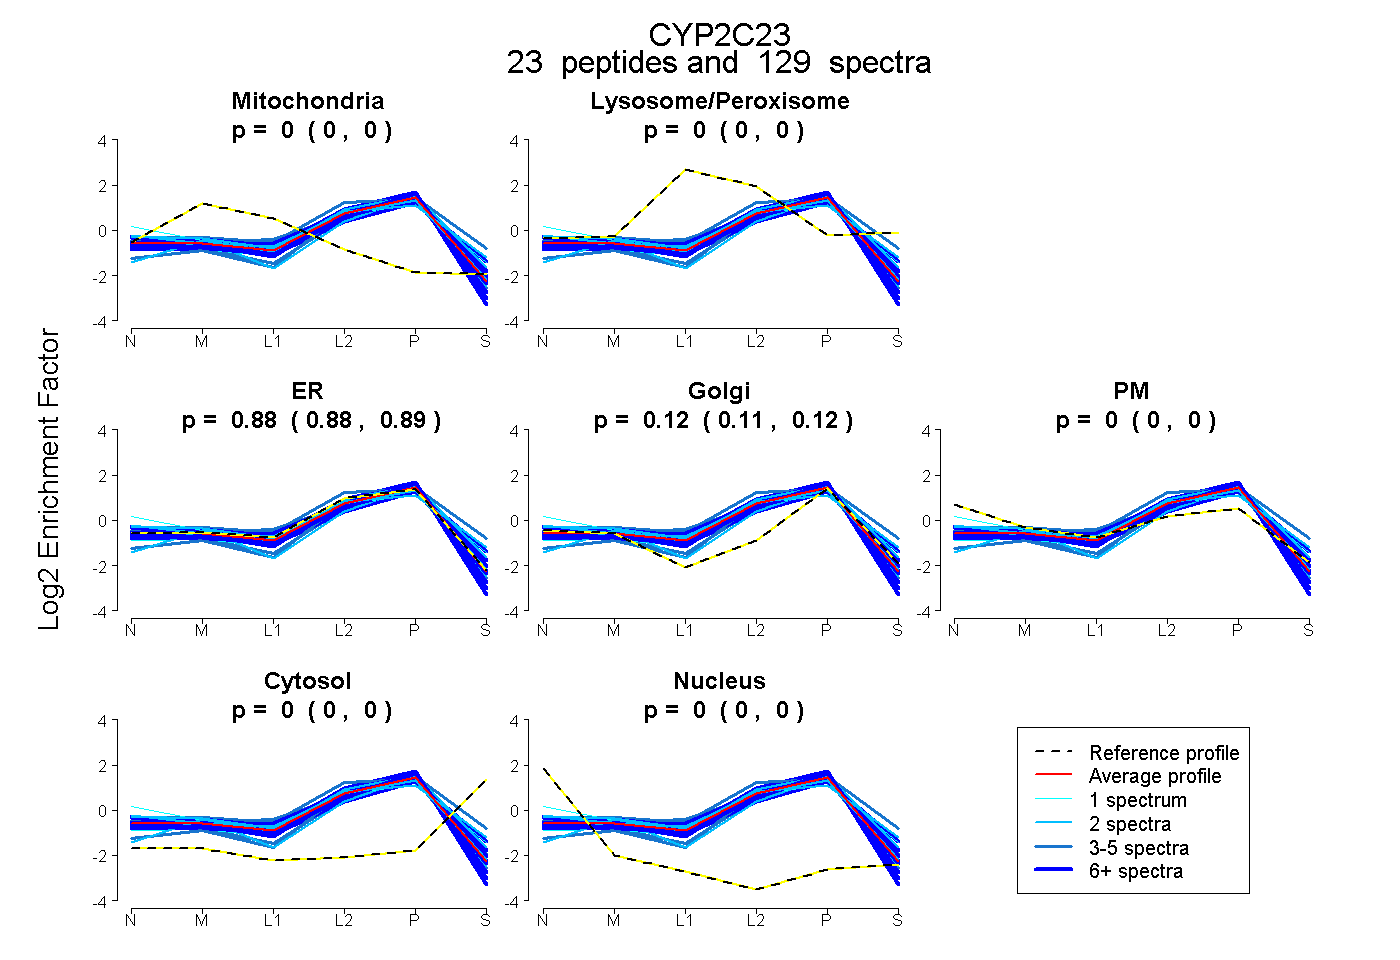
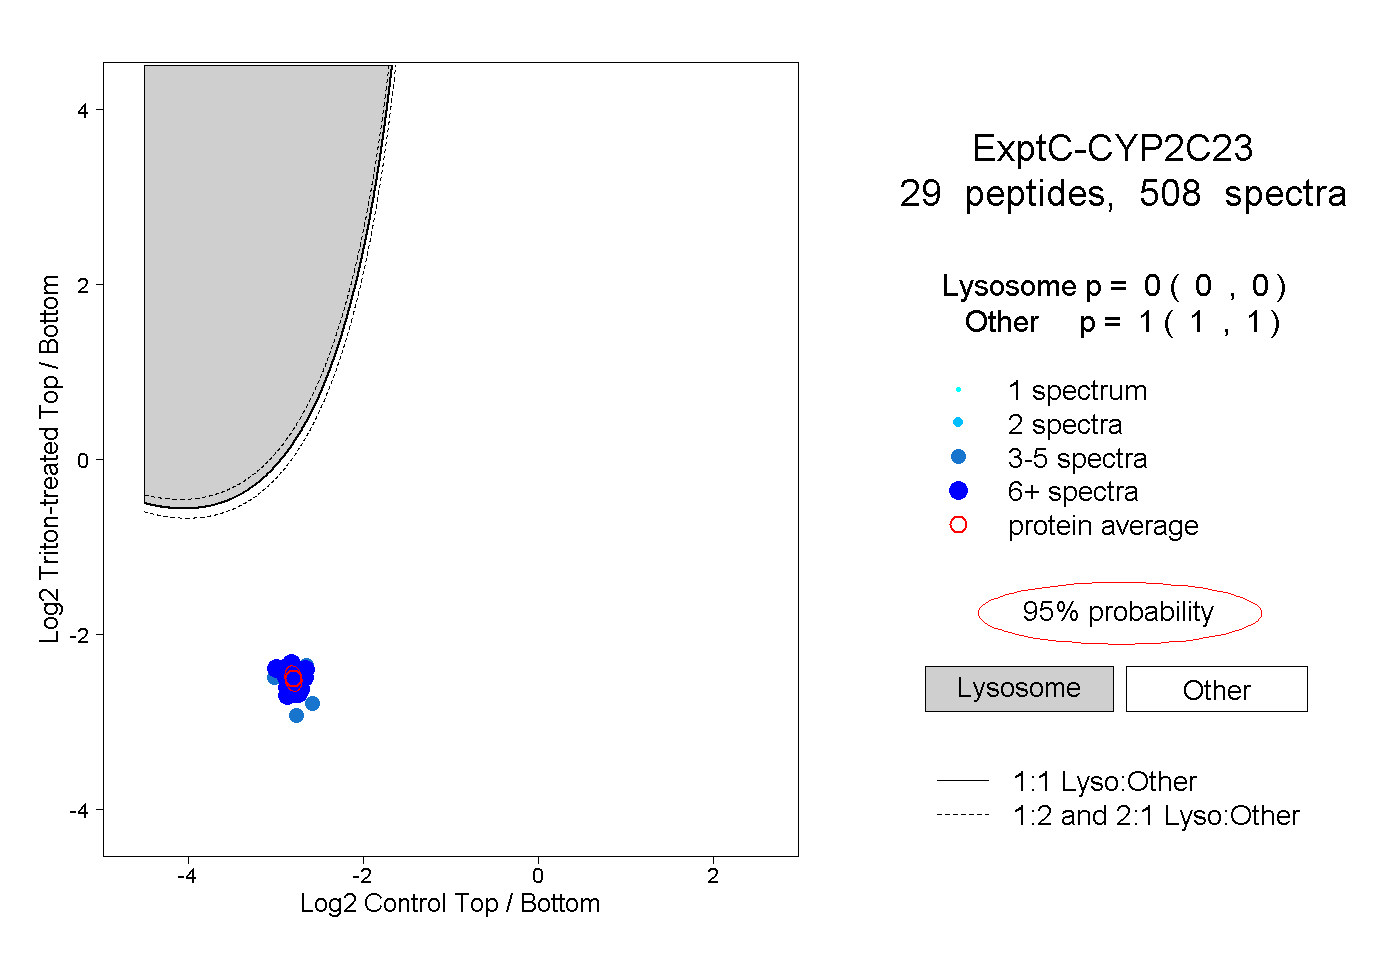
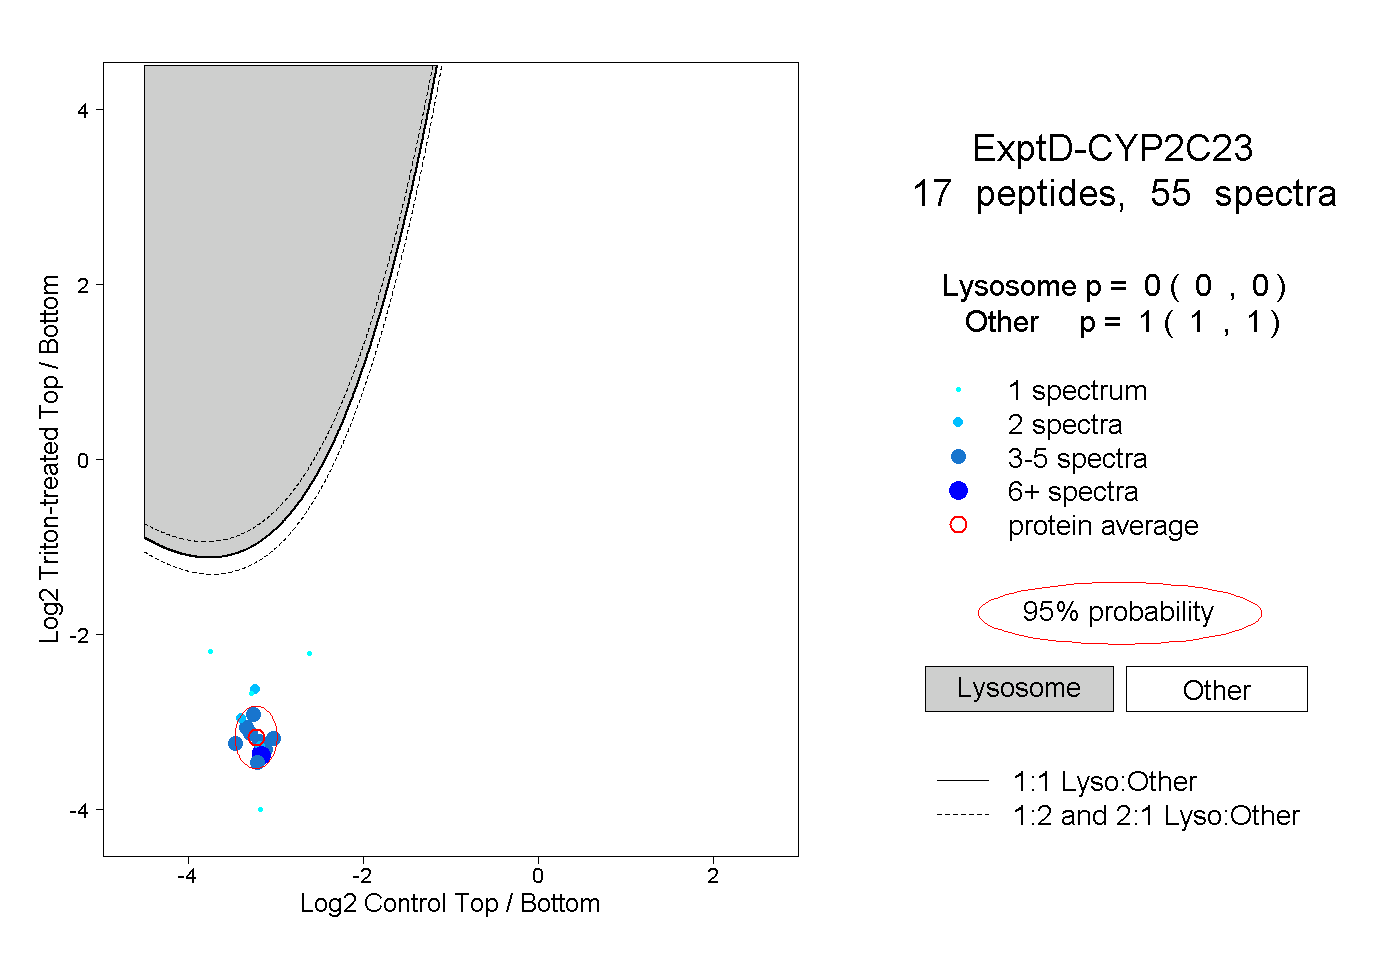
 25
25