 73
73peptides
spectra
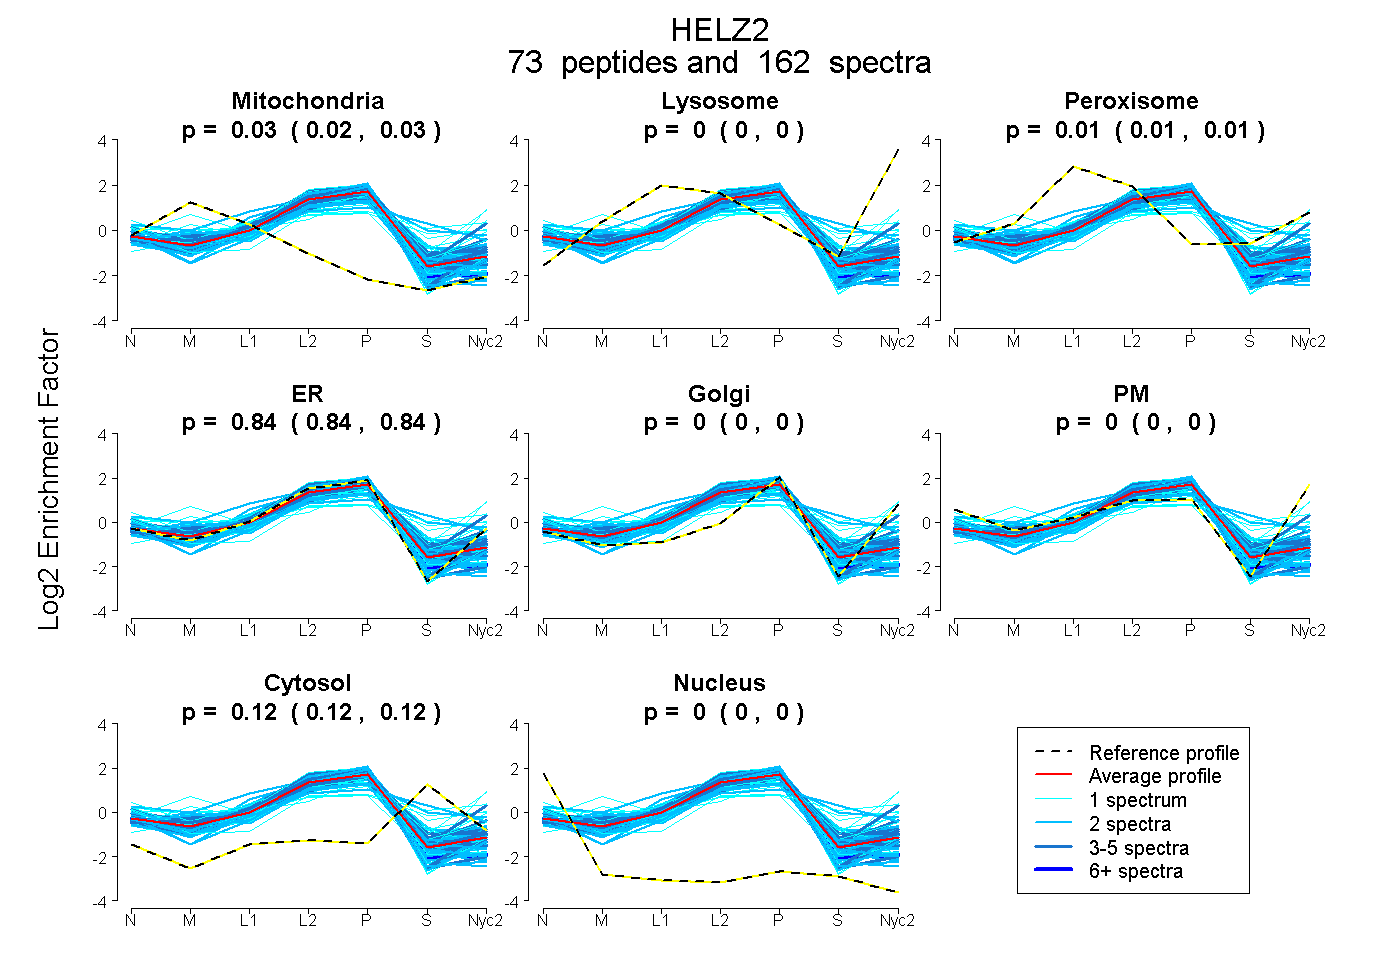
0.024 | 0.028
0.000 | 0.000
0.009 | 0.013
0.838 | 0.841
0.000 | 0.000
0.000 | 0.000
0.122 | 0.124
0.000 | 0.000
21peptides
spectra
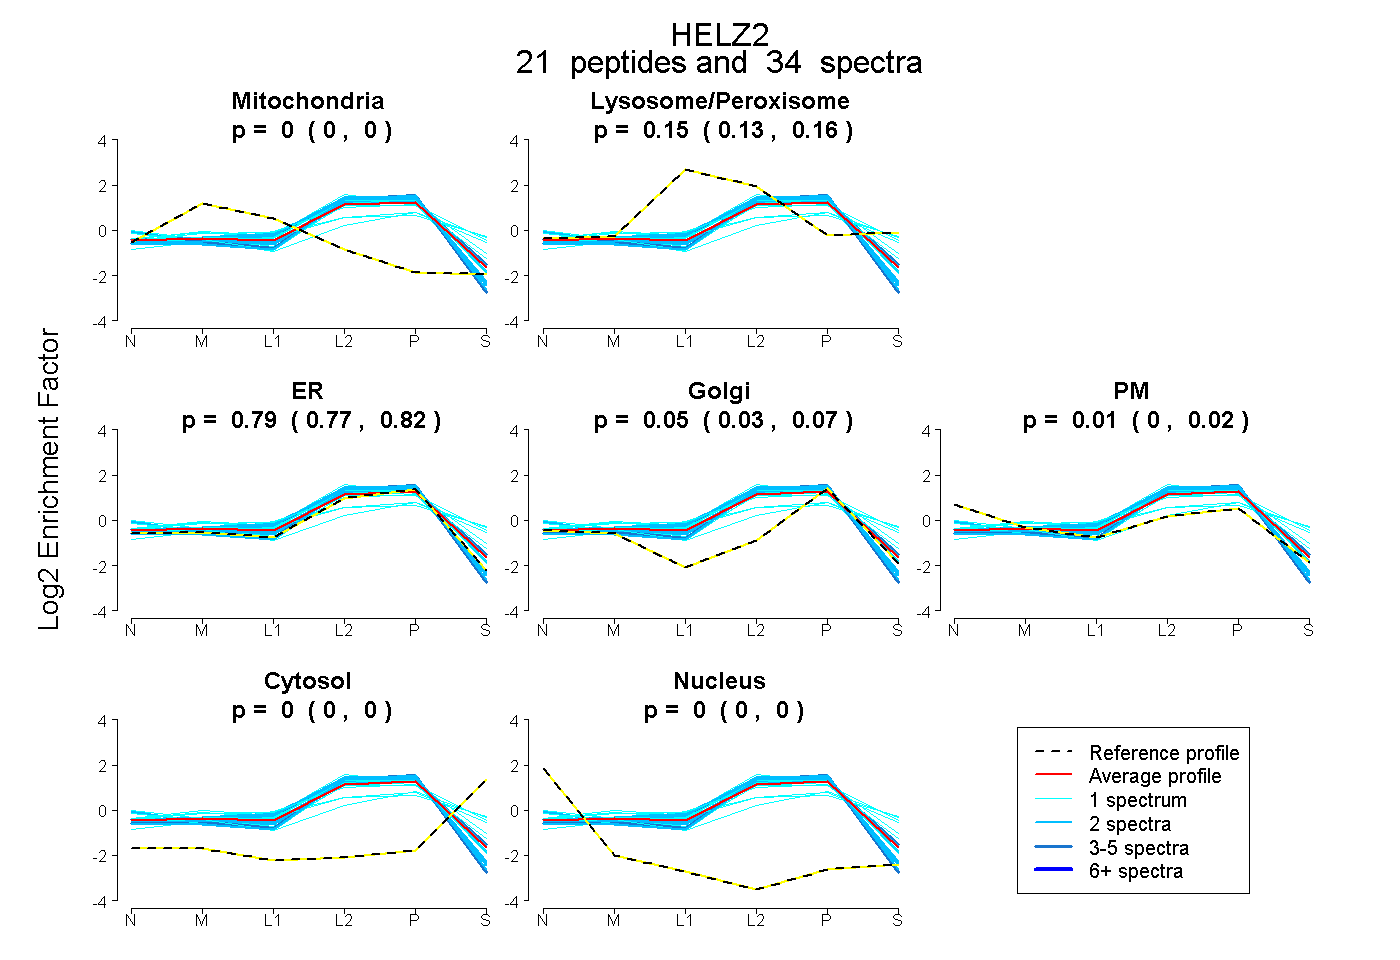
0.000 | 0.000
0.132 | 0.156
0.769 | 0.815
0.026 | 0.067
0.000 | 0.024
0.000 | 0.003
0.000 | 0.000
66peptides
spectra
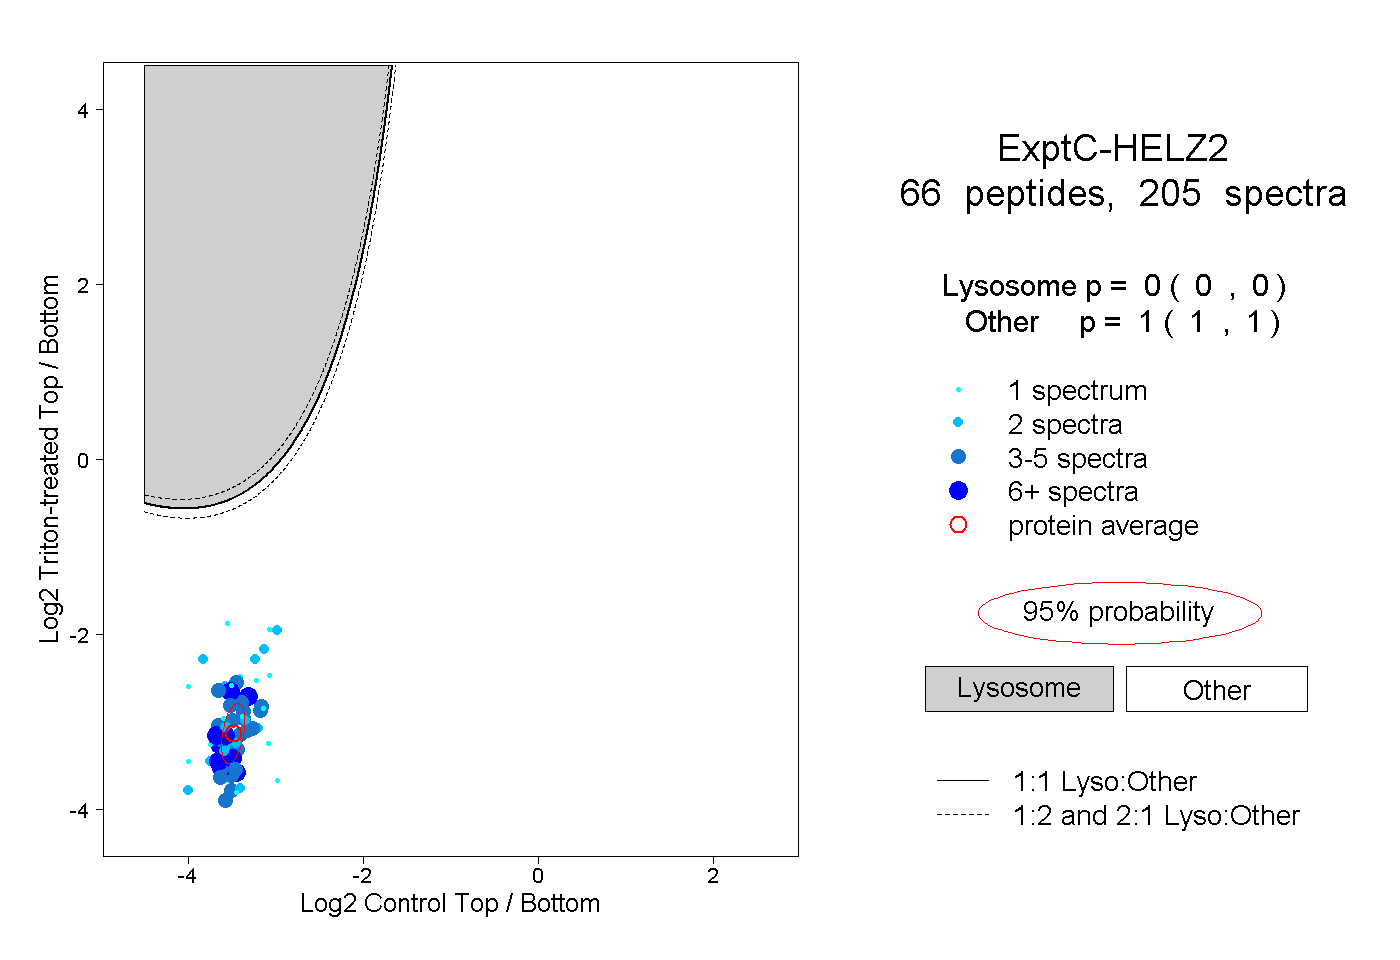
0.000 | 0.000
1.000 | 1.000
13peptides
spectra
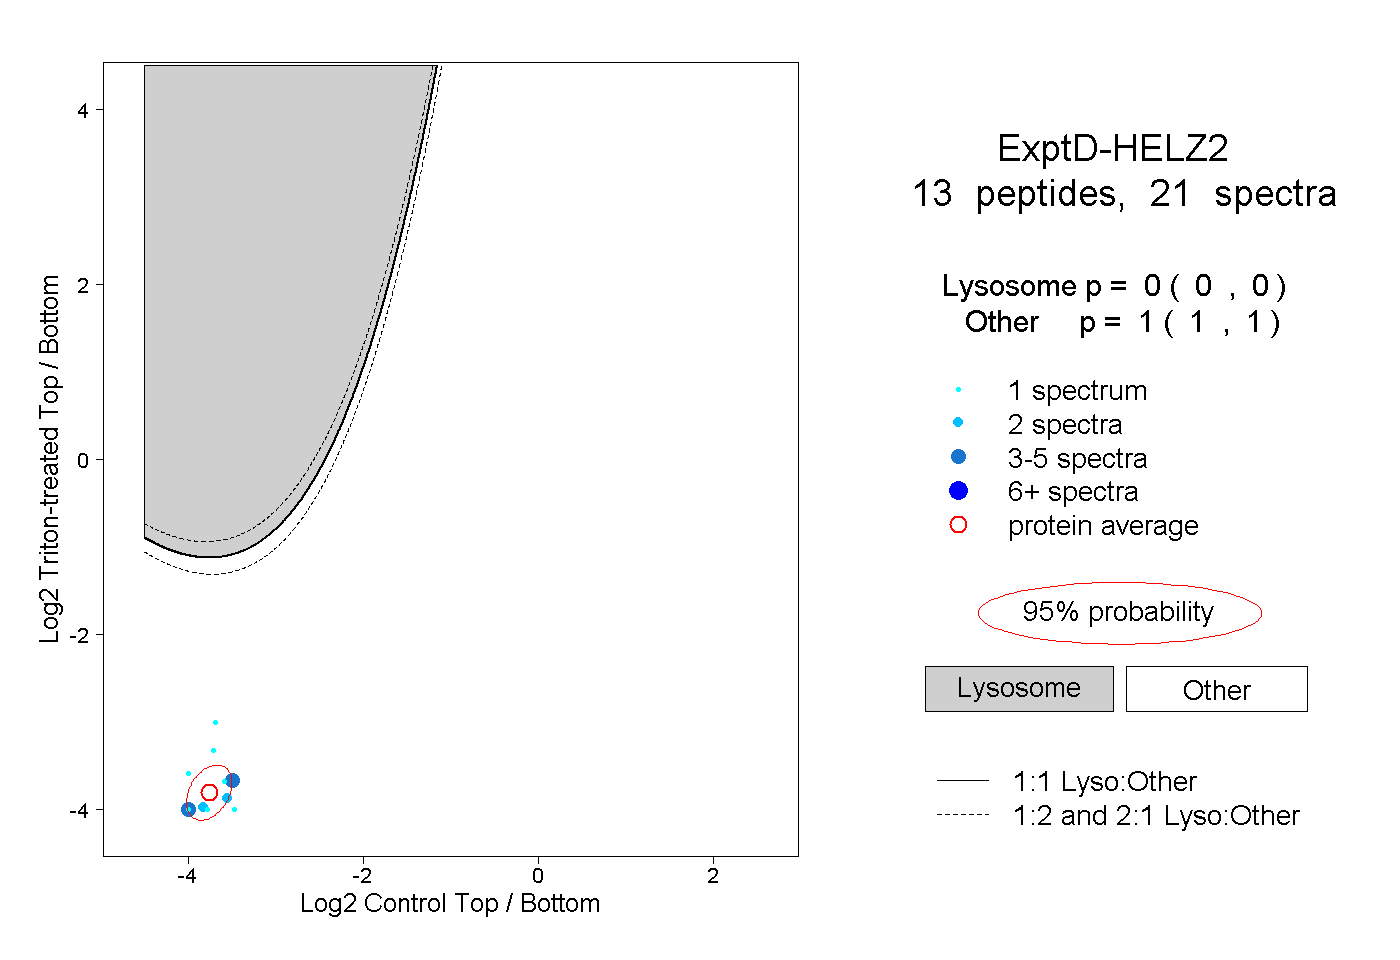
0.000 | 0.000
1.000 | 1.000