 7
7peptides
spectra
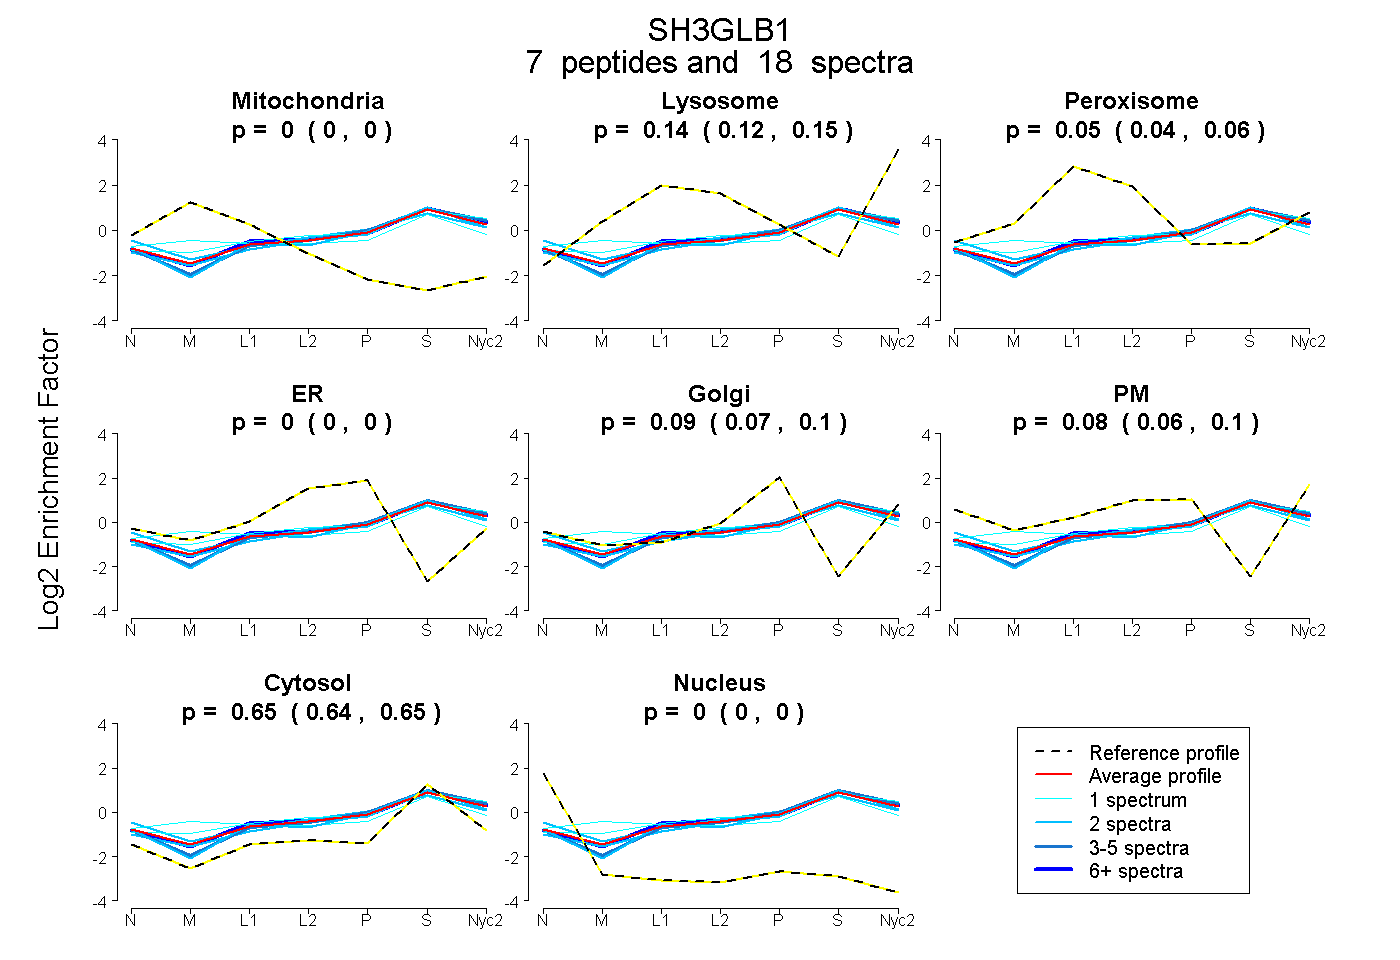
0.000 | 0.000
0.124 | 0.146
0.037 | 0.062
0.000 | 0.000
0.071 | 0.101
0.058 | 0.097
0.637 | 0.651
0.000 | 0.000
3peptides
spectra
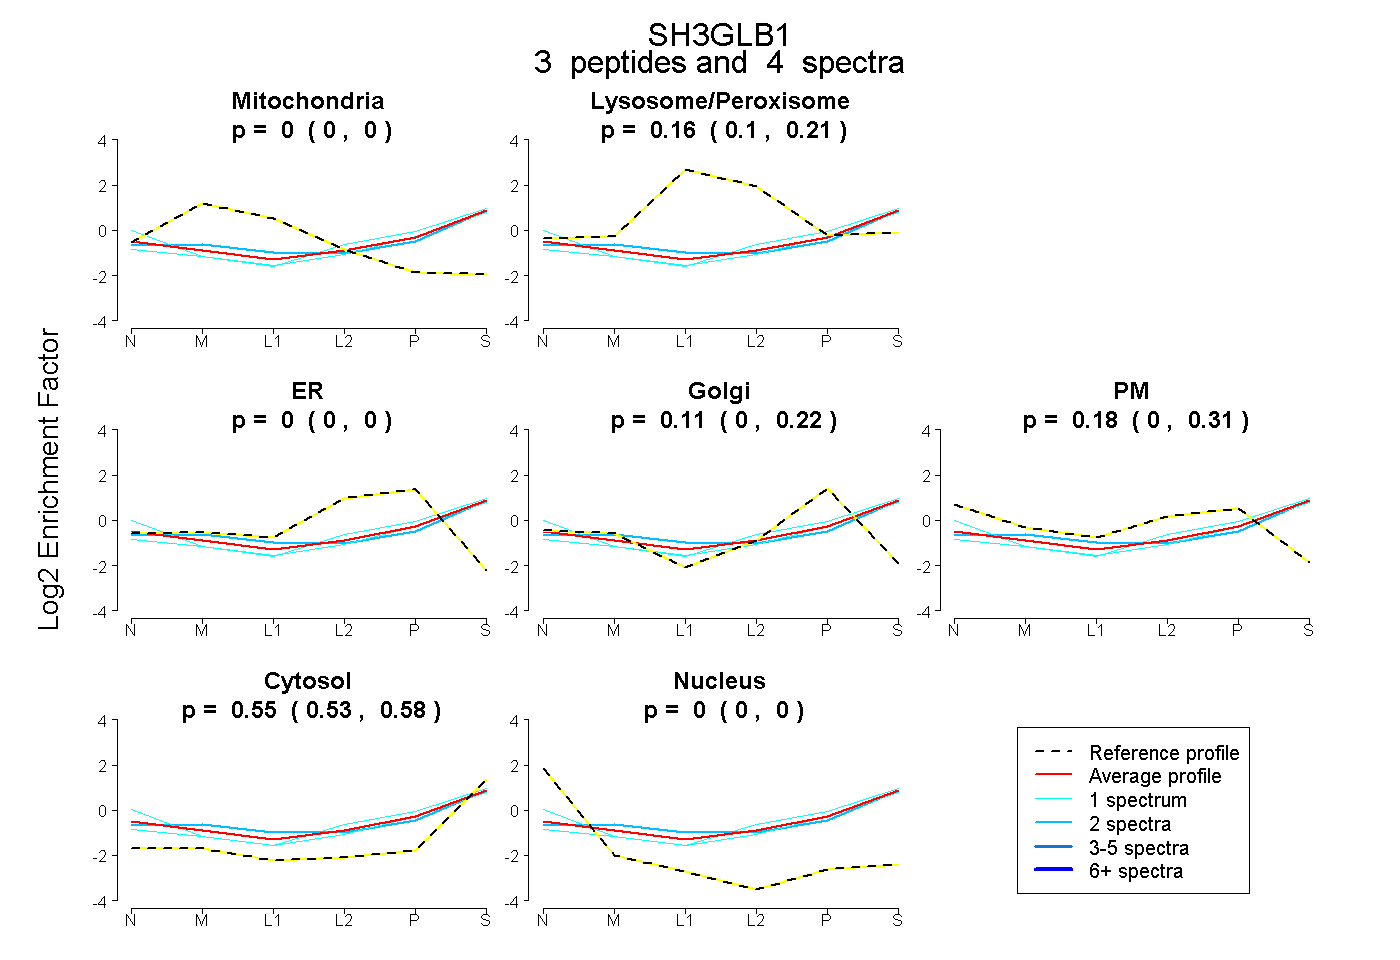
0.000 | 0.000
0.100 | 0.213
0.000 | 0.000
0.000 | 0.218
0.000 | 0.313
0.528 | 0.576
0.000 | 0.000
9peptides
spectra
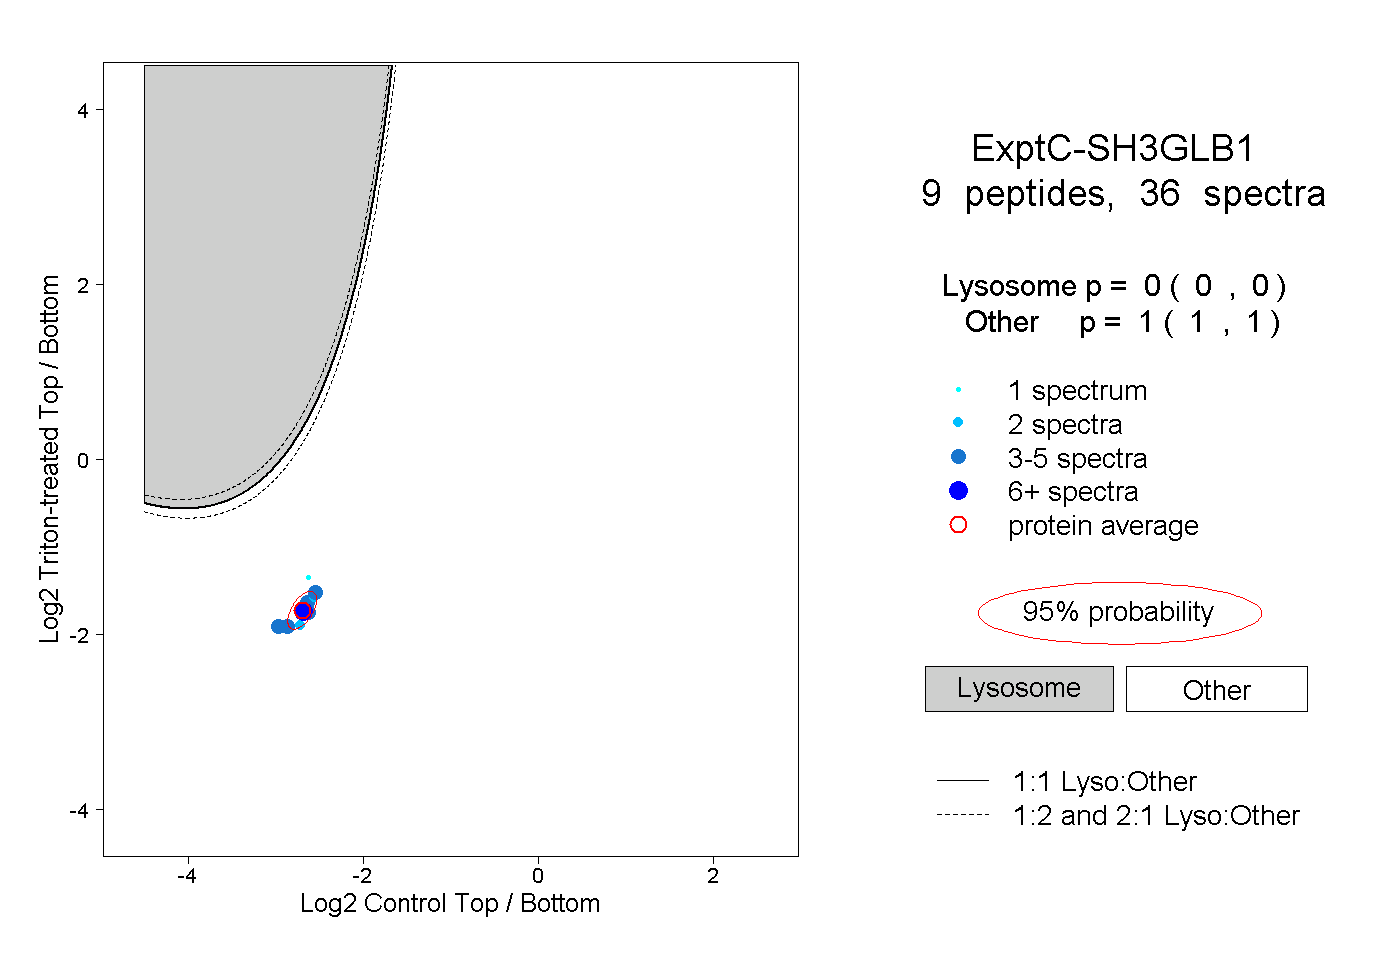
0.000 | 0.000
1.000 | 1.000
1peptide
spectrum
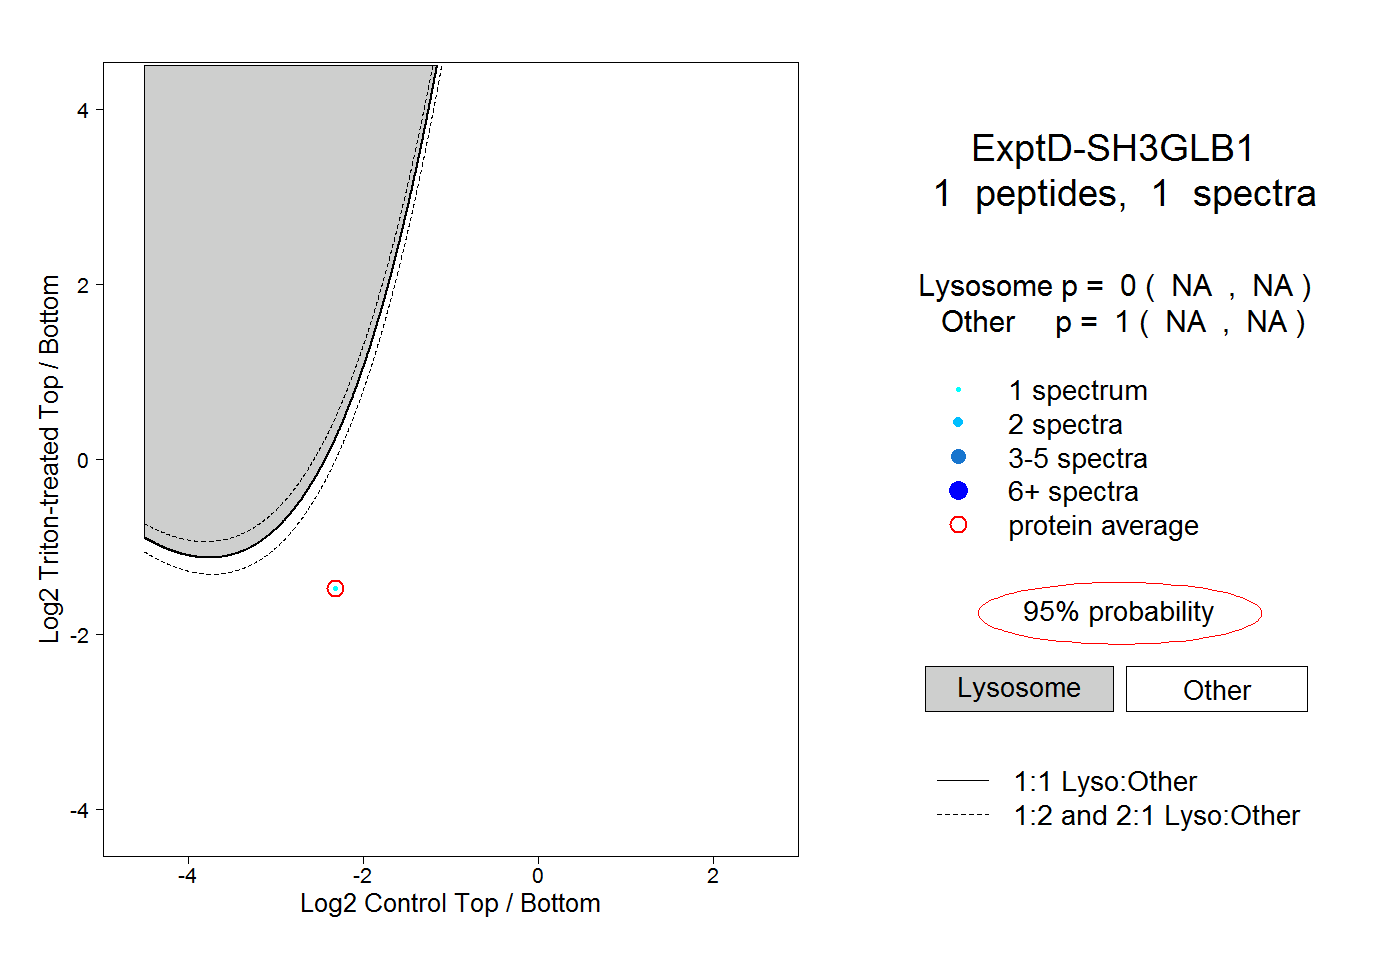
NA | NA
NA | NA