SH3GLB1
[ENSRNOP00000017771]
Main page
| | | Plot |
Mito |
Lyso |
|
Perox |
ER |
Golgi |
PM |
Cytosol |
Nucleus |
|
| Expt A |
 7
7
peptides |
18
spectra |
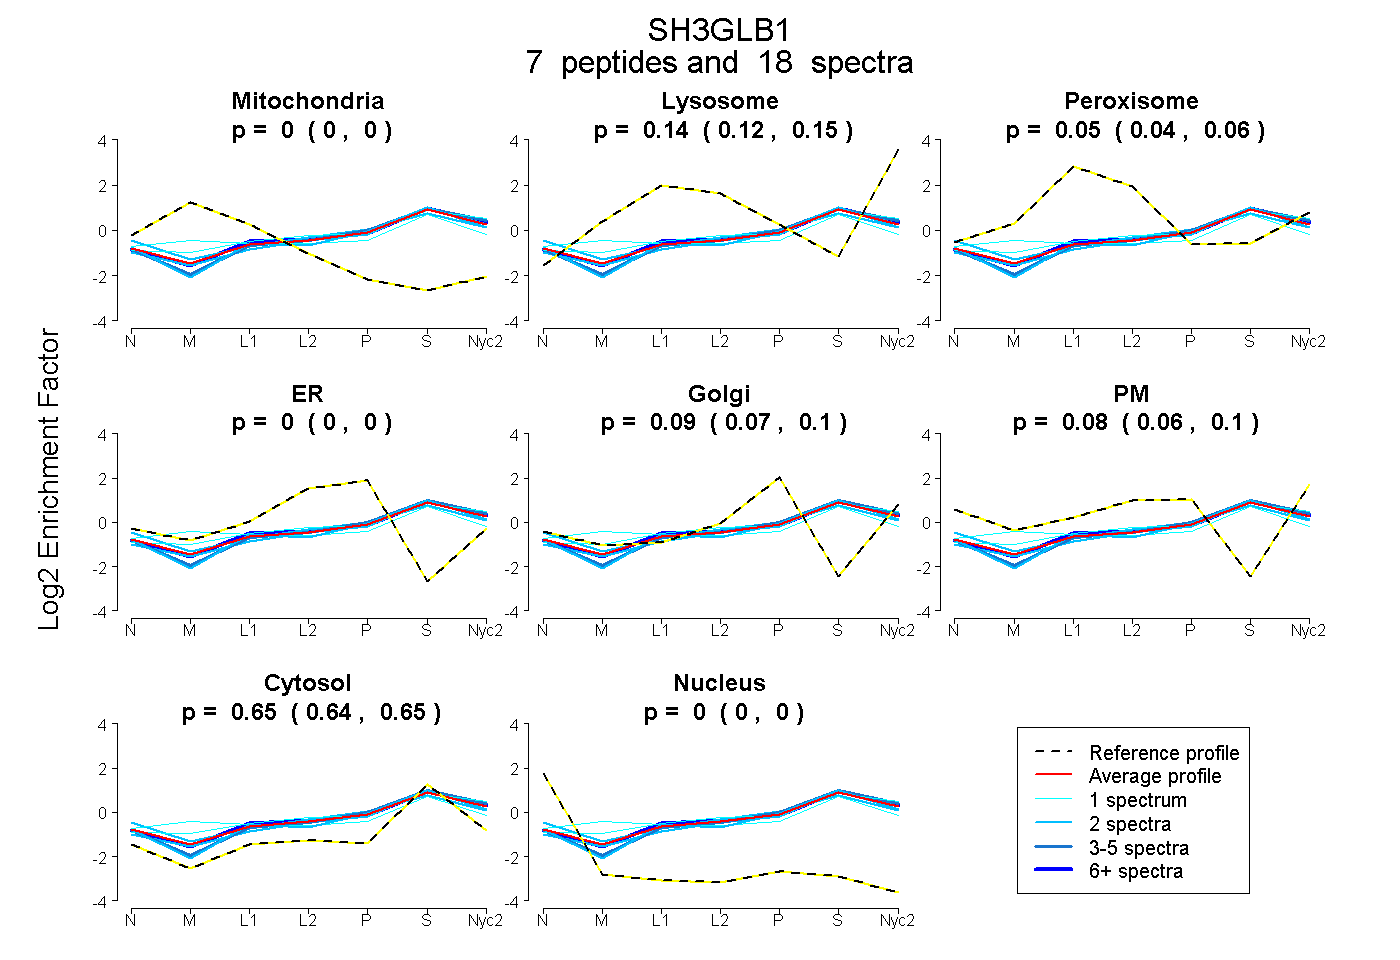 |
0.000
0.000 | 0.000 |
0.136
0.124 | 0.146 |
|
0.051
0.037 | 0.062 |
0.000
0.000 | 0.000 |
0.088
0.071 | 0.101 |
0.079
0.058 | 0.097 |
0.645
0.637 | 0.651 |
0.000
0.000 | 0.000 |
|
| | | Plot |
Mito |
|
Lyso or Perox |
|
ER |
Golgi |
PM |
Cytosol |
Nucleus |
|
| Expt B |
3
peptides |
4
spectra |
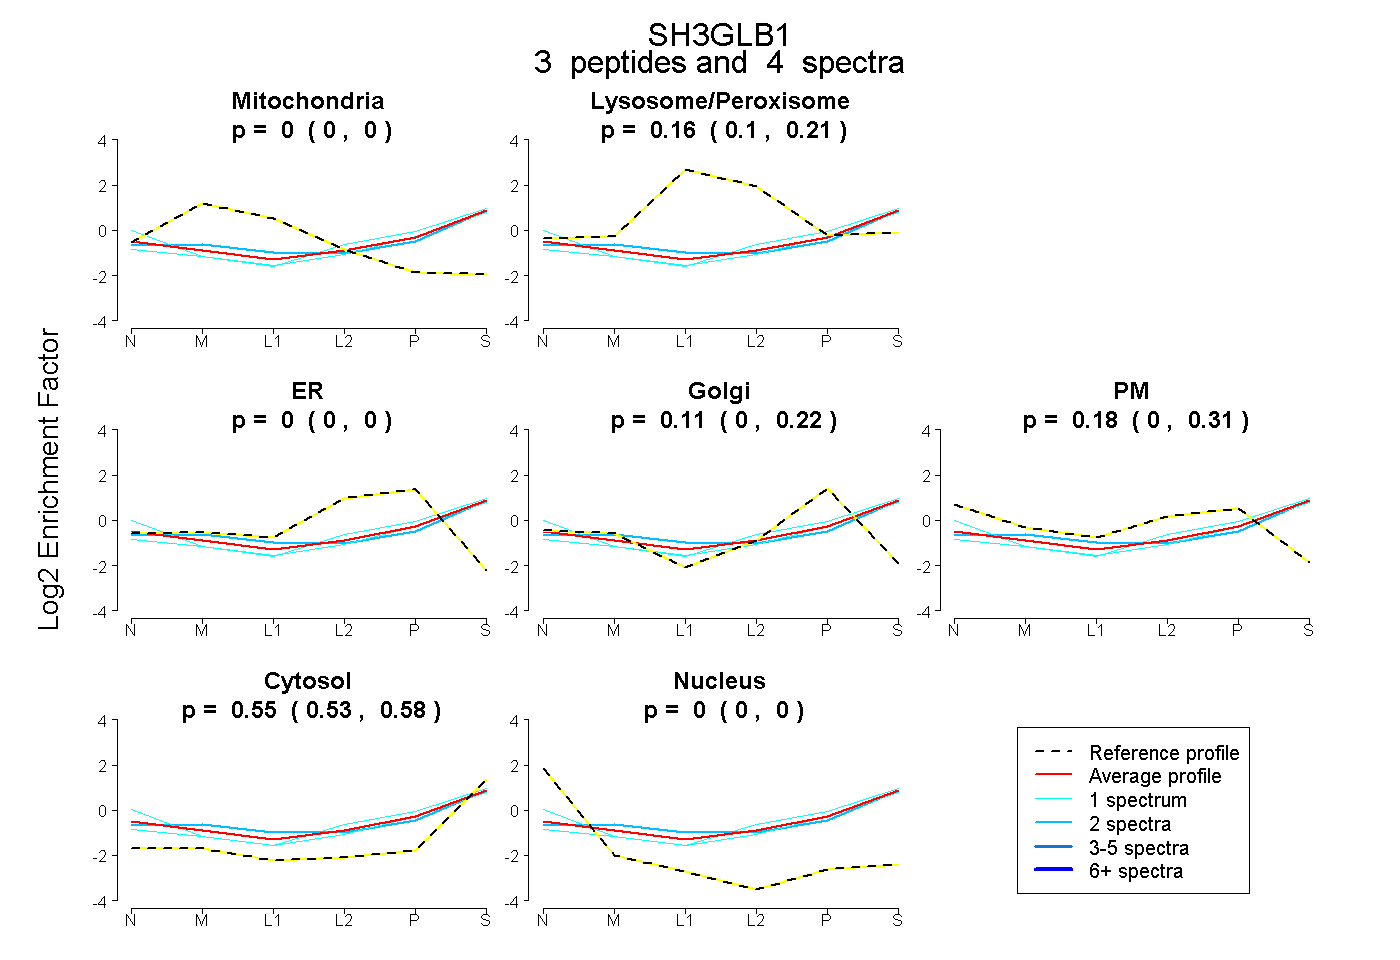 |
0.000
0.000 | 0.000 |
|
0.161
0.100 | 0.213 |
|
0.000
0.000 | 0.000 |
0.109
0.000 | 0.218 |
0.178
0.000 | 0.313 |
0.552
0.528 | 0.576 |
0.000
0.000 | 0.000 |
|
| 1 spectrum, LAADAGTFLSR |
0.000 |
|
0.030 |
|
0.000 |
0.000 |
0.410 |
0.560 |
0.000 |
|
| 1 spectrum, IEEFVYEK |
0.000 |
|
0.189 |
|
0.000 |
0.268 |
0.000 |
0.543 |
0.000 |
|
| 2 spectra, ITQSEFDR |
0.000 |
|
0.218 |
|
0.000 |
0.108 |
0.114 |
0.560 |
0.000 |
|
| | | Plot |
|
Lyso |
|
|
|
|
|
|
|
Other |
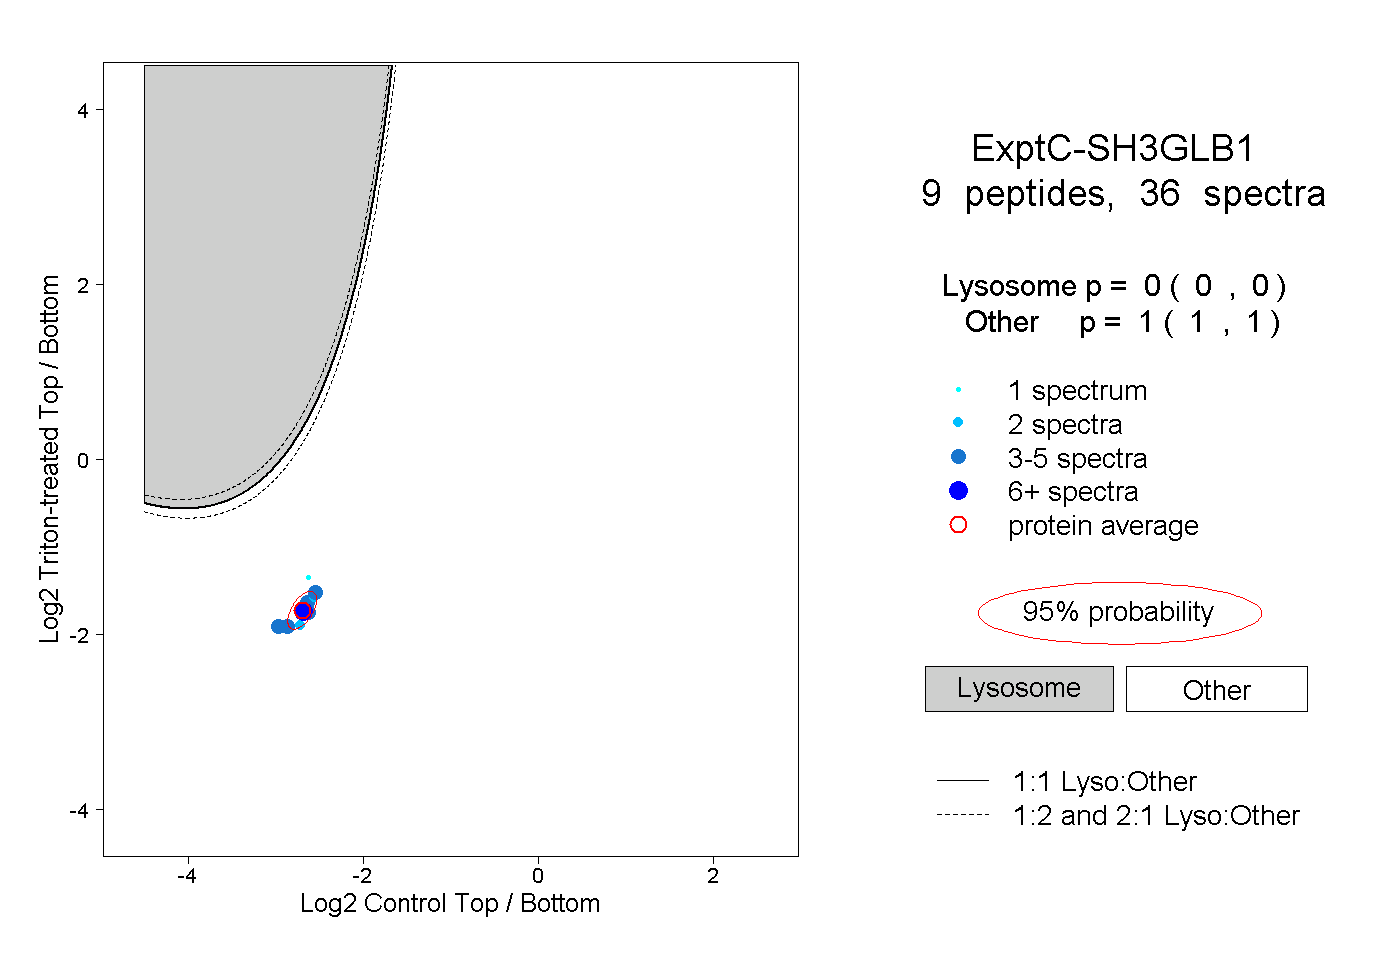
| Expt C |
9
peptides |
36
spectra |
 |
|
0.000
0.000 | 0.000 |
|
|
|
|
|
|
|
1.000
1.000 | 1.000 |
| | | Plot |
|
Lyso |
|
|
|
|
|
|
|
Other |
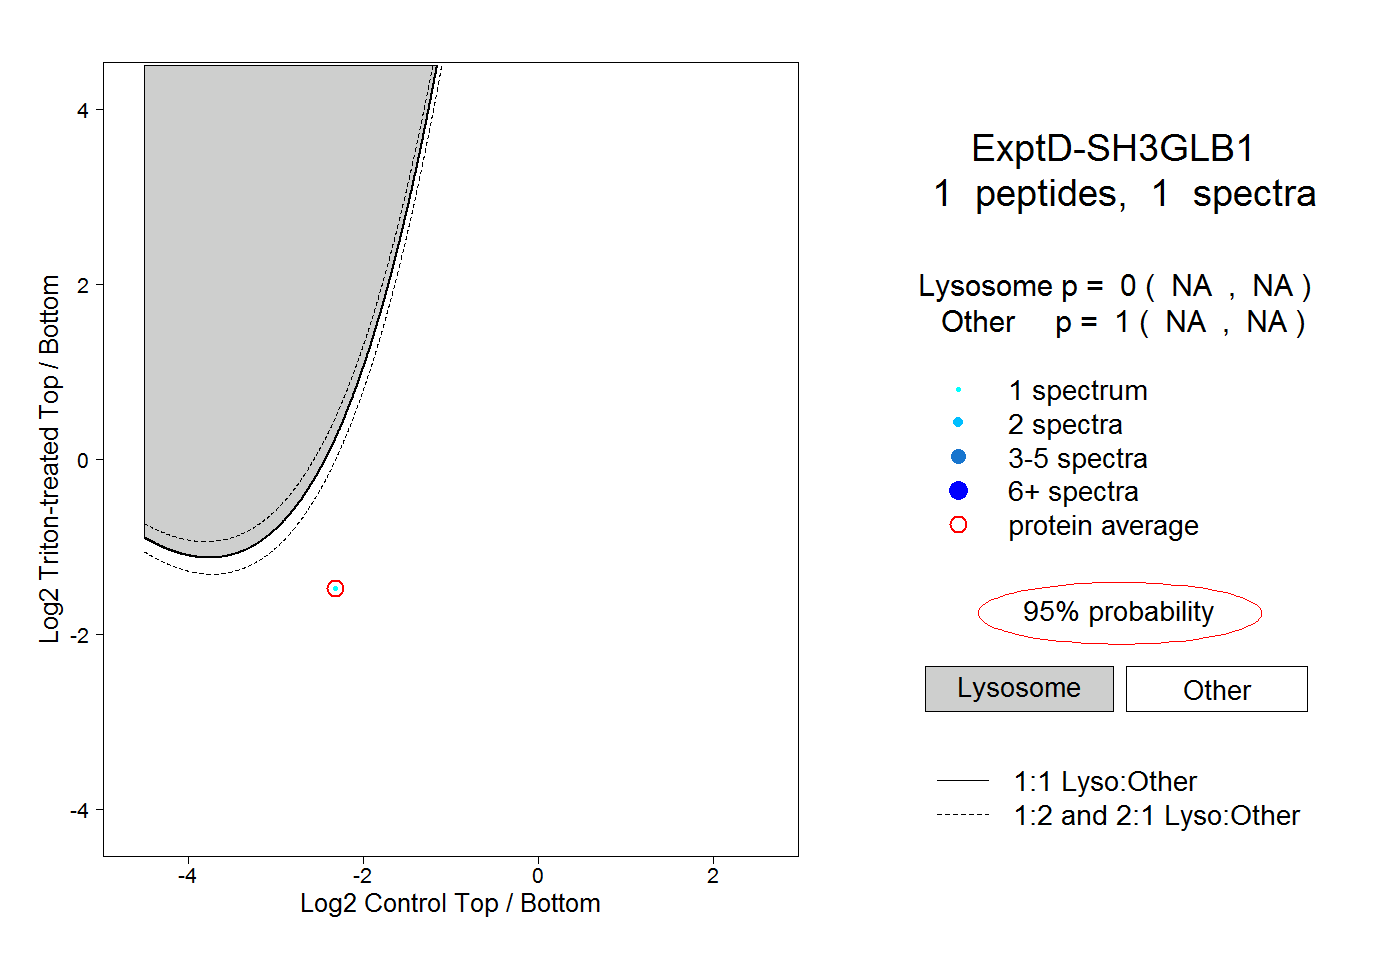
| Expt D |
1
peptide |
1
spectrum |
 |
|
0.000
NA | NA |
|
|
|
|
|
|
|
1.000
NA | NA |