 7
7peptides
spectra
0.000 | 0.000
0.124 | 0.146
0.037 | 0.062
0.000 | 0.000
0.071 | 0.101
0.058 | 0.097
0.637 | 0.651
0.000 | 0.000
| Plot | Mito | Lyso | Perox | ER | Golgi | PM | Cytosol | Nucleus | |||||
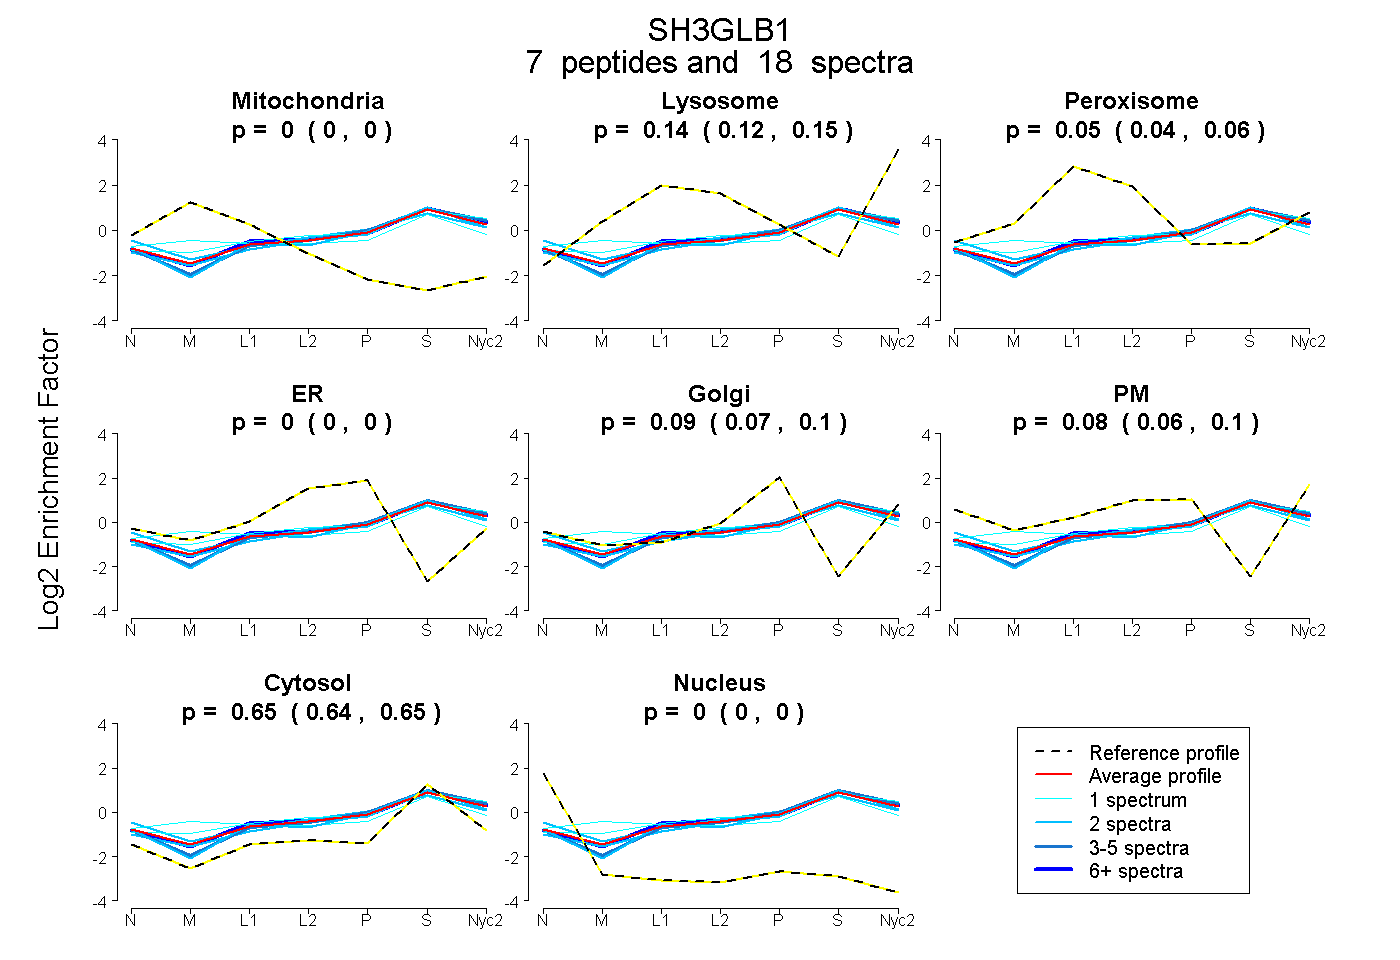
| Expt A |
7 peptides |
18 spectra |
|
0.000 0.000 | 0.000 |
0.136 0.124 | 0.146 |
0.051 0.037 | 0.062 |
0.000 0.000 | 0.000 |
0.088 0.071 | 0.101 |
0.079 0.058 | 0.097 |
0.645 0.637 | 0.651 |
0.000 0.000 | 0.000 |
| 2 spectra, SSSEQELR | 0.000 | 0.098 | 0.044 | 0.000 | 0.127 | 0.037 | 0.694 | 0.000 | ||
| 2 spectra, IEEFVYEK | 0.000 | 0.009 | 0.103 | 0.000 | 0.071 | 0.214 | 0.602 | 0.000 | ||
| 2 spectra, ITQSEFDR | 0.000 | 0.183 | 0.000 | 0.000 | 0.108 | 0.022 | 0.686 | 0.000 | ||
| 6 spectra, AVQFTEEK | 0.000 | 0.157 | 0.065 | 0.000 | 0.086 | 0.047 | 0.644 | 0.000 | ||
| 1 spectrum, NFIEGDYK | 0.104 | 0.084 | 0.148 | 0.000 | 0.103 | 0.006 | 0.556 | 0.000 | ||
| 4 spectra, LAADAGTFLSR | 0.000 | 0.168 | 0.000 | 0.000 | 0.104 | 0.054 | 0.673 | 0.000 | ||
| 1 spectrum, QAEITR | 0.000 | 0.219 | 0.060 | 0.000 | 0.067 | 0.058 | 0.597 | 0.000 |
| Plot | Mito | Lyso or Perox | ER | Golgi | PM | Cytosol | Nucleus | ||||||
| Expt B |
3 peptides |
4 spectra |
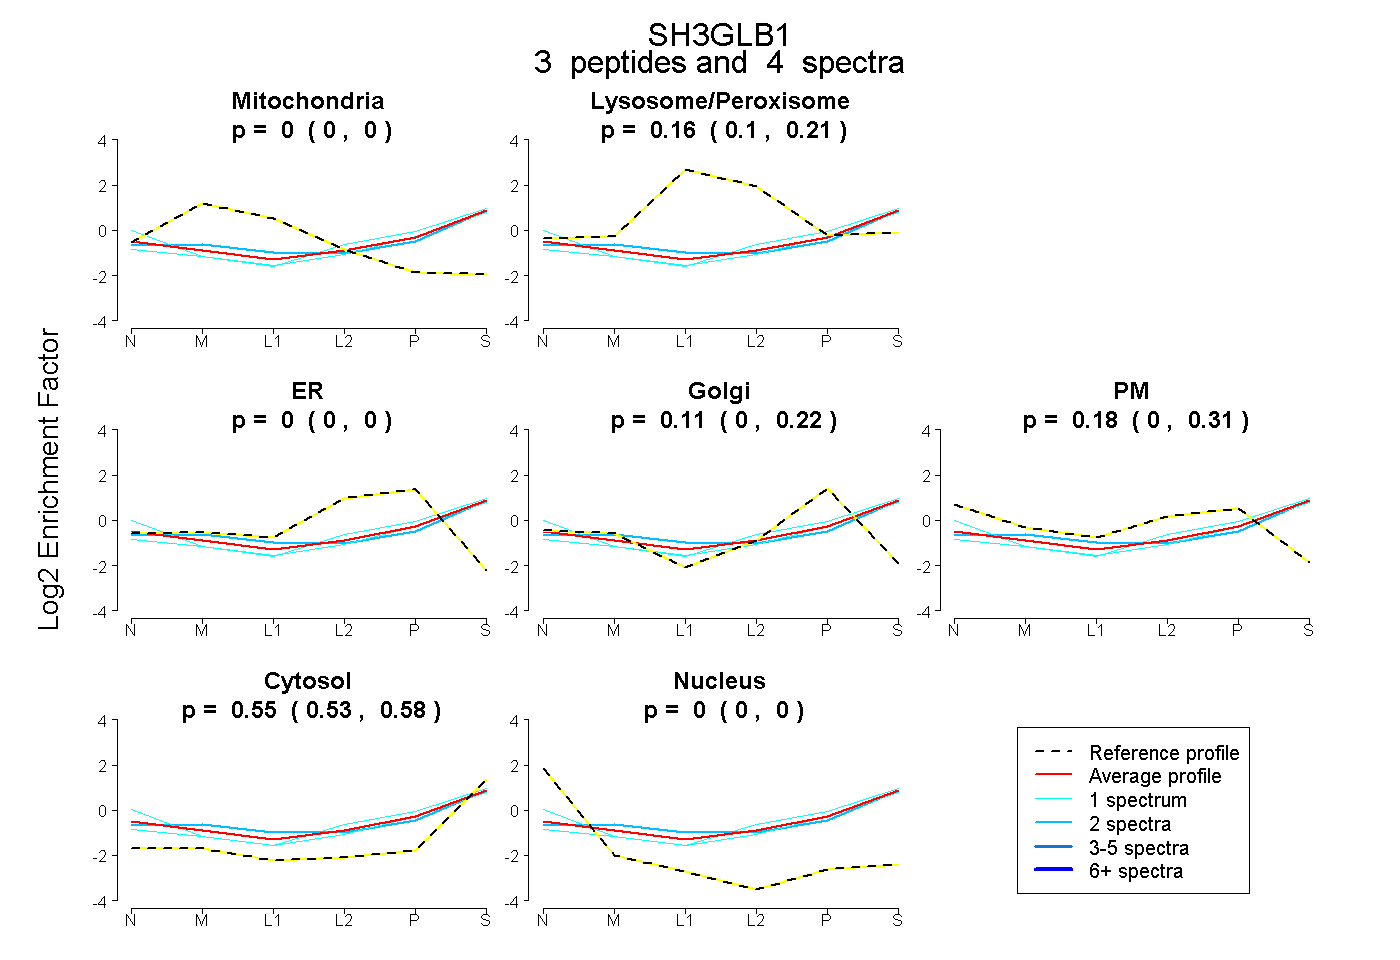 |
0.000 0.000 | 0.000 |
0.161 0.100 | 0.213 |
0.000 0.000 | 0.000 |
0.109 0.000 | 0.218 |
0.178 0.000 | 0.313 |
0.552 0.528 | 0.576 |
0.000 0.000 | 0.000 |
|||
| Plot | Lyso | Other | |||||||||||
| Expt C |
9 peptides |
36 spectra |
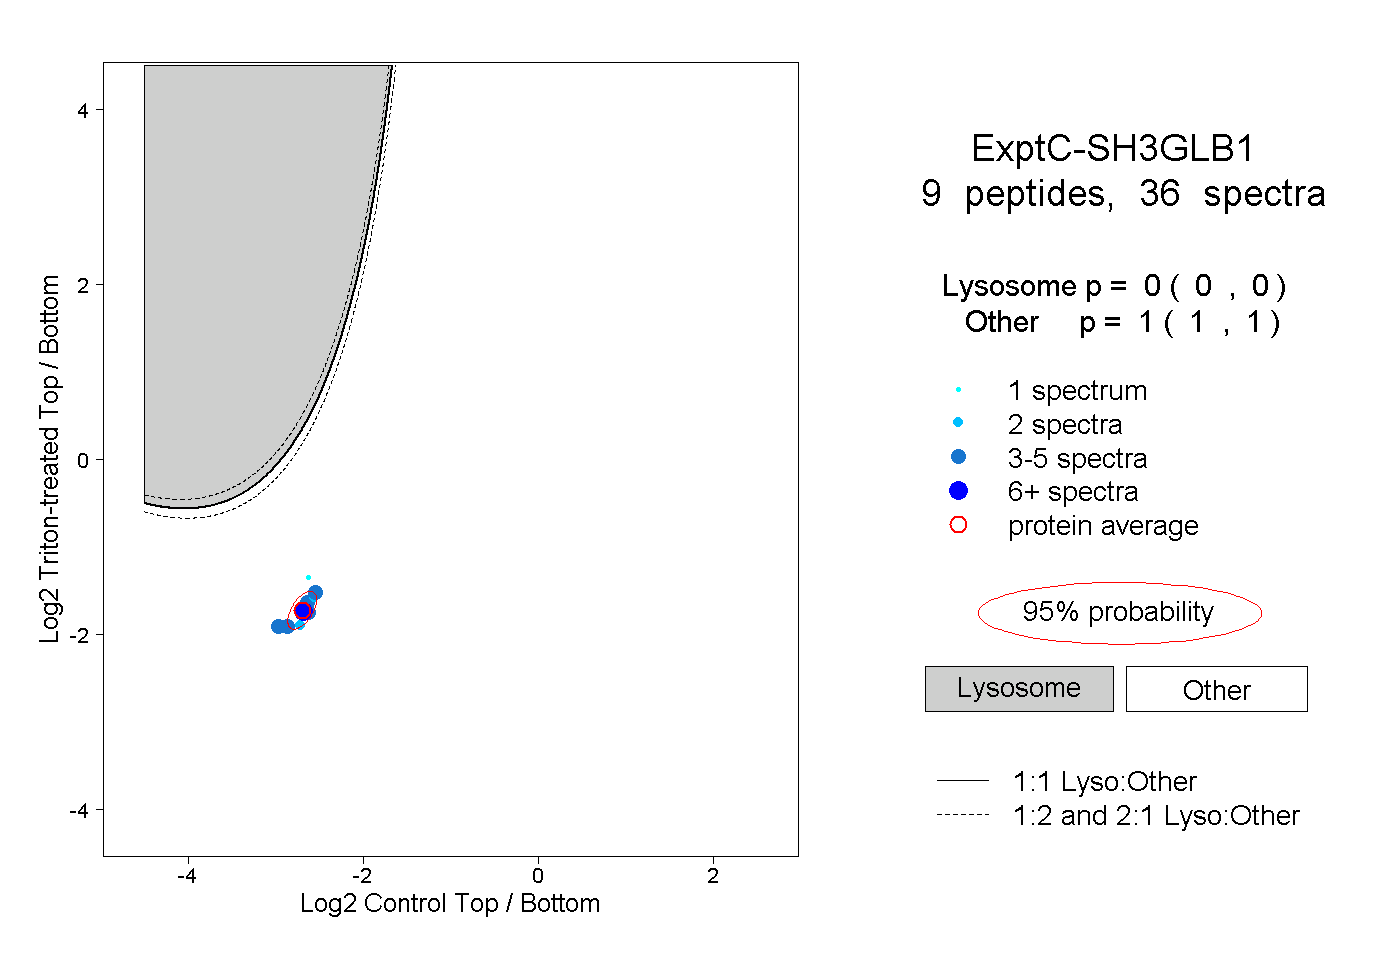 |
0.000 0.000 | 0.000 |
1.000 1.000 | 1.000 |
||||||||
| Plot | Lyso | Other | |||||||||||
| Expt D |
1 peptide |
1 spectrum |
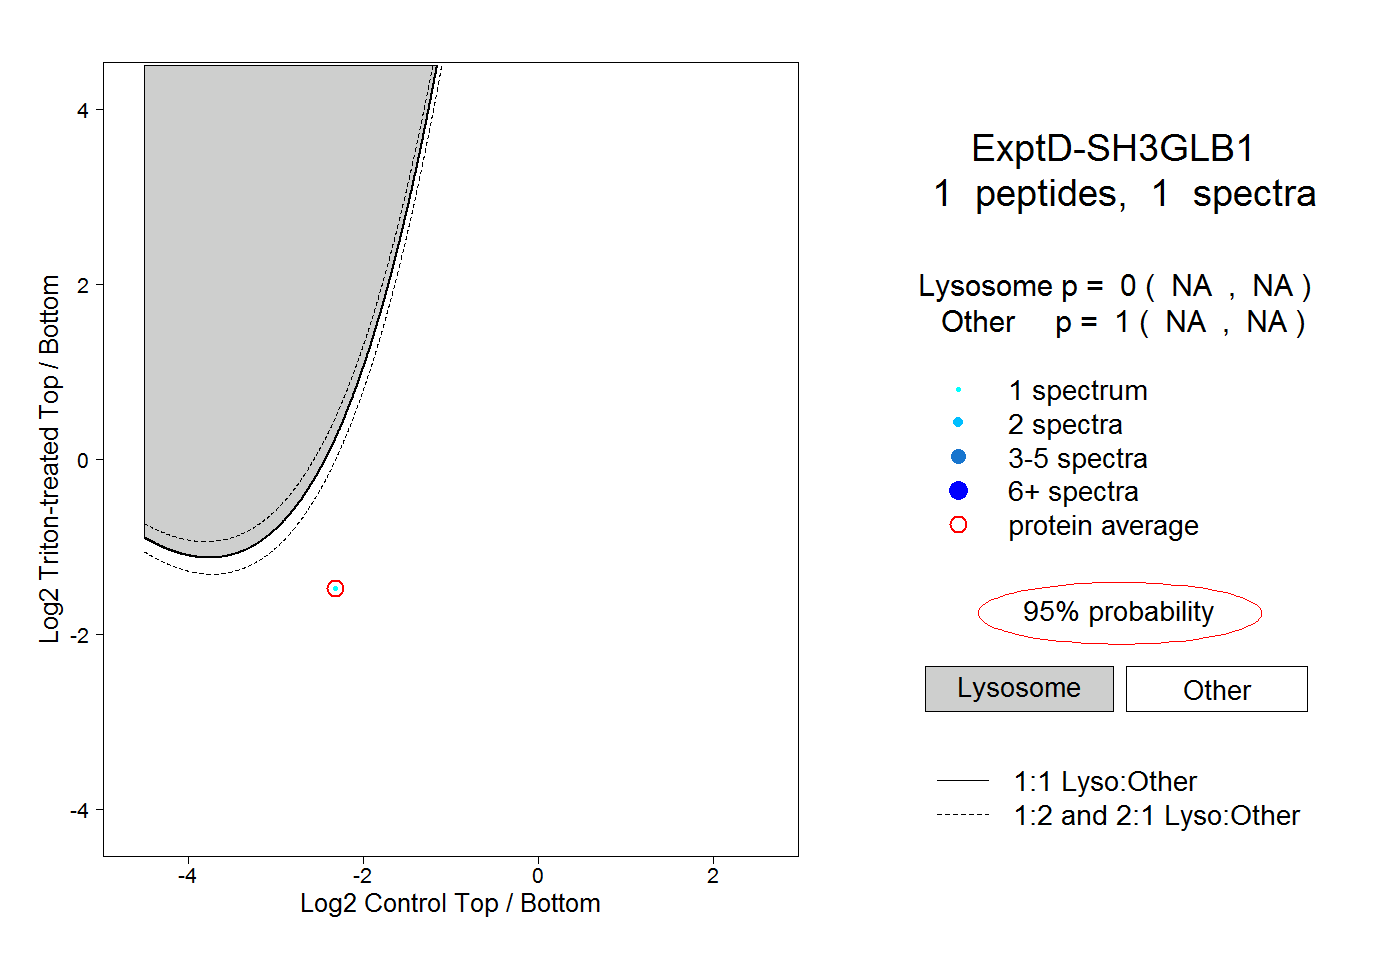 |
0.000 NA | NA |
1.000 NA | NA |