 28
28peptides
spectra
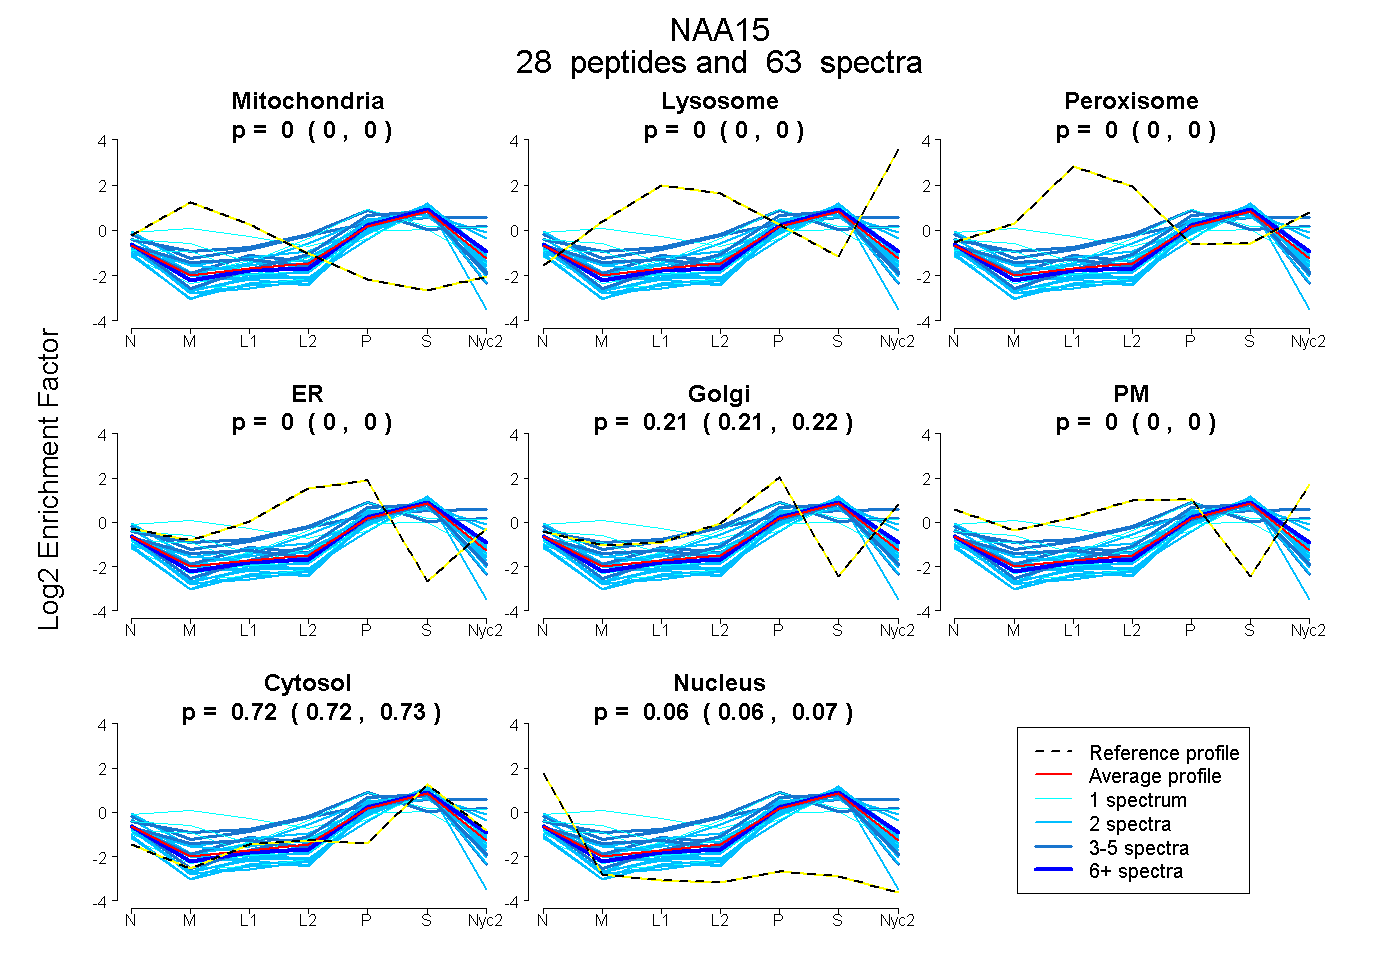
0.000 | 0.000
0.000 | 0.000
0.000 | 0.000
0.000 | 0.000
0.210 | 0.217
0.000 | 0.000
0.719 | 0.725
0.060 | 0.067
7peptides
spectra
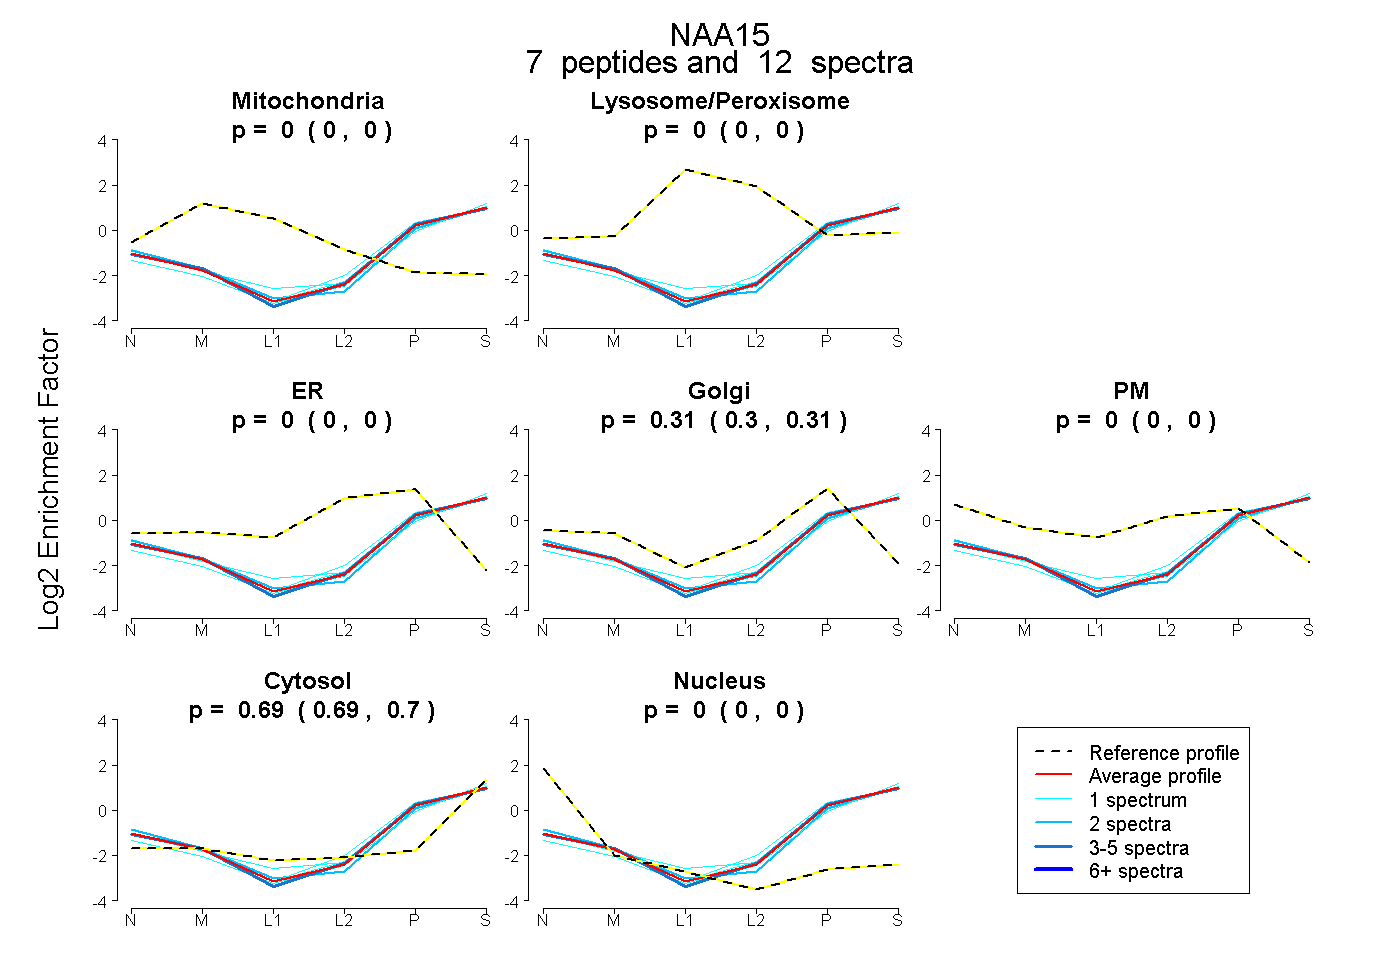
0.000 | 0.000
0.000 | 0.000
0.000 | 0.000
0.303 | 0.313
0.000 | 0.000
0.687 | 0.696
0.000 | 0.000
15peptides
spectra
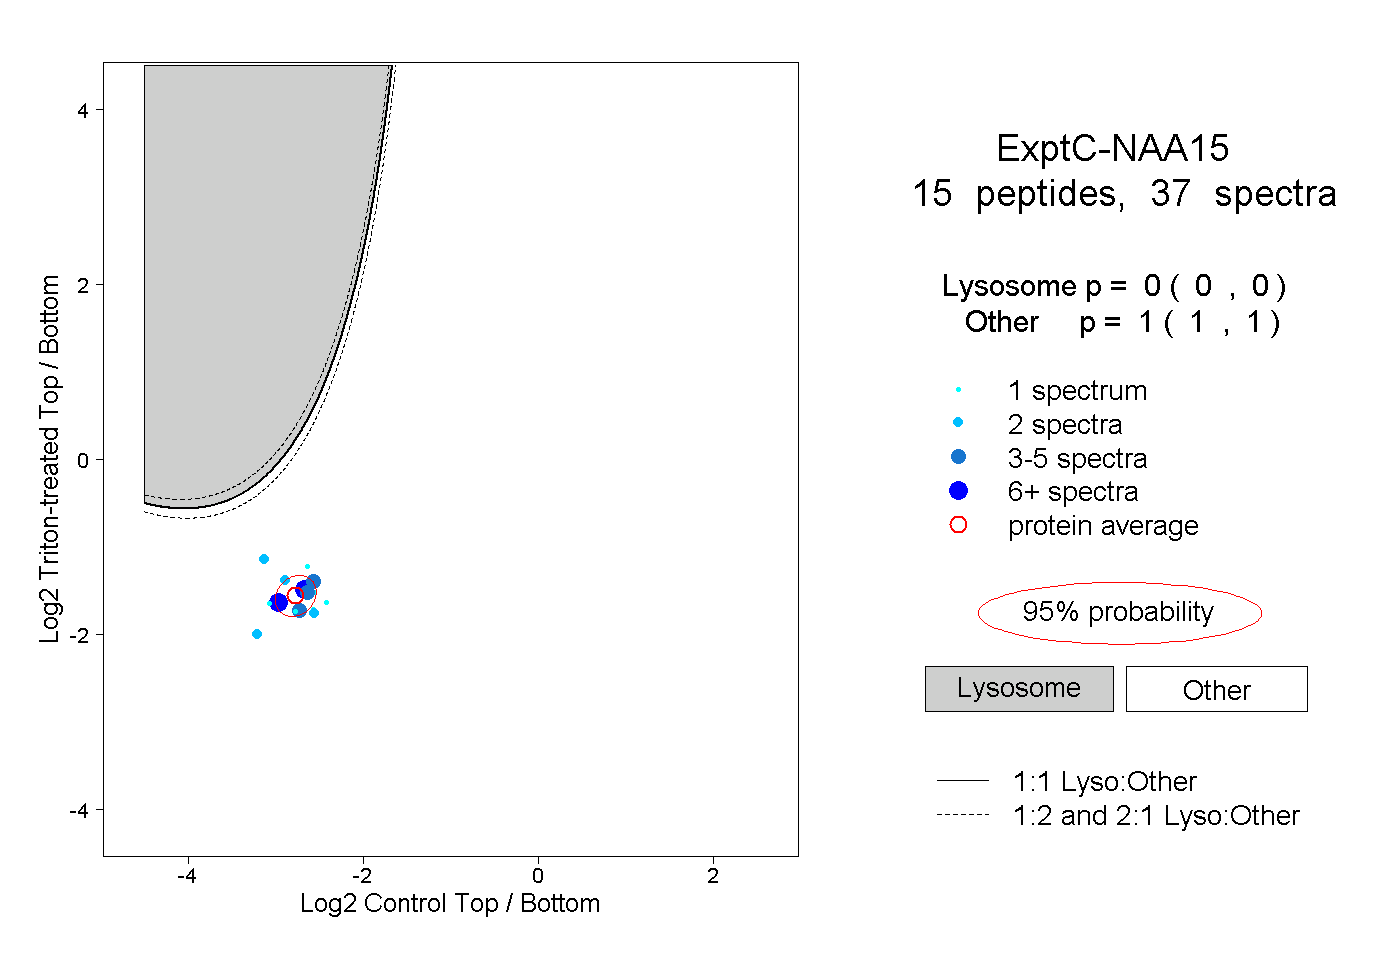
0.000 | 0.000
1.000 | 1.000
2peptides
spectra
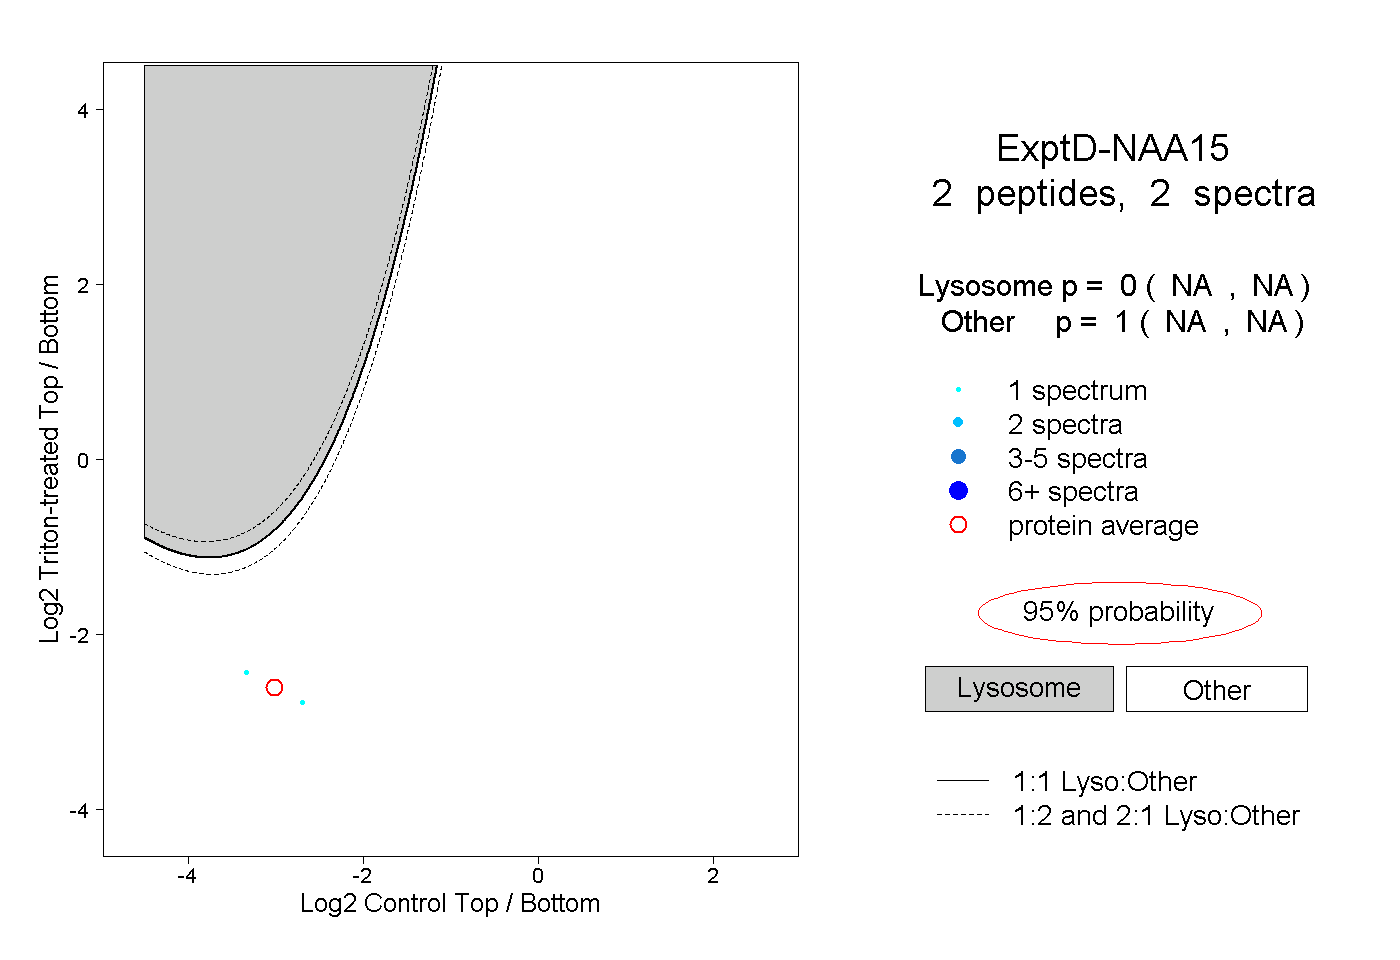
NA | NA
NA | NA