 28
28peptides
spectra
0.000 | 0.000
0.000 | 0.000
0.000 | 0.000
0.000 | 0.000
0.210 | 0.217
0.000 | 0.000
0.719 | 0.725
0.060 | 0.067
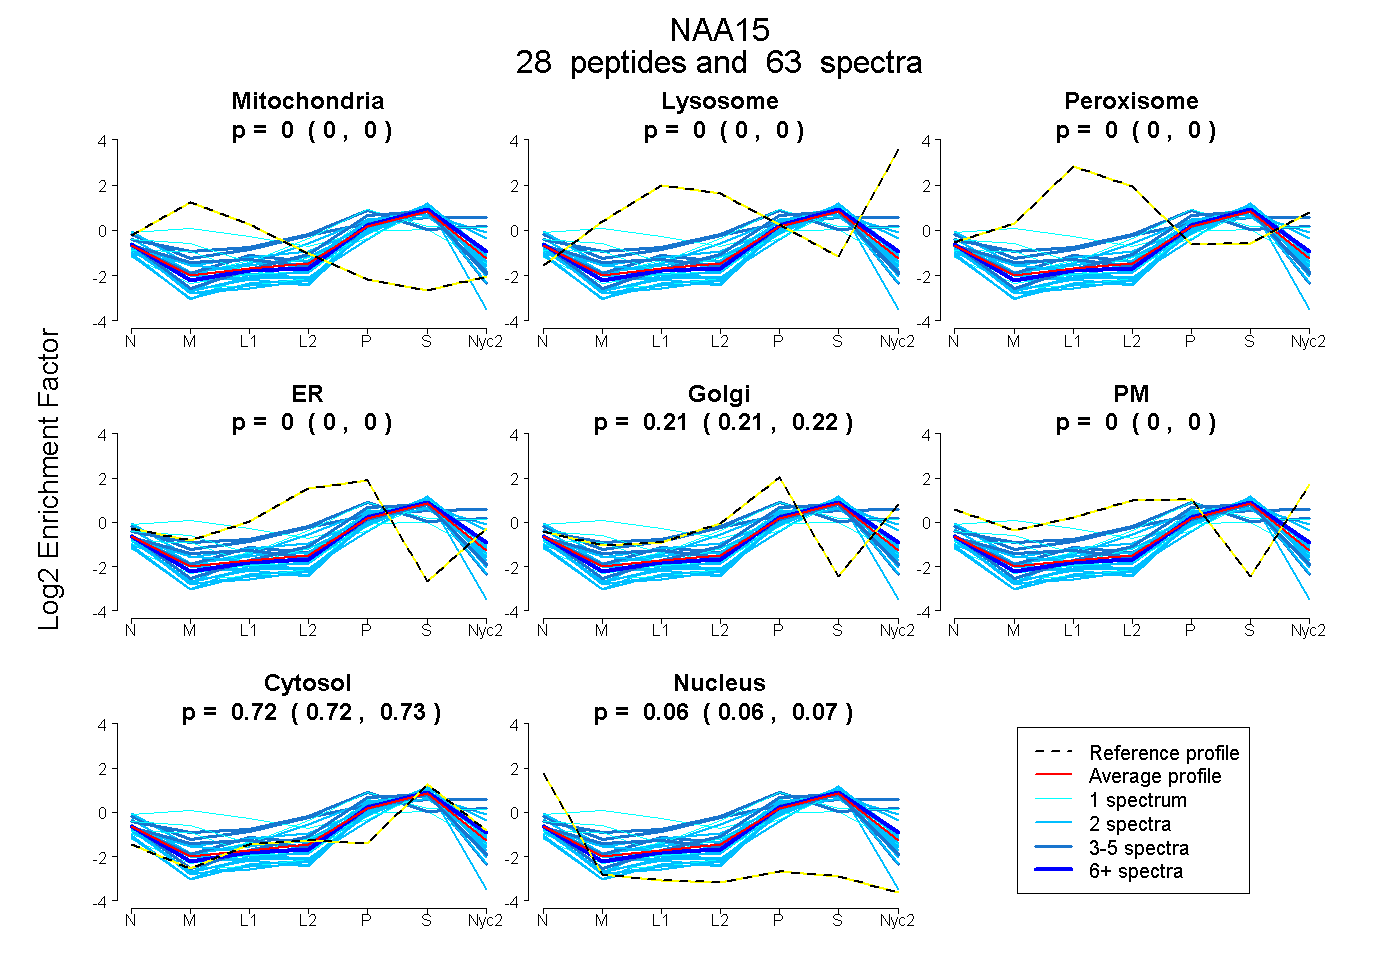
| Plot | Mito | Lyso | Perox | ER | Golgi | PM | Cytosol | Nucleus | |||||
| Expt A |
28 peptides |
63 spectra |
|
0.000 0.000 | 0.000 |
0.000 0.000 | 0.000 |
0.000 0.000 | 0.000 |
0.000 0.000 | 0.000 |
0.214 0.210 | 0.217 |
0.000 0.000 | 0.000 |
0.722 0.719 | 0.725 |
0.064 0.060 | 0.067 |
| 1 spectrum, ALKPANMLER | 0.000 | 0.000 | 0.000 | 0.000 | 0.226 | 0.000 | 0.774 | 0.000 | ||
| 2 spectra, EALEHLCTYEK | 0.000 | 0.000 | 0.000 | 0.000 | 0.000 | 0.000 | 0.757 | 0.243 | ||
| 2 spectra, LPLNFLSGEK | 0.000 | 0.000 | 0.000 | 0.150 | 0.000 | 0.000 | 0.737 | 0.114 | ||
| 2 spectra, FLTPLK | 0.000 | 0.000 | 0.000 | 0.000 | 0.224 | 0.000 | 0.705 | 0.071 | ||
| 2 spectra, LEDVLR | 0.000 | 0.000 | 0.000 | 0.000 | 0.061 | 0.000 | 0.779 | 0.160 | ||
| 2 spectra, LEDAADVYR | 0.000 | 0.000 | 0.000 | 0.000 | 0.054 | 0.000 | 0.779 | 0.167 | ||
| 3 spectra, WMDEAQALDTADR | 0.061 | 0.000 | 0.000 | 0.082 | 0.091 | 0.000 | 0.697 | 0.068 | ||
| 1 spectrum, QHPFYFK | 0.111 | 0.000 | 0.000 | 0.000 | 0.164 | 0.000 | 0.725 | 0.000 | ||
| 2 spectra, NPENWAYYK | 0.000 | 0.000 | 0.000 | 0.000 | 0.042 | 0.000 | 0.785 | 0.172 | ||
| 2 spectra, EAAEAYR | 0.000 | 0.000 | 0.000 | 0.000 | 0.141 | 0.000 | 0.770 | 0.089 | ||
| 2 spectra, DLPEAVR | 0.000 | 0.000 | 0.000 | 0.000 | 0.039 | 0.000 | 0.892 | 0.069 | ||
| 2 spectra, EAEEMCSK | 0.000 | 0.000 | 0.000 | 0.000 | 0.125 | 0.000 | 0.742 | 0.133 | ||
| 3 spectra, VETPLEEAIK | 0.000 | 0.000 | 0.000 | 0.177 | 0.033 | 0.000 | 0.702 | 0.088 | ||
| 3 spectra, LFNSVCESK | 0.000 | 0.000 | 0.148 | 0.000 | 0.472 | 0.000 | 0.380 | 0.000 | ||
| 10 spectra, YQLLQLRPAQR | 0.000 | 0.000 | 0.000 | 0.000 | 0.211 | 0.000 | 0.739 | 0.050 | ||
| 1 spectrum, NSDSLPHR | 0.000 | 0.000 | 0.027 | 0.000 | 0.451 | 0.086 | 0.435 | 0.000 | ||
| 1 spectrum, GLVPR | 0.323 | 0.000 | 0.076 | 0.169 | 0.041 | 0.000 | 0.390 | 0.000 | ||
| 2 spectra, FLLMLQSVK | 0.000 | 0.000 | 0.000 | 0.000 | 0.330 | 0.052 | 0.618 | 0.000 | ||
| 2 spectra, SYVDLLK | 0.000 | 0.000 | 0.000 | 0.000 | 0.127 | 0.000 | 0.773 | 0.100 | ||
| 1 spectrum, IYEEAWTK | 0.000 | 0.000 | 0.000 | 0.000 | 0.138 | 0.000 | 0.768 | 0.094 | ||
| 3 spectra, GCPPVFNTLR | 0.000 | 0.000 | 0.000 | 0.157 | 0.000 | 0.000 | 0.735 | 0.108 | ||
| 1 spectrum, AIELATTLDGSLTNR | 0.000 | 0.000 | 0.000 | 0.000 | 0.206 | 0.000 | 0.740 | 0.054 | ||
| 4 spectra, CHEIER | 0.000 | 0.044 | 0.000 | 0.000 | 0.010 | 0.393 | 0.553 | 0.000 | ||
| 2 spectra, DLSLLQIQMR | 0.000 | 0.000 | 0.000 | 0.000 | 0.191 | 0.000 | 0.742 | 0.067 | ||
| 1 spectrum, FAEHGETLAMK | 0.000 | 0.000 | 0.000 | 0.000 | 0.126 | 0.000 | 0.820 | 0.054 | ||
| 2 spectra, GLTLNCLGK | 0.000 | 0.000 | 0.000 | 0.216 | 0.076 | 0.000 | 0.638 | 0.069 | ||
| 2 spectra, GELLLQLCR | 0.010 | 0.000 | 0.000 | 0.000 | 0.163 | 0.000 | 0.750 | 0.076 | ||
| 2 spectra, DLEGYR | 0.000 | 0.000 | 0.000 | 0.000 | 0.266 | 0.000 | 0.734 | 0.000 |
| Plot | Mito | Lyso or Perox | ER | Golgi | PM | Cytosol | Nucleus | ||||||
| Expt B |
7 peptides |
12 spectra |
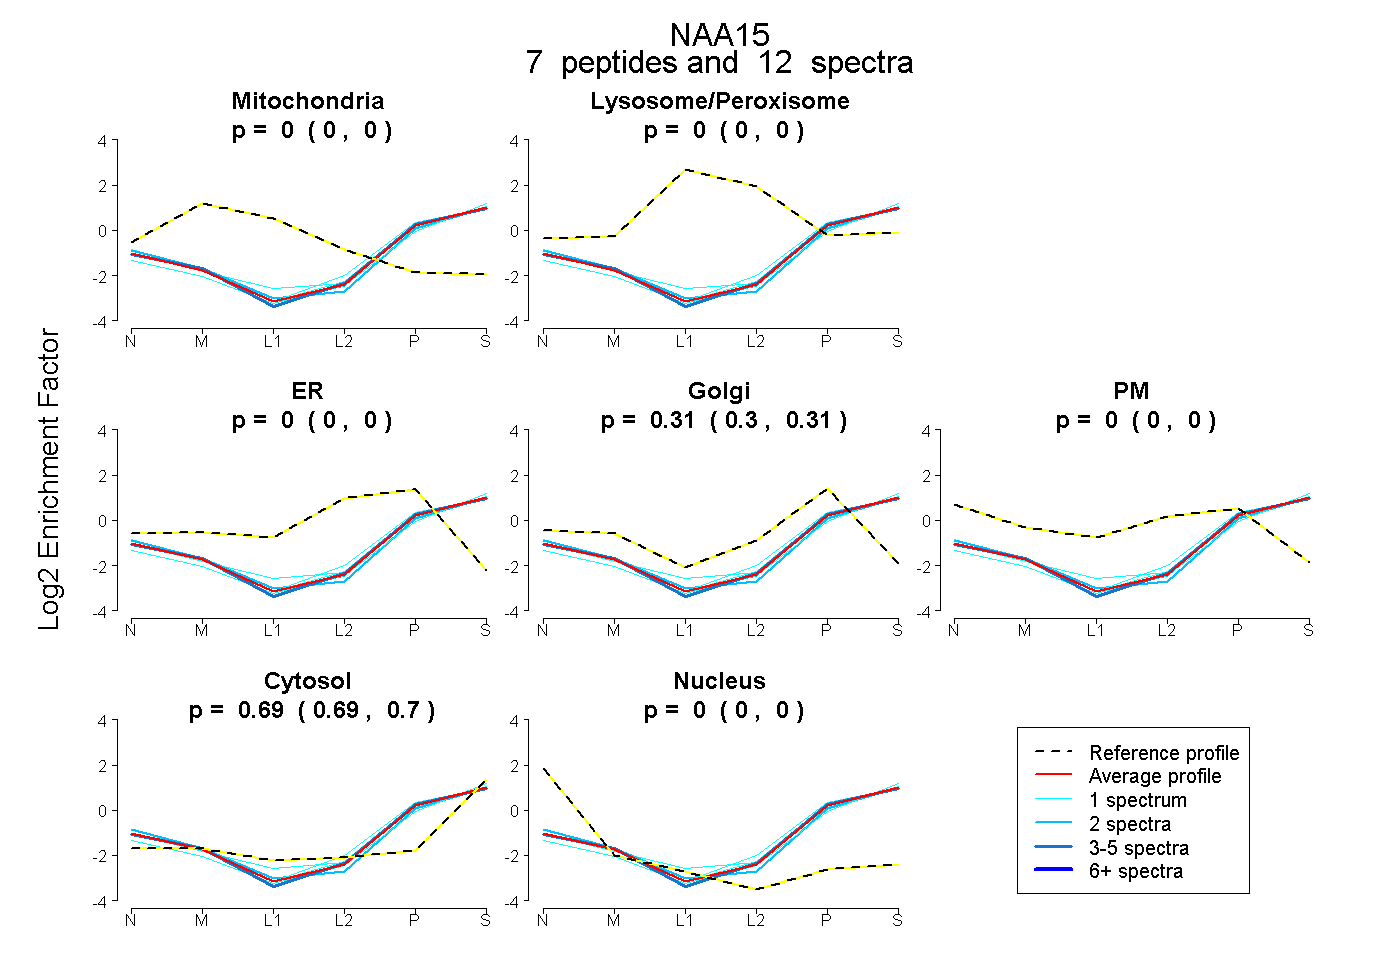 |
0.000 0.000 | 0.000 |
0.000 0.000 | 0.000 |
0.000 0.000 | 0.000 |
0.308 0.303 | 0.313 |
0.000 0.000 | 0.000 |
0.692 0.687 | 0.696 |
0.000 0.000 | 0.000 |
|||
| Plot | Lyso | Other | |||||||||||
| Expt C |
15 peptides |
37 spectra |
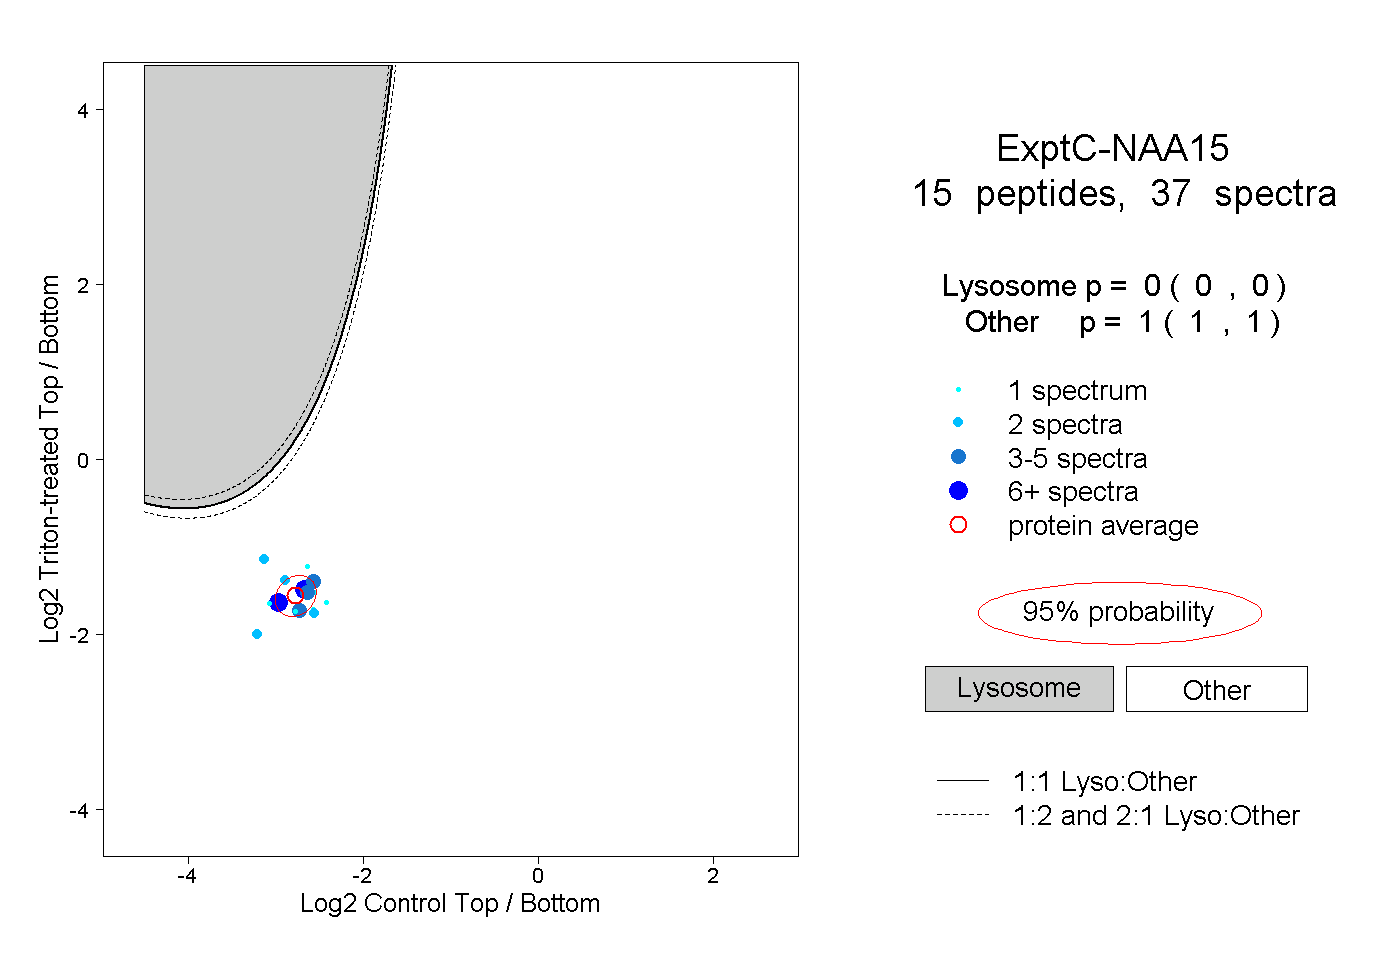 |
0.000 0.000 | 0.000 |
1.000 1.000 | 1.000 |
||||||||
| Plot | Lyso | Other | |||||||||||
| Expt D |
2 peptides |
2 spectra |
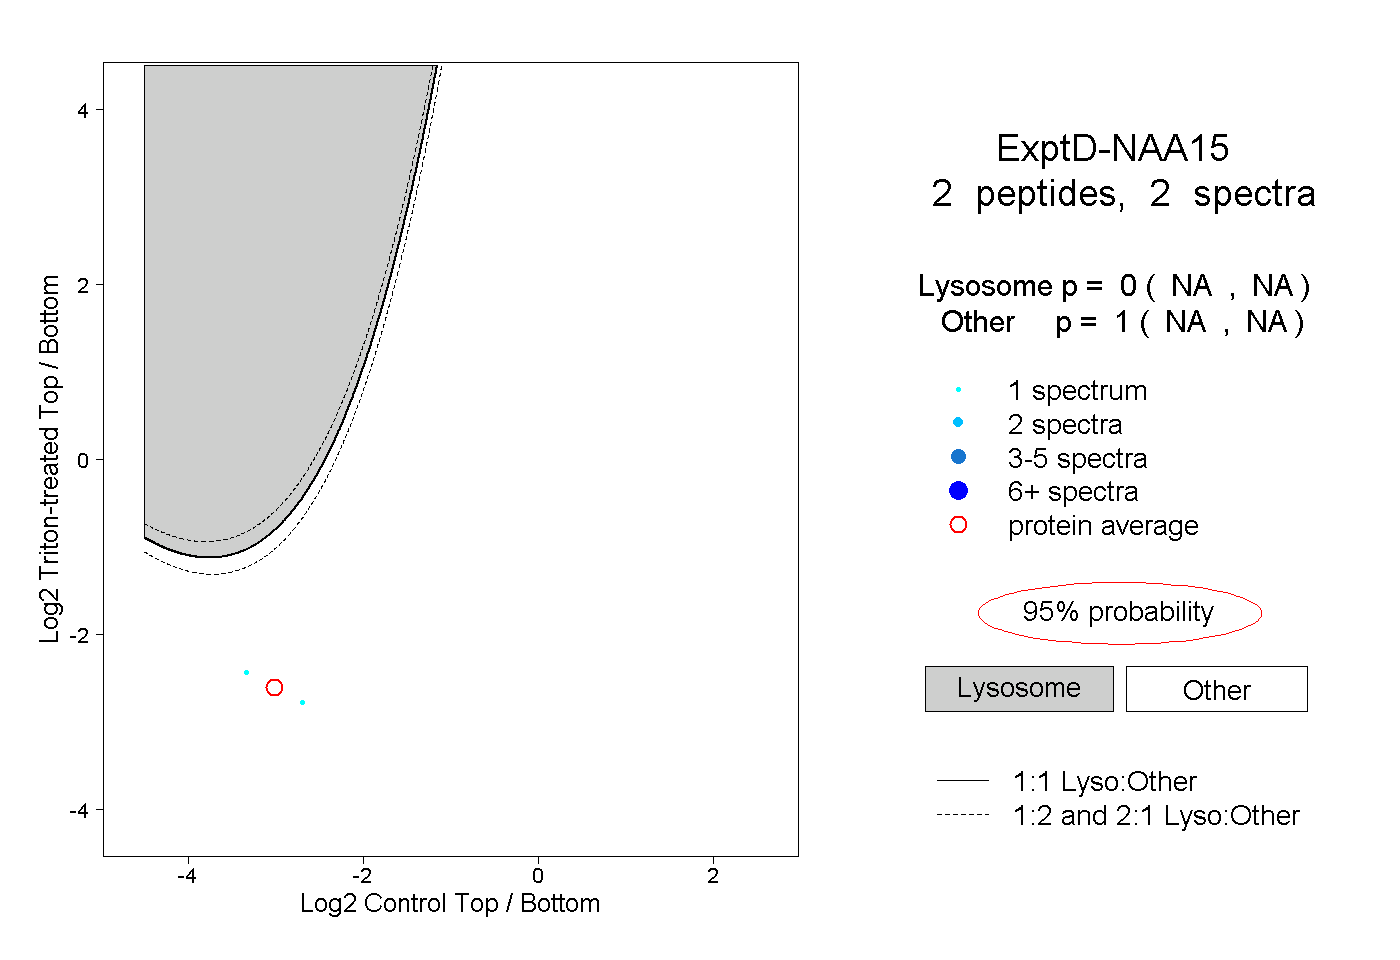 |
0.000 NA | NA |
1.000 NA | NA |