NAA15
[ENSRNOP00000017379]
Main page
| | | Plot |
Mito |
Lyso |
|
Perox |
ER |
Golgi |
PM |
Cytosol |
Nucleus |
|
| Expt A |
 28
28
peptides |
63
spectra |
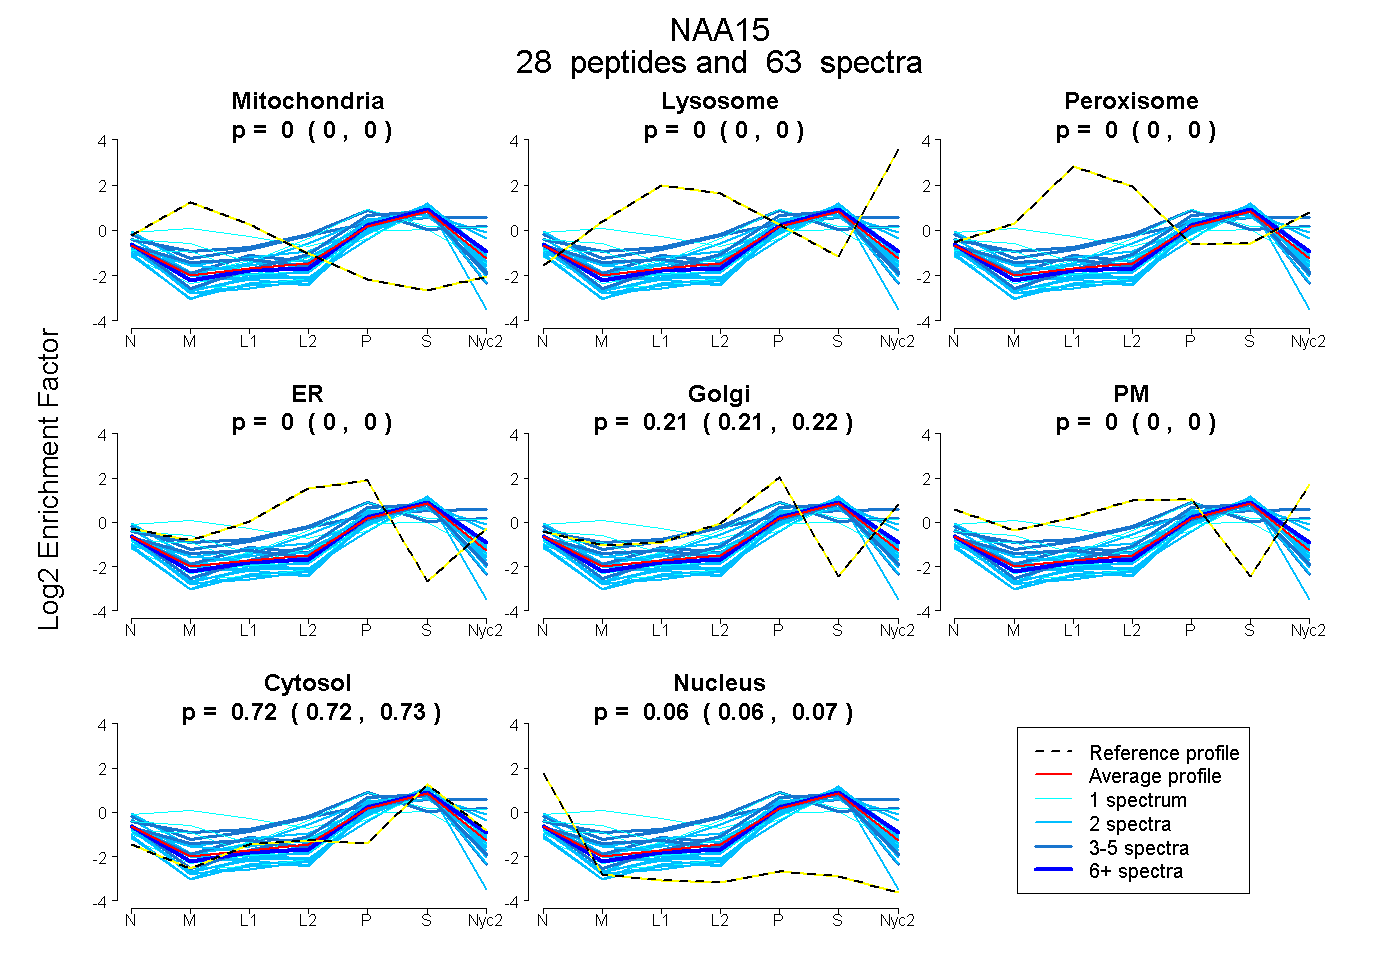 |
0.000
0.000 | 0.000 |
0.000
0.000 | 0.000 |
|
0.000
0.000 | 0.000 |
0.000
0.000 | 0.000 |
0.214
0.210 | 0.217 |
0.000
0.000 | 0.000 |
0.722
0.719 | 0.725 |
0.064
0.060 | 0.067 |
|
| | | Plot |
Mito |
|
Lyso or Perox |
|
ER |
Golgi |
PM |
Cytosol |
Nucleus |
|
| Expt B |
7
peptides |
12
spectra |
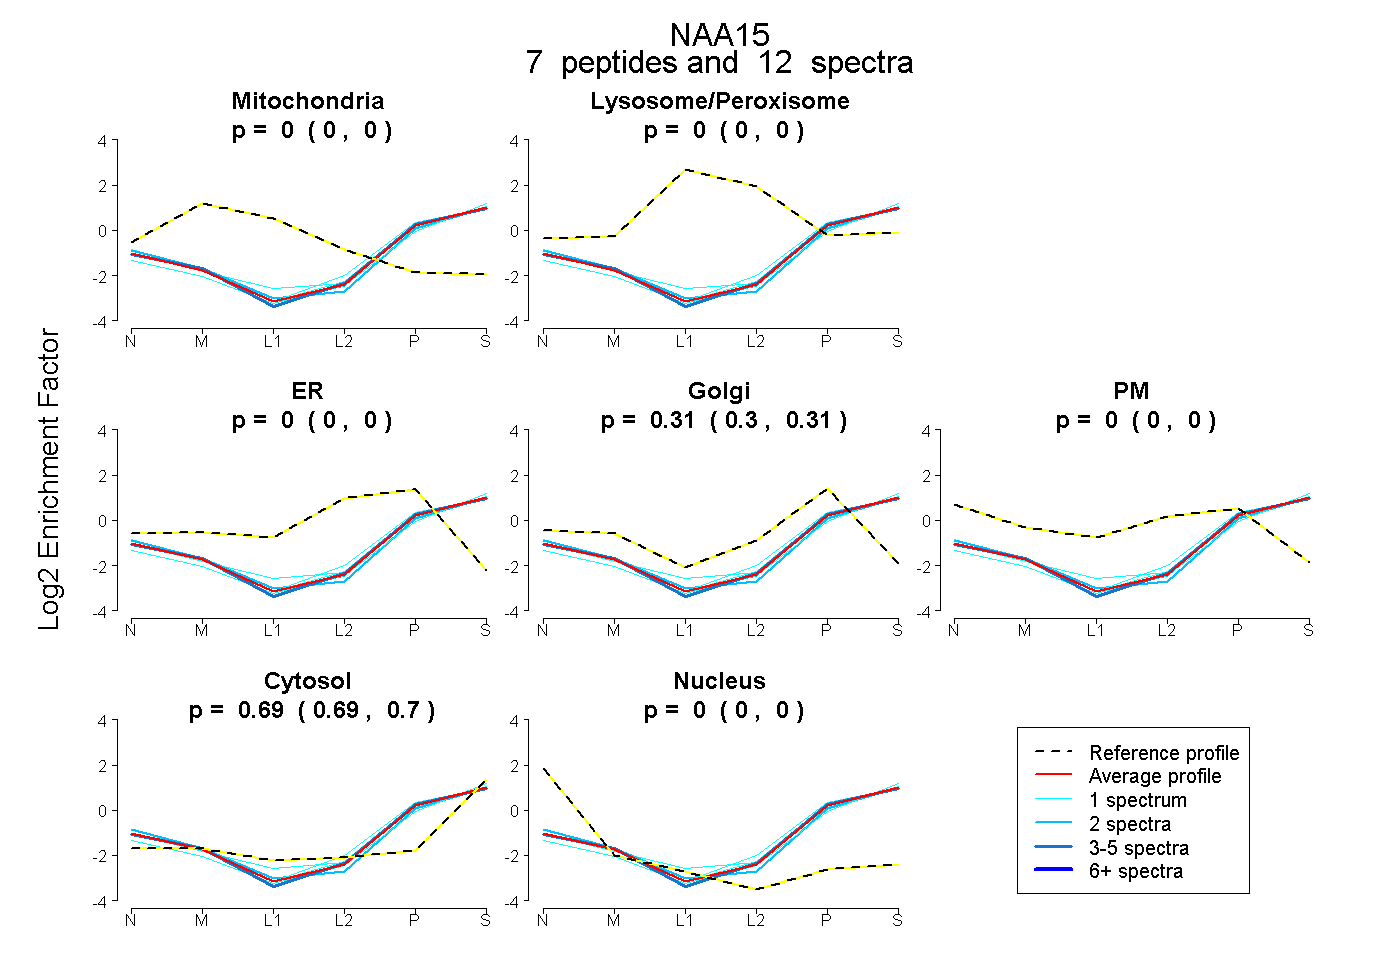 |
0.000
0.000 | 0.000 |
|
0.000
0.000 | 0.000 |
|
0.000
0.000 | 0.000 |
0.308
0.303 | 0.313 |
0.000
0.000 | 0.000 |
0.692
0.687 | 0.696 |
0.000
0.000 | 0.000 |
|
| 2 spectra, GCPPVFNTLR |
0.000 |
|
0.000 |
|
0.000 |
0.279 |
0.000 |
0.700 |
0.021 |
|
| 1 spectrum, LEDVLR |
0.000 |
|
0.000 |
|
0.000 |
0.220 |
0.000 |
0.780 |
0.000 |
|
| 2 spectra, LEDAADVYR |
0.000 |
|
0.000 |
|
0.000 |
0.328 |
0.000 |
0.672 |
0.000 |
|
| 1 spectrum, EEAYELVR |
0.000 |
|
0.000 |
|
0.000 |
0.346 |
0.000 |
0.654 |
0.000 |
|
| 1 spectrum, EAAEAYR |
0.000 |
|
0.000 |
|
0.000 |
0.298 |
0.000 |
0.702 |
0.000 |
|
| 1 spectrum, VETPLEEAIK |
0.000 |
|
0.000 |
|
0.000 |
0.350 |
0.000 |
0.650 |
0.000 |
|
| 4 spectra, YQLLQLRPAQR |
0.000 |
|
0.000 |
|
0.000 |
0.319 |
0.000 |
0.681 |
0.000 |
|
| | | Plot |
|
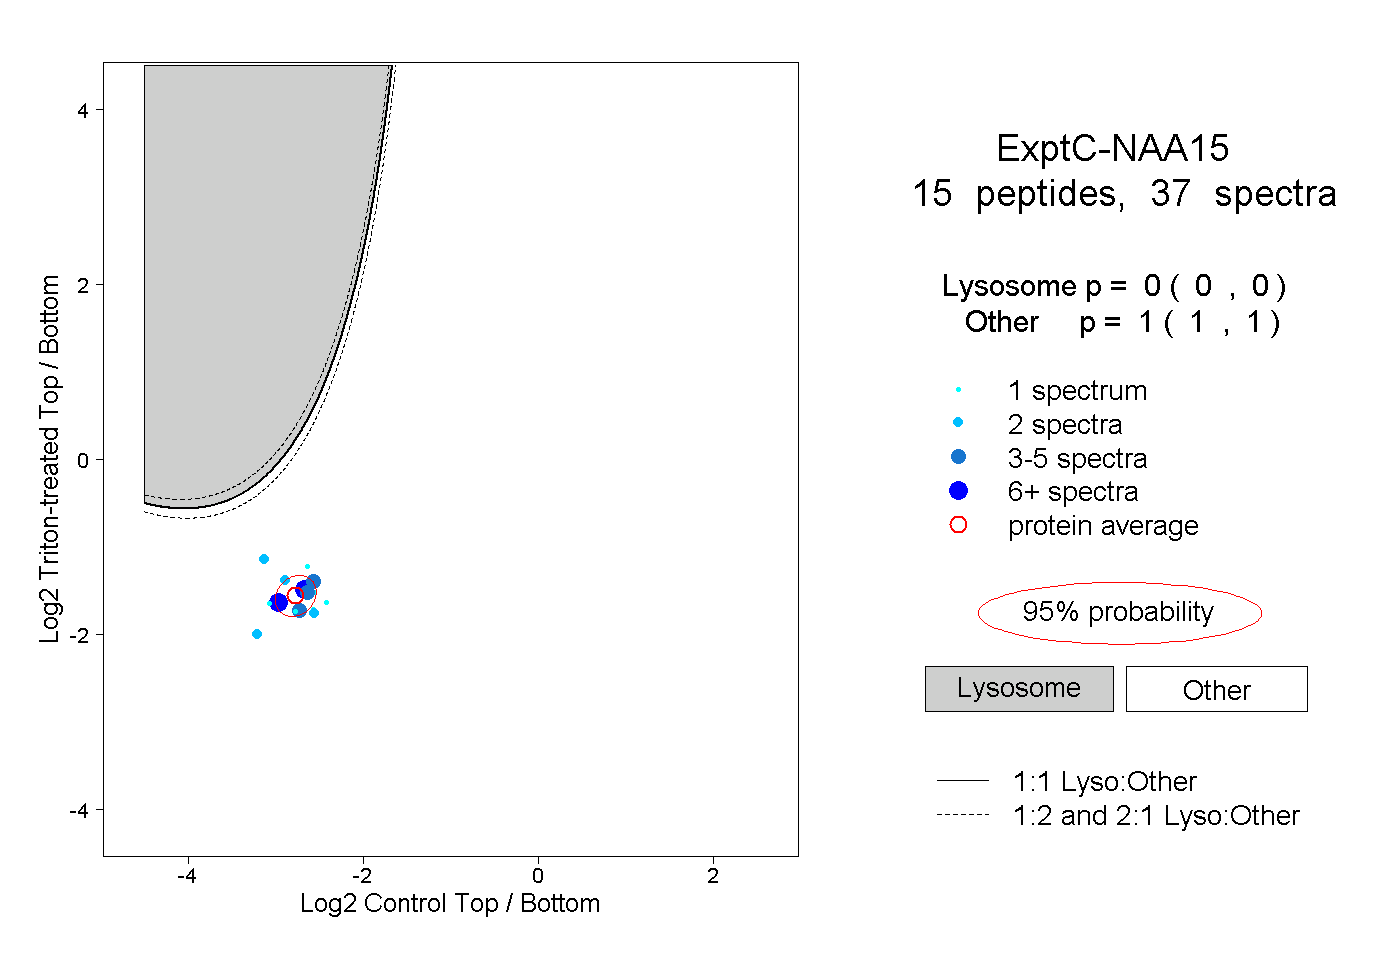
Lyso |
|
|
|
|
|
|
|
Other |
| Expt C |
15
peptides |
37
spectra |
 |
|
0.000
0.000 | 0.000 |
|
|
|
|
|
|
|
1.000
1.000 | 1.000 |
| | | Plot |
|
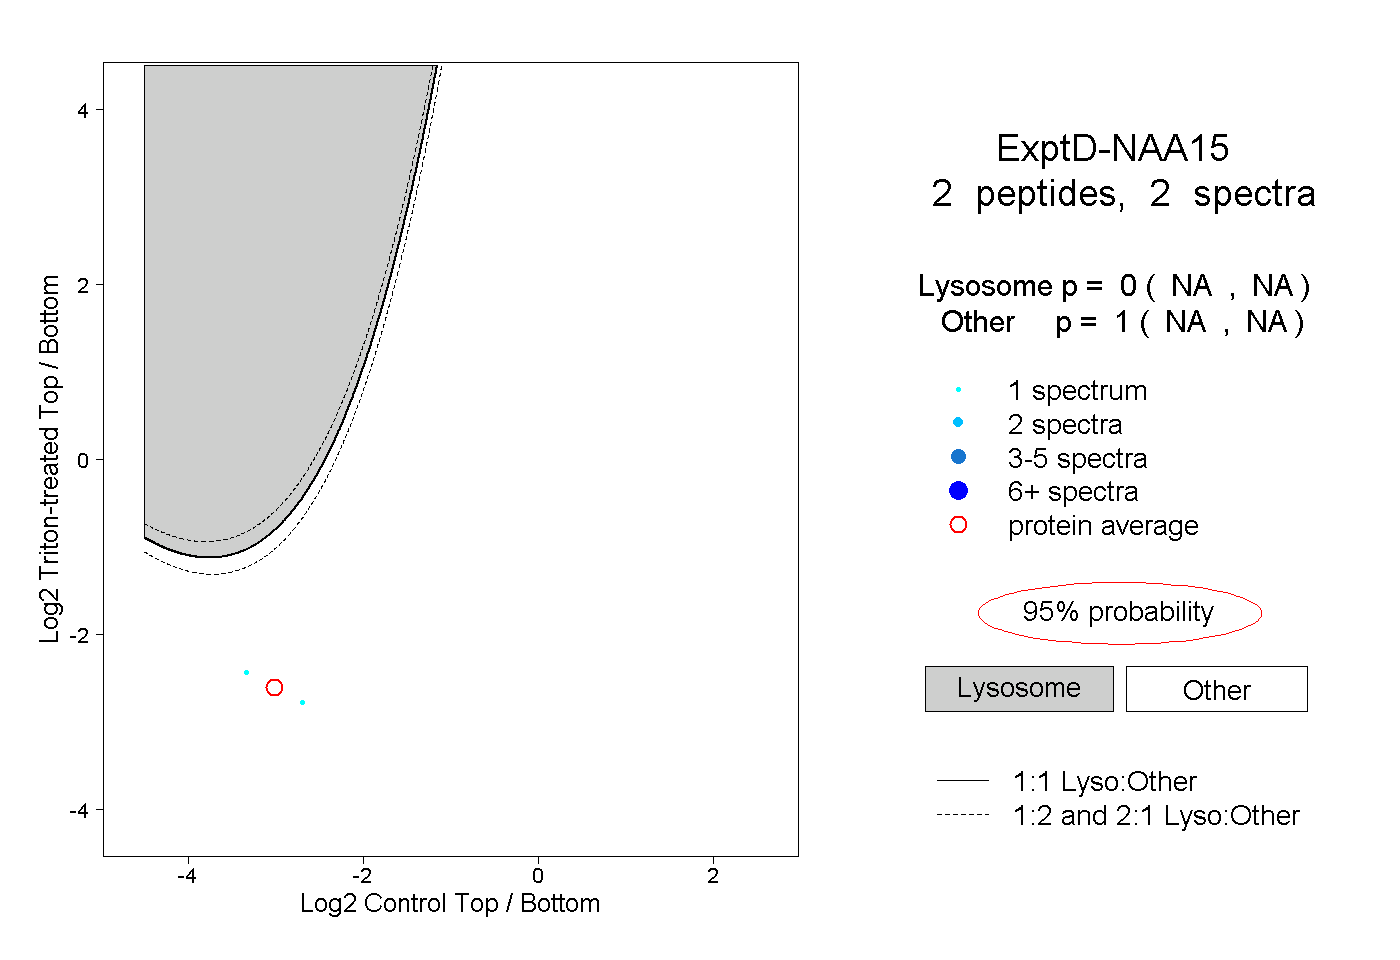
Lyso |
|
|
|
|
|
|
|
Other |
| Expt D |
2
peptides |
2
spectra |
 |
|
0.000
NA | NA |
|
|
|
|
|
|
|
1.000
NA | NA |