 11
11peptides
spectra
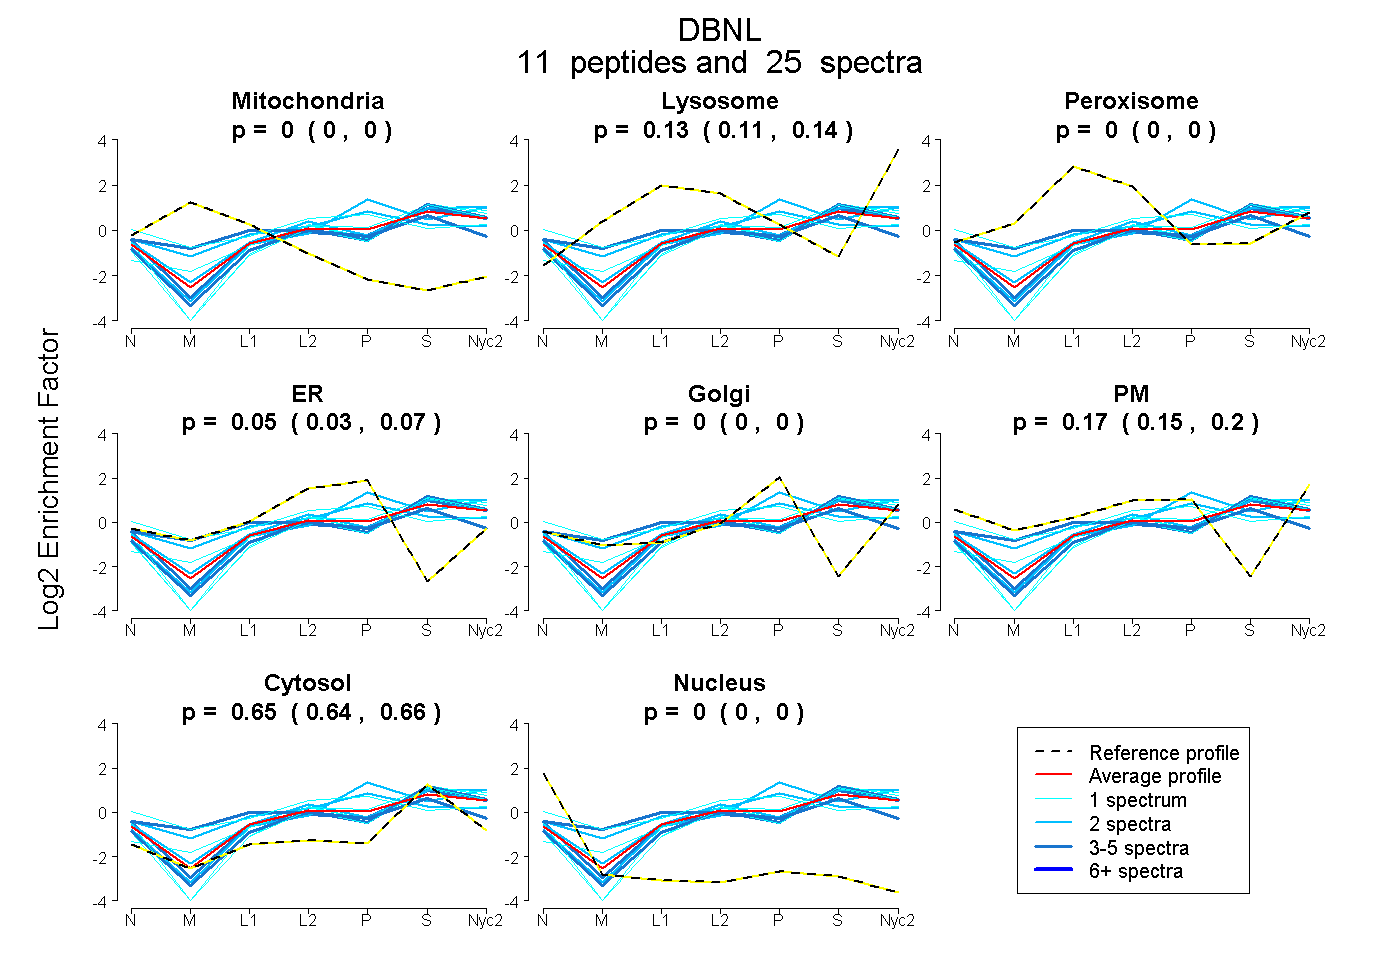
0.000 | 0.000
0.114 | 0.140
0.000 | 0.000
0.026 | 0.066
0.000 | 0.001
0.149 | 0.195
0.638 | 0.658
0.000 | 0.000
4peptides
spectra
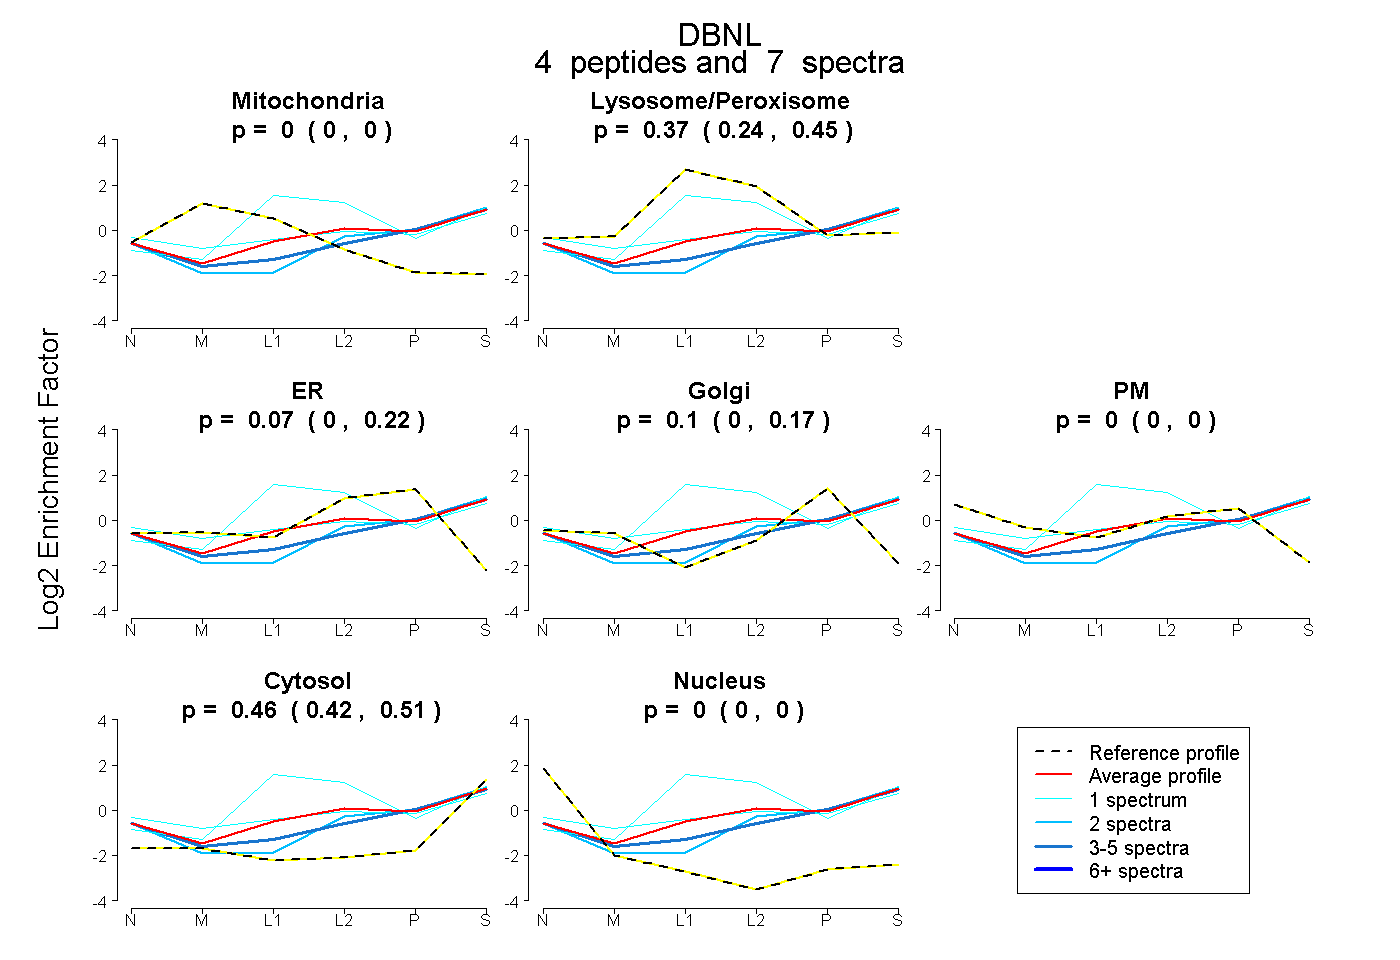
0.000 | 0.000
0.244 | 0.454
0.000 | 0.221
0.000 | 0.169
0.000 | 0.000
0.420 | 0.511
0.000 | 0.000
12peptides
spectra
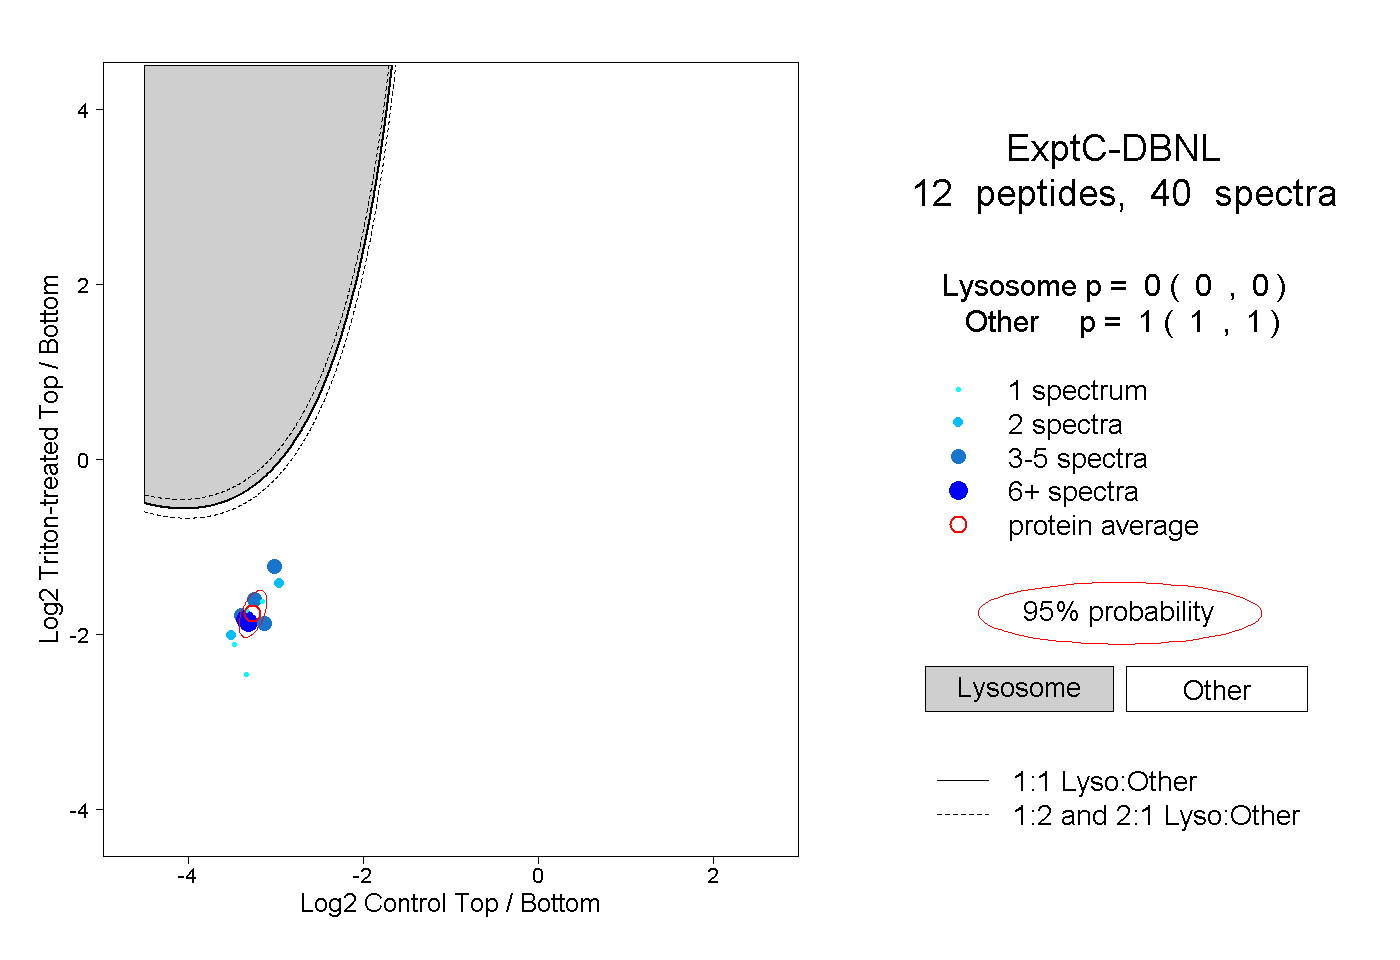
0.000 | 0.000
1.000 | 1.000
4peptides
spectra
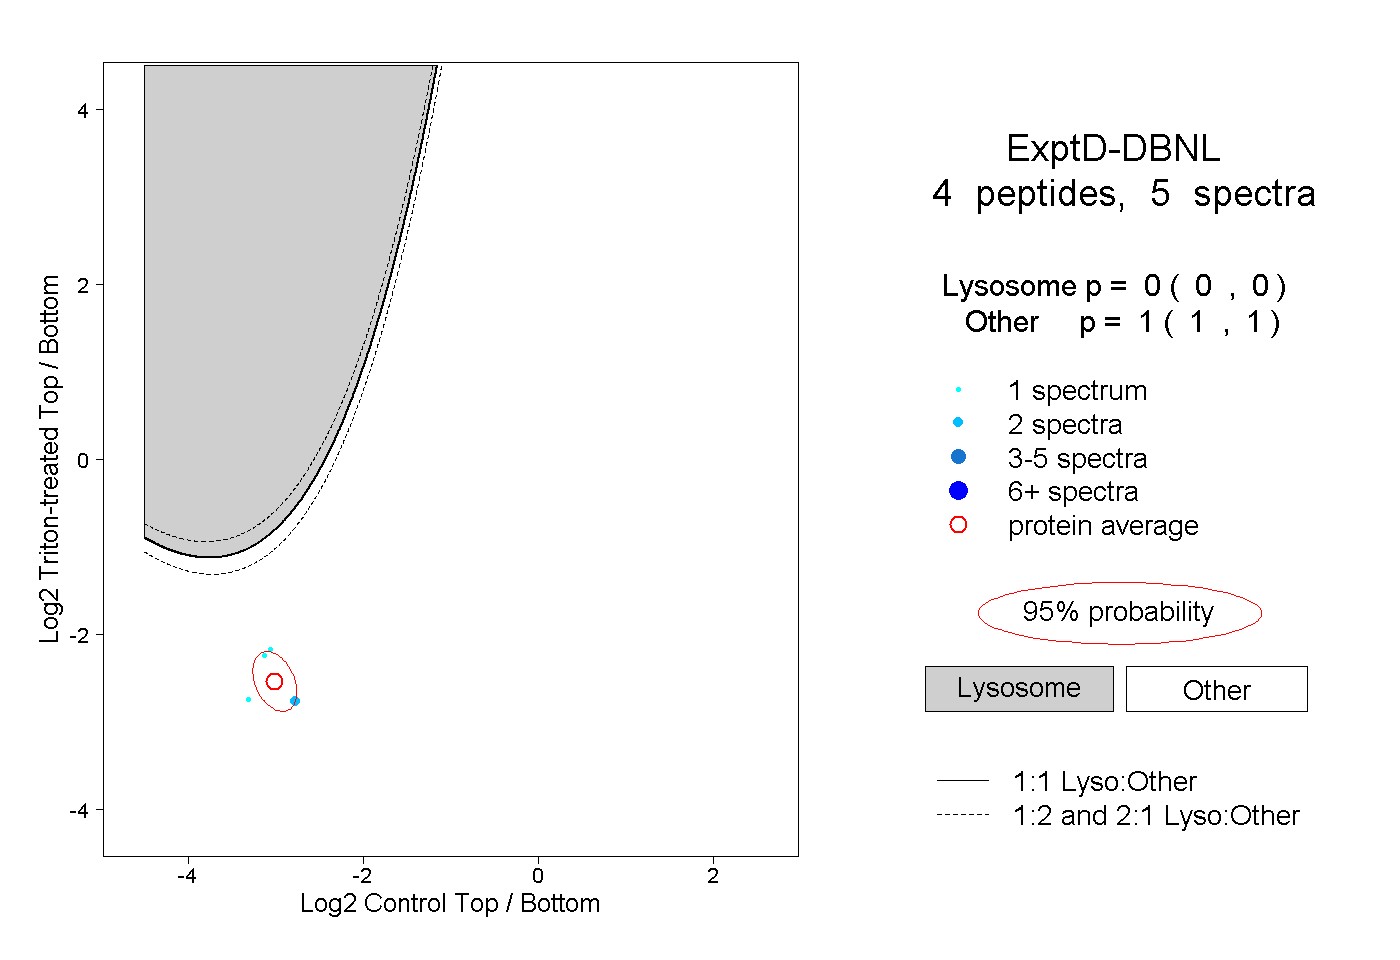
0.000 | 0.000
1.000 | 1.000