DBNL
[ENSRNOP00000017375]
Main page
| | | Plot |
Mito |
Lyso |
|
Perox |
ER |
Golgi |
PM |
Cytosol |
Nucleus |
|
| Expt A |
 11
11
peptides |
25
spectra |
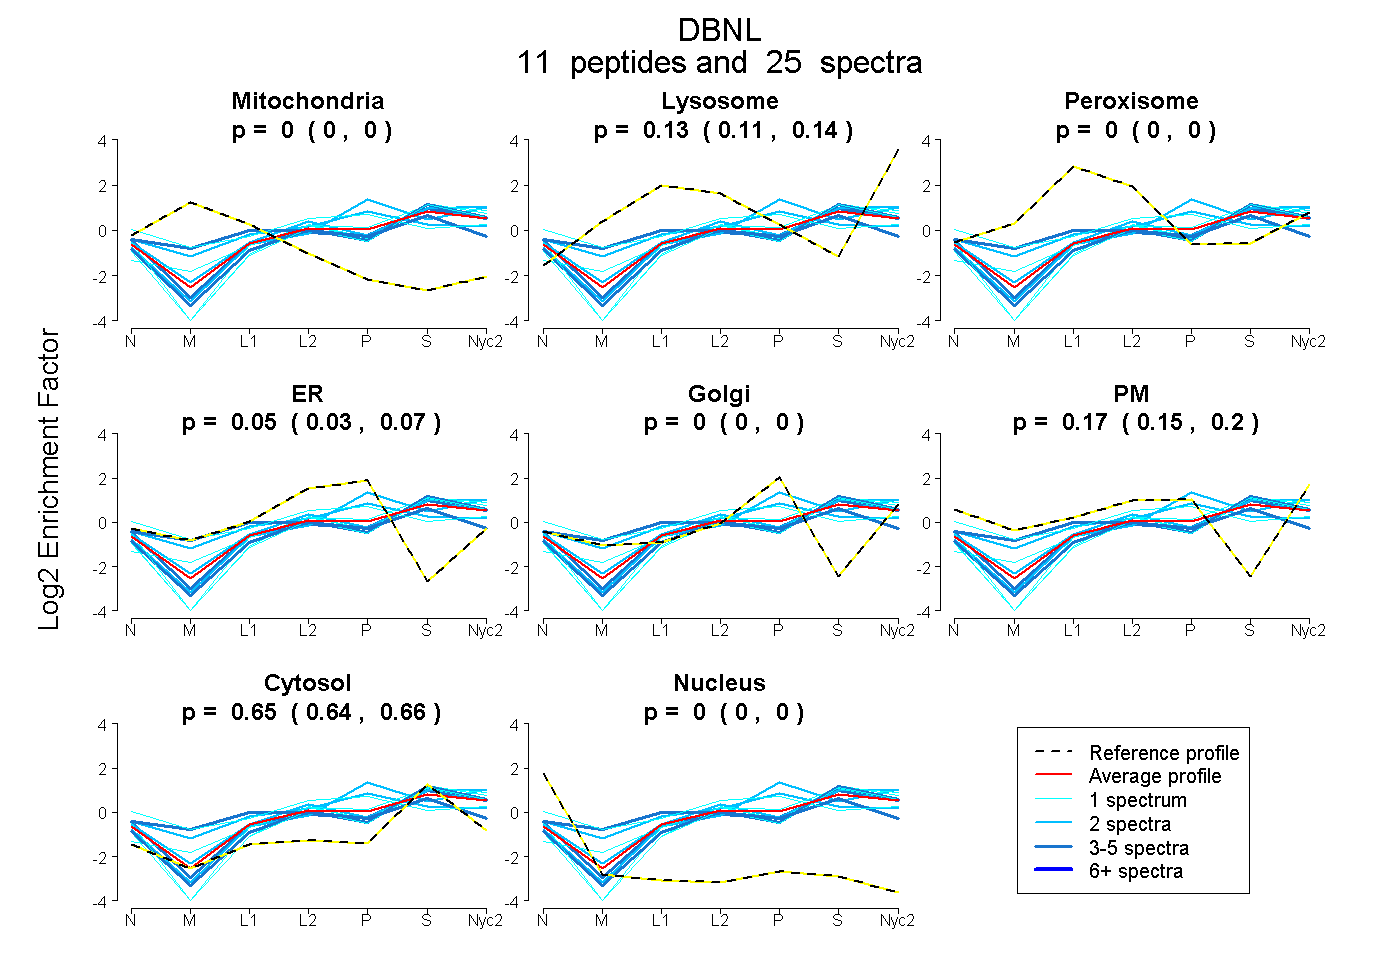 |
0.000
0.000 | 0.000 |
0.128
0.114 | 0.140 |
|
0.000
0.000 | 0.000 |
0.049
0.026 | 0.066 |
0.000
0.000 | 0.001 |
0.174
0.149 | 0.195 |
0.649
0.638 | 0.658 |
0.000
0.000 | 0.000 |
|
| | | Plot |
Mito |
|
Lyso or Perox |
|
ER |
Golgi |
PM |
Cytosol |
Nucleus |
|
| Expt B |
4
peptides |
7
spectra |
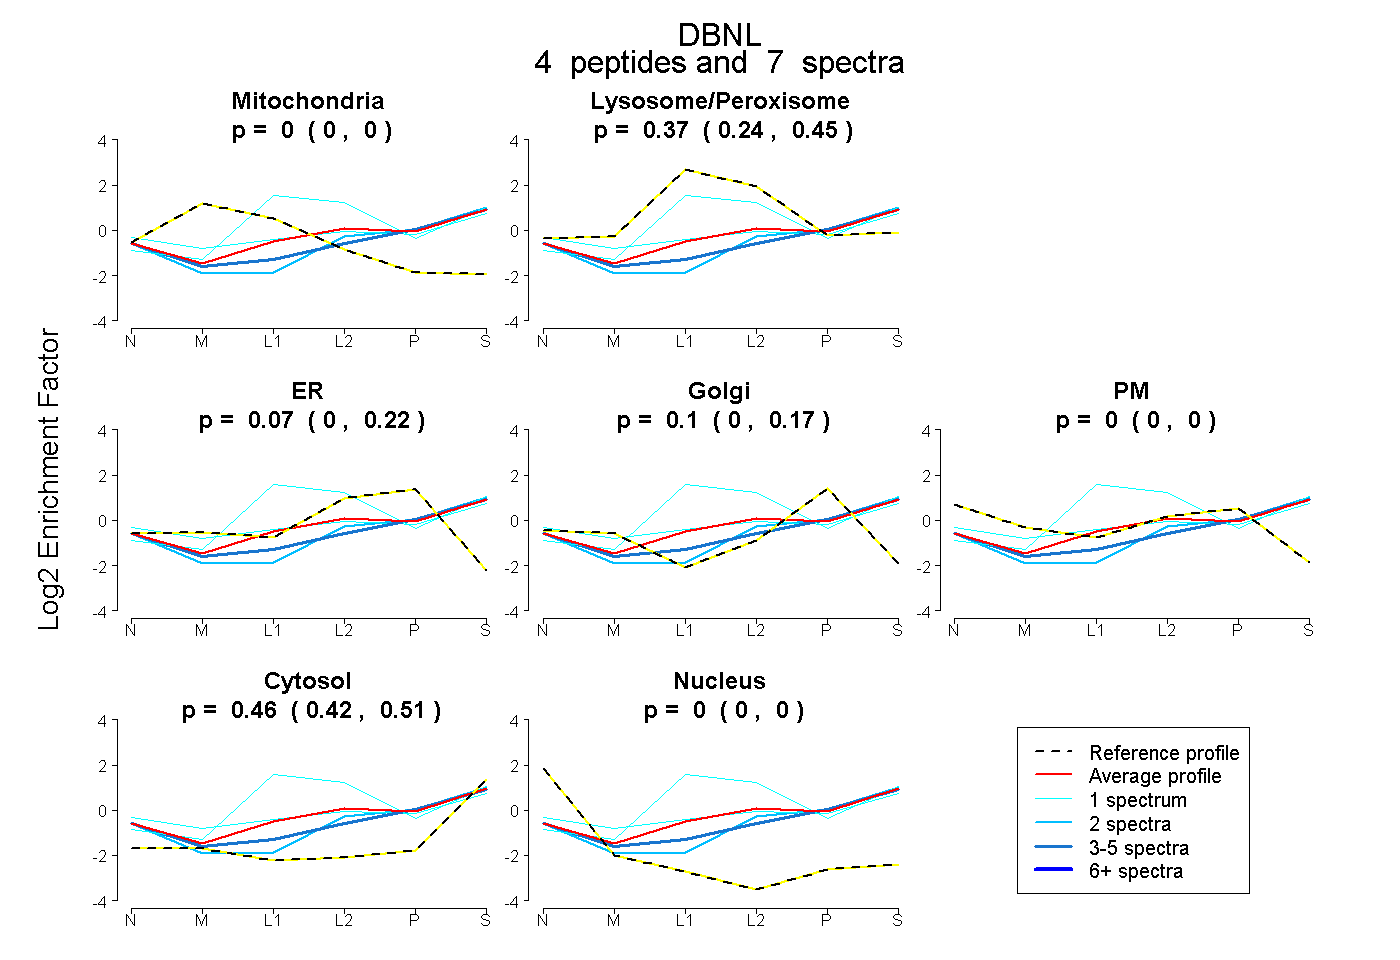 |
0.000
0.000 | 0.000 |
|
0.371
0.244 | 0.454 |
|
0.067
0.000 | 0.221 |
0.101
0.000 | 0.169 |
0.000
0.000 | 0.000 |
0.462
0.420 | 0.511 |
0.000
0.000 | 0.000 |
|
| 1 spectrum, VMYAFCR |
0.000 |
|
0.744 |
|
0.000 |
0.000 |
0.000 |
0.256 |
0.000 |
|
| 1 spectrum, NGPALQEAYVR |
0.000 |
|
0.356 |
|
0.000 |
0.066 |
0.165 |
0.413 |
0.000 |
|
| 2 spectra, ELQEAAR |
0.000 |
|
0.059 |
|
0.330 |
0.000 |
0.000 |
0.612 |
0.000 |
|
| 3 spectra, TGELEQEVVSR |
0.000 |
|
0.226 |
|
0.000 |
0.252 |
0.000 |
0.522 |
0.000 |
|
| | | Plot |
|
Lyso |
|
|
|
|
|
|
|
Other |
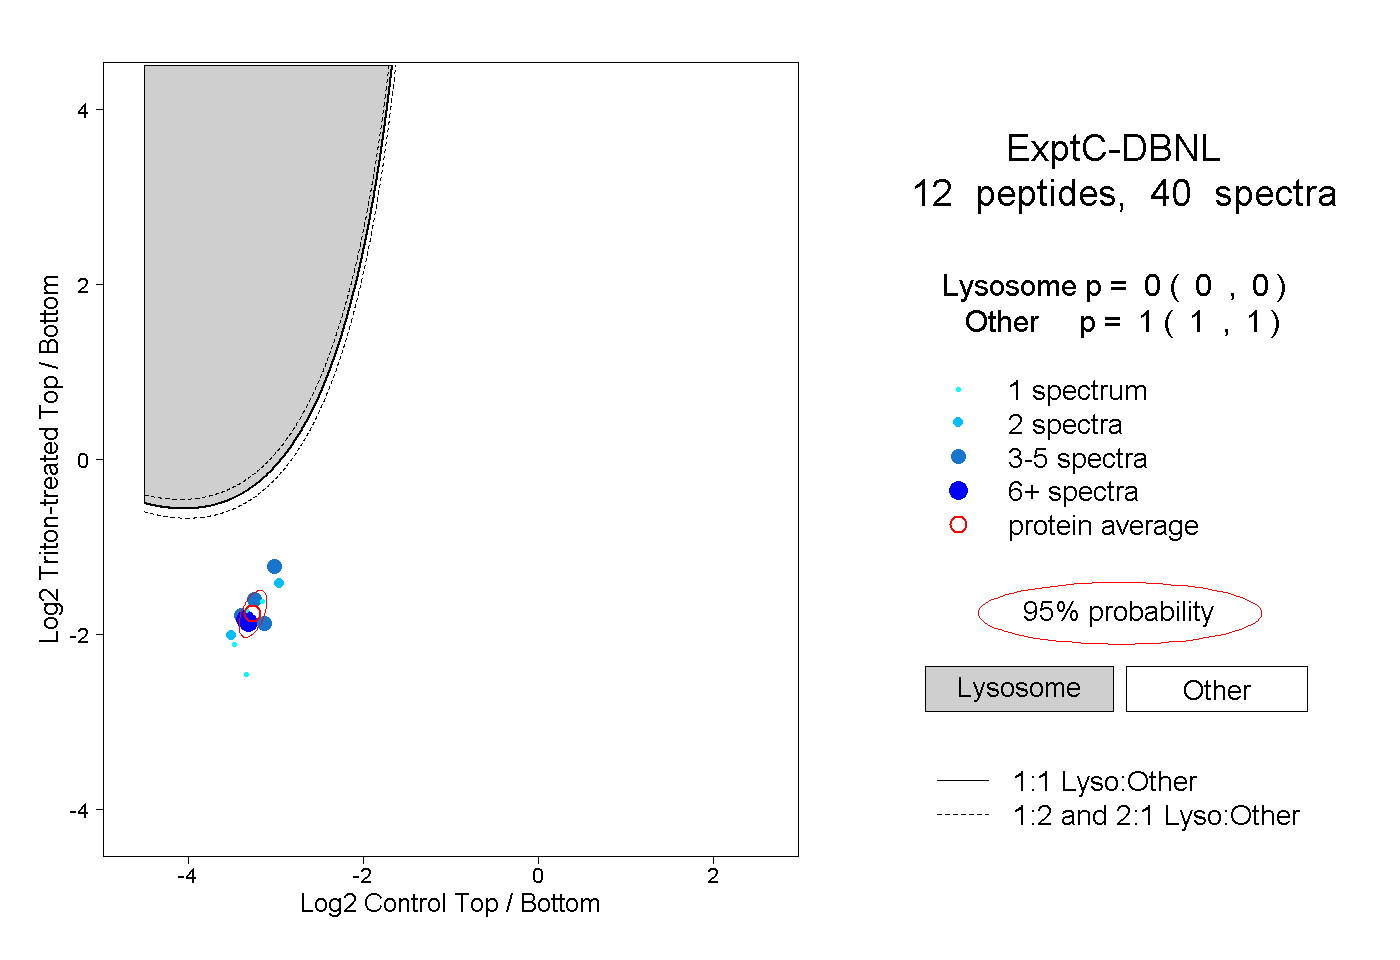
| Expt C |
12
peptides |
40
spectra |
 |
|
0.000
0.000 | 0.000 |
|
|
|
|
|
|
|
1.000
1.000 | 1.000 |
| | | Plot |
|
Lyso |
|
|
|
|
|
|
|
Other |
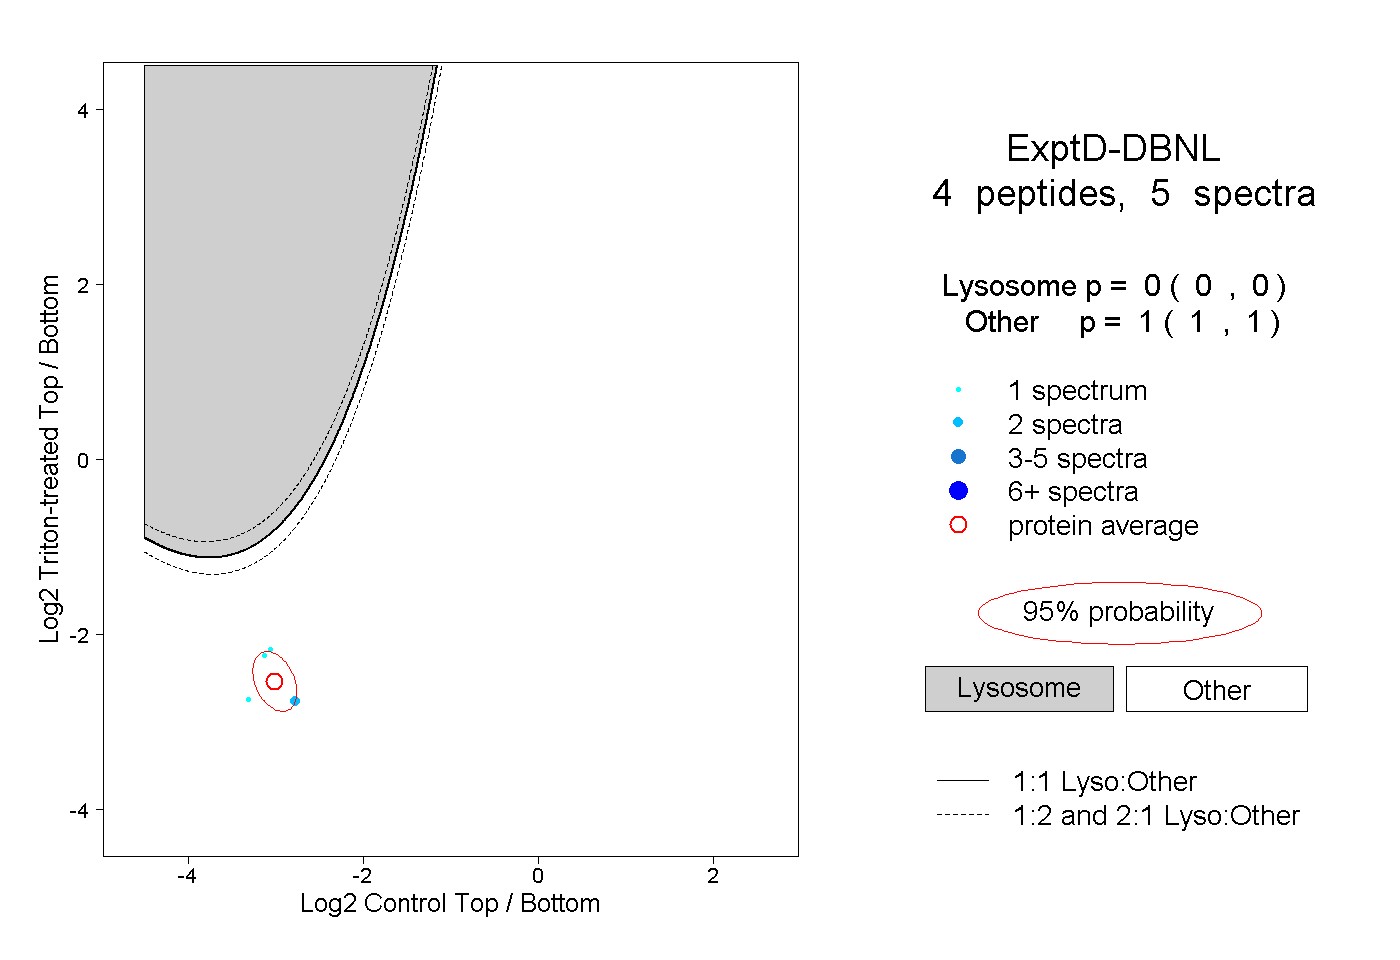
| Expt D |
4
peptides |
5
spectra |
 |
|
0.000
0.000 | 0.000 |
|
|
|
|
|
|
|
1.000
1.000 | 1.000 |