 11
11peptides
spectra
0.000 | 0.000
0.114 | 0.140
0.000 | 0.000
0.026 | 0.066
0.000 | 0.001
0.149 | 0.195
0.638 | 0.658
0.000 | 0.000
| Plot | Mito | Lyso | Perox | ER | Golgi | PM | Cytosol | Nucleus | |||||
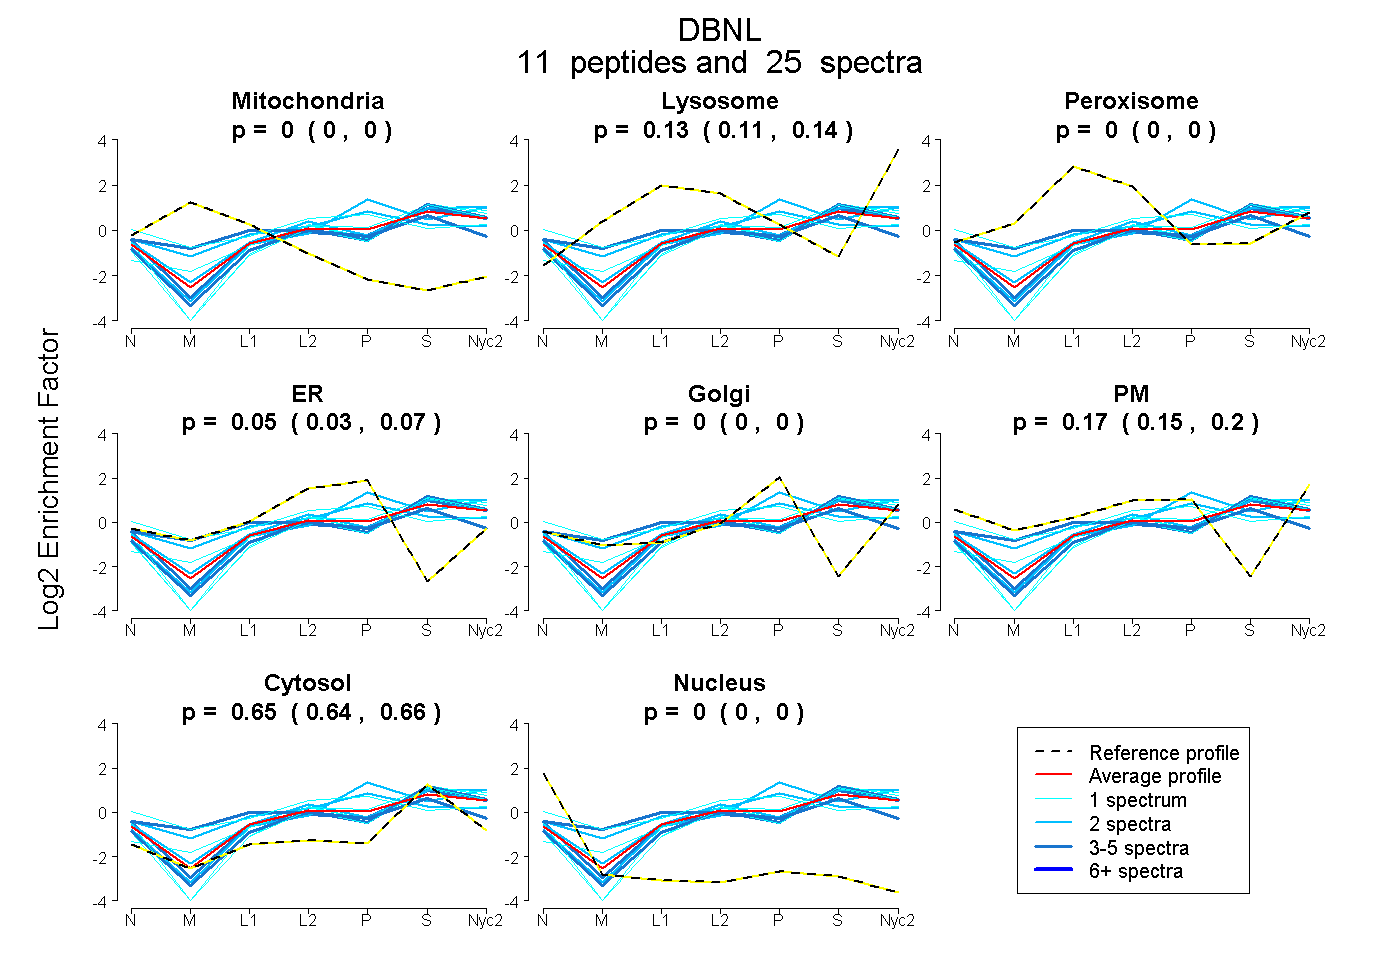
| Expt A |
11 peptides |
25 spectra |
|
0.000 0.000 | 0.000 |
0.128 0.114 | 0.140 |
0.000 0.000 | 0.000 |
0.049 0.026 | 0.066 |
0.000 0.000 | 0.001 |
0.174 0.149 | 0.195 |
0.649 0.638 | 0.658 |
0.000 0.000 | 0.000 |
| 2 spectra, GAHVTINAR | 0.000 | 0.000 | 0.249 | 0.025 | 0.358 | 0.000 | 0.368 | 0.000 | ||
| 1 spectrum, FVLINWTGEGVNDVR | 0.000 | 0.110 | 0.000 | 0.000 | 0.005 | 0.092 | 0.793 | 0.000 | ||
| 5 spectra, TGELEQEVVSR | 0.000 | 0.126 | 0.000 | 0.000 | 0.000 | 0.099 | 0.775 | 0.000 | ||
| 4 spectra, AEEDVEPECIMEK | 0.000 | 0.085 | 0.000 | 0.000 | 0.000 | 0.204 | 0.711 | 0.000 | ||
| 1 spectrum, YQEQHR | 0.000 | 0.000 | 0.136 | 0.166 | 0.000 | 0.326 | 0.372 | 0.000 | ||
| 5 spectra, VMYAFCR | 0.009 | 0.000 | 0.326 | 0.023 | 0.065 | 0.062 | 0.515 | 0.000 | ||
| 2 spectra, NGPALQEAYVR | 0.000 | 0.224 | 0.000 | 0.000 | 0.000 | 0.156 | 0.620 | 0.000 | ||
| 1 spectrum, SPFLQK | 0.000 | 0.114 | 0.000 | 0.114 | 0.034 | 0.000 | 0.738 | 0.000 | ||
| 1 spectrum, VAGTGEGGLEELVEELNSGK | 0.000 | 0.018 | 0.000 | 0.000 | 0.000 | 0.180 | 0.802 | 0.000 | ||
| 1 spectrum, QFTQPEASYGR | 0.000 | 0.332 | 0.000 | 0.000 | 0.000 | 0.000 | 0.668 | 0.000 | ||
| 2 spectra, AMSTTSVSSSQPGK | 0.000 | 0.101 | 0.000 | 0.000 | 0.412 | 0.000 | 0.486 | 0.000 |
| Plot | Mito | Lyso or Perox | ER | Golgi | PM | Cytosol | Nucleus | ||||||
| Expt B |
4 peptides |
7 spectra |
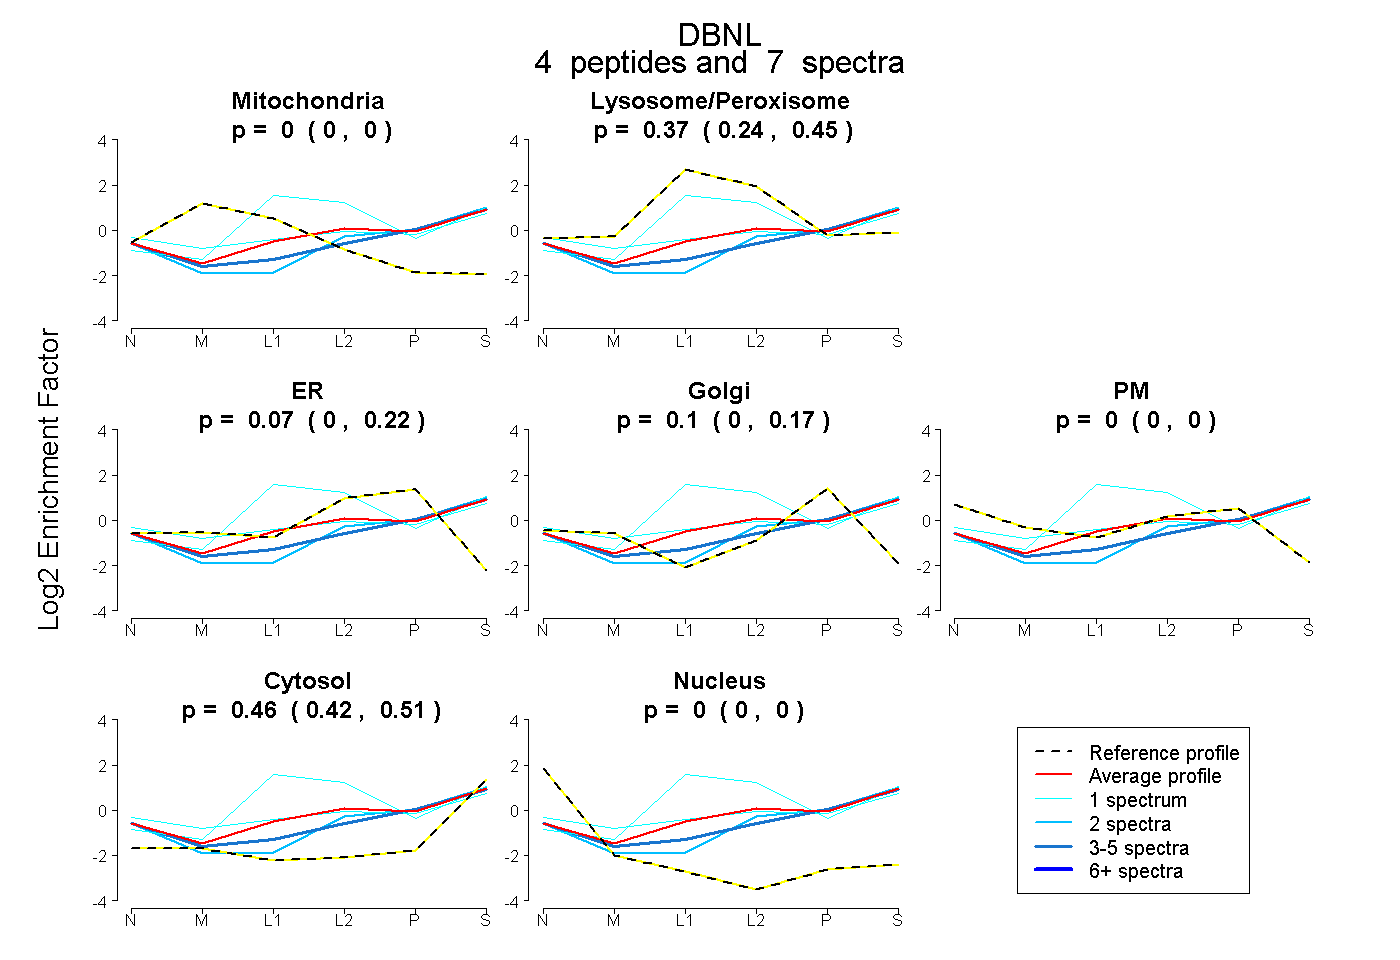 |
0.000 0.000 | 0.000 |
0.371 0.244 | 0.454 |
0.067 0.000 | 0.221 |
0.101 0.000 | 0.169 |
0.000 0.000 | 0.000 |
0.462 0.420 | 0.511 |
0.000 0.000 | 0.000 |
|||
| Plot | Lyso | Other | |||||||||||
| Expt C |
12 peptides |
40 spectra |
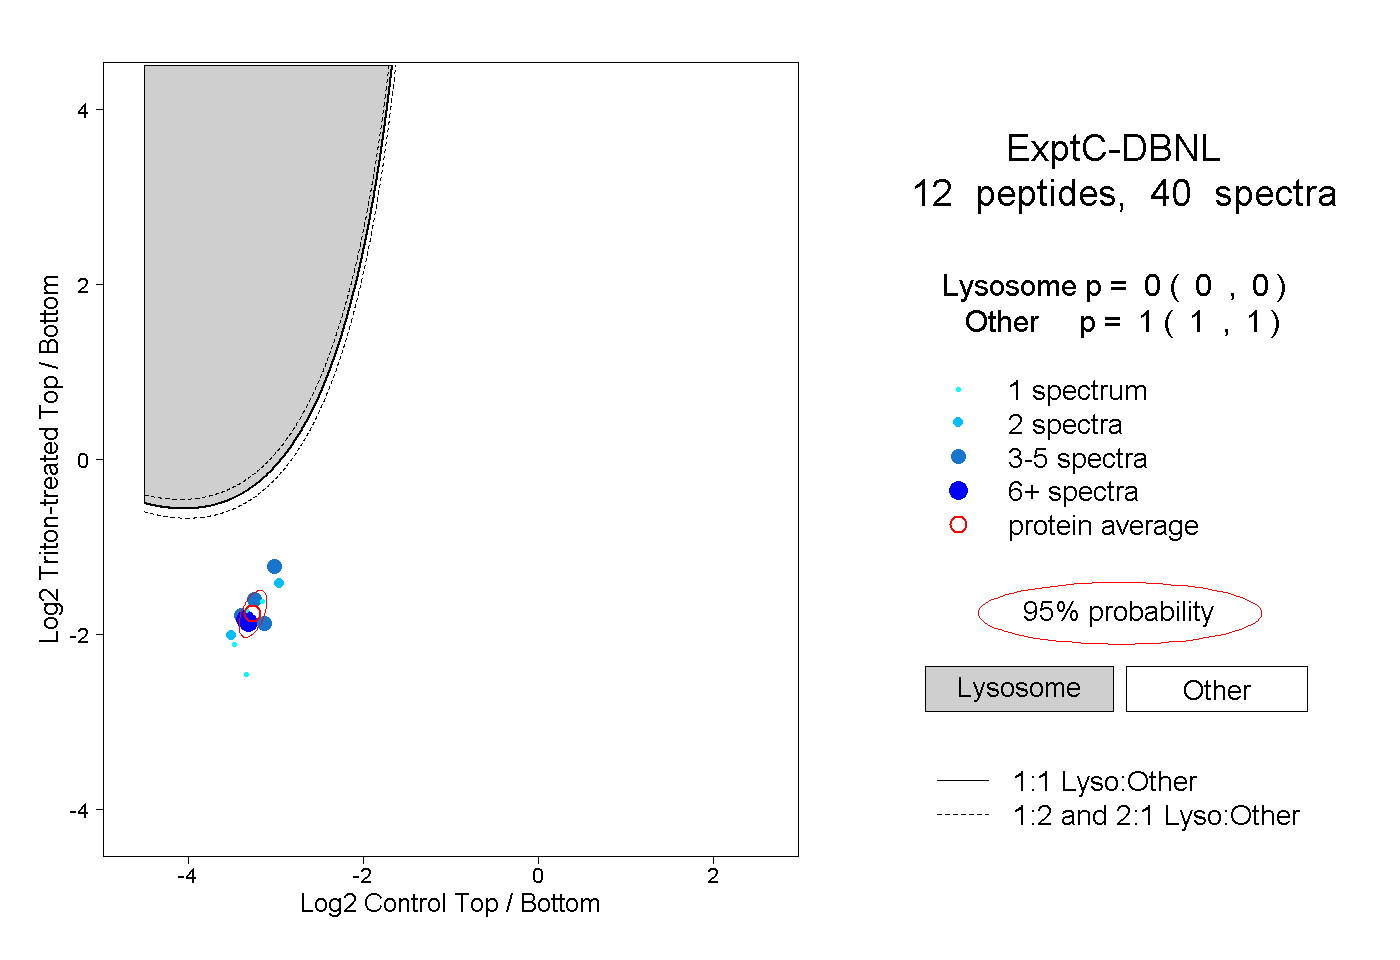 |
0.000 0.000 | 0.000 |
1.000 1.000 | 1.000 |
||||||||
| Plot | Lyso | Other | |||||||||||
| Expt D |
4 peptides |
5 spectra |
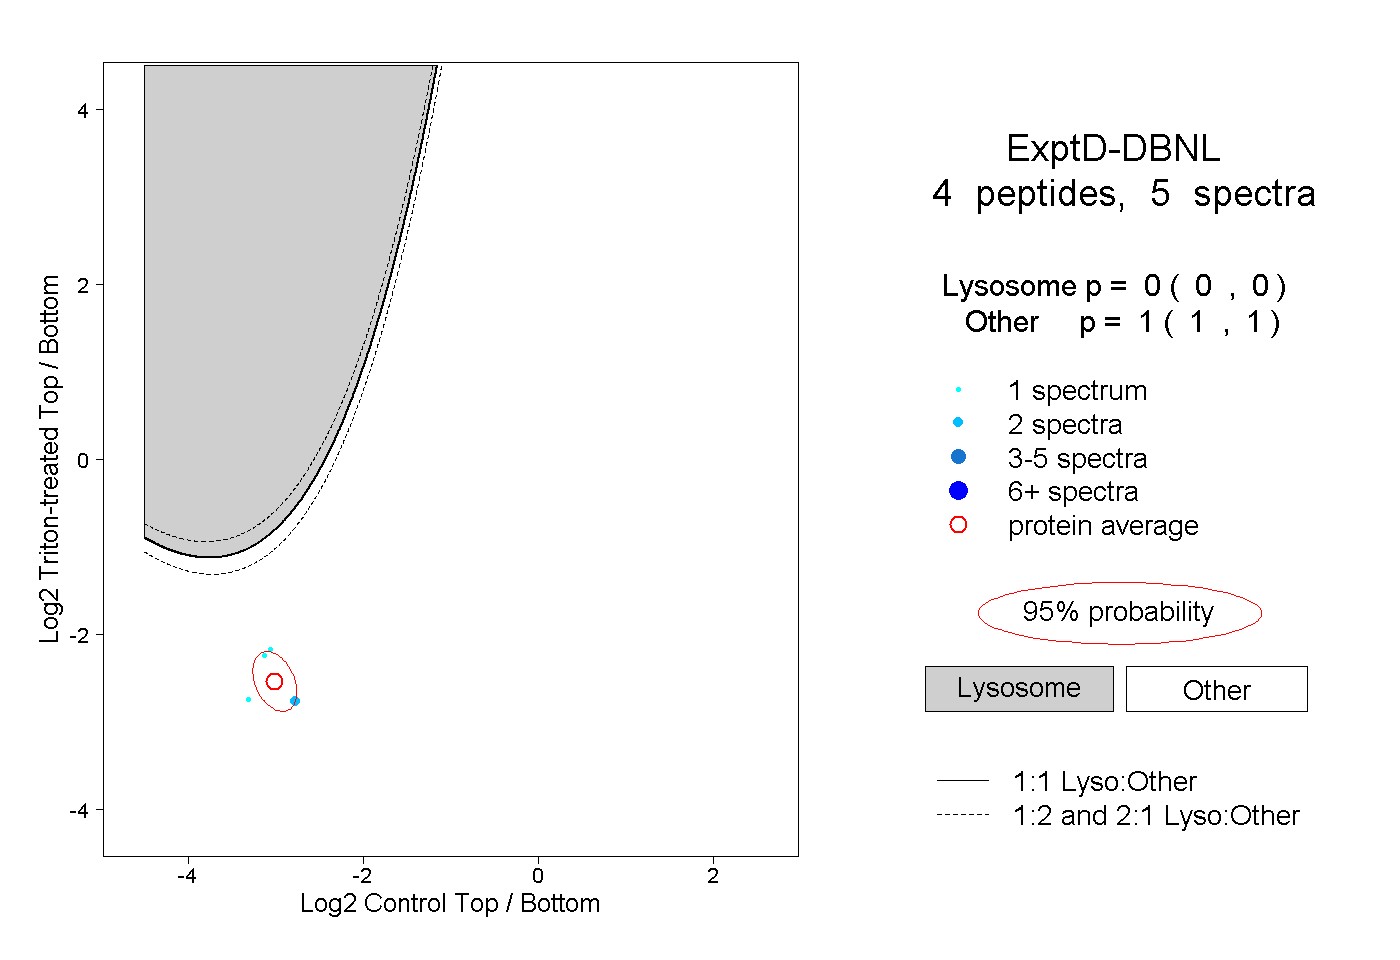 |
0.000 0.000 | 0.000 |
1.000 1.000 | 1.000 |