 12
12peptides
spectra
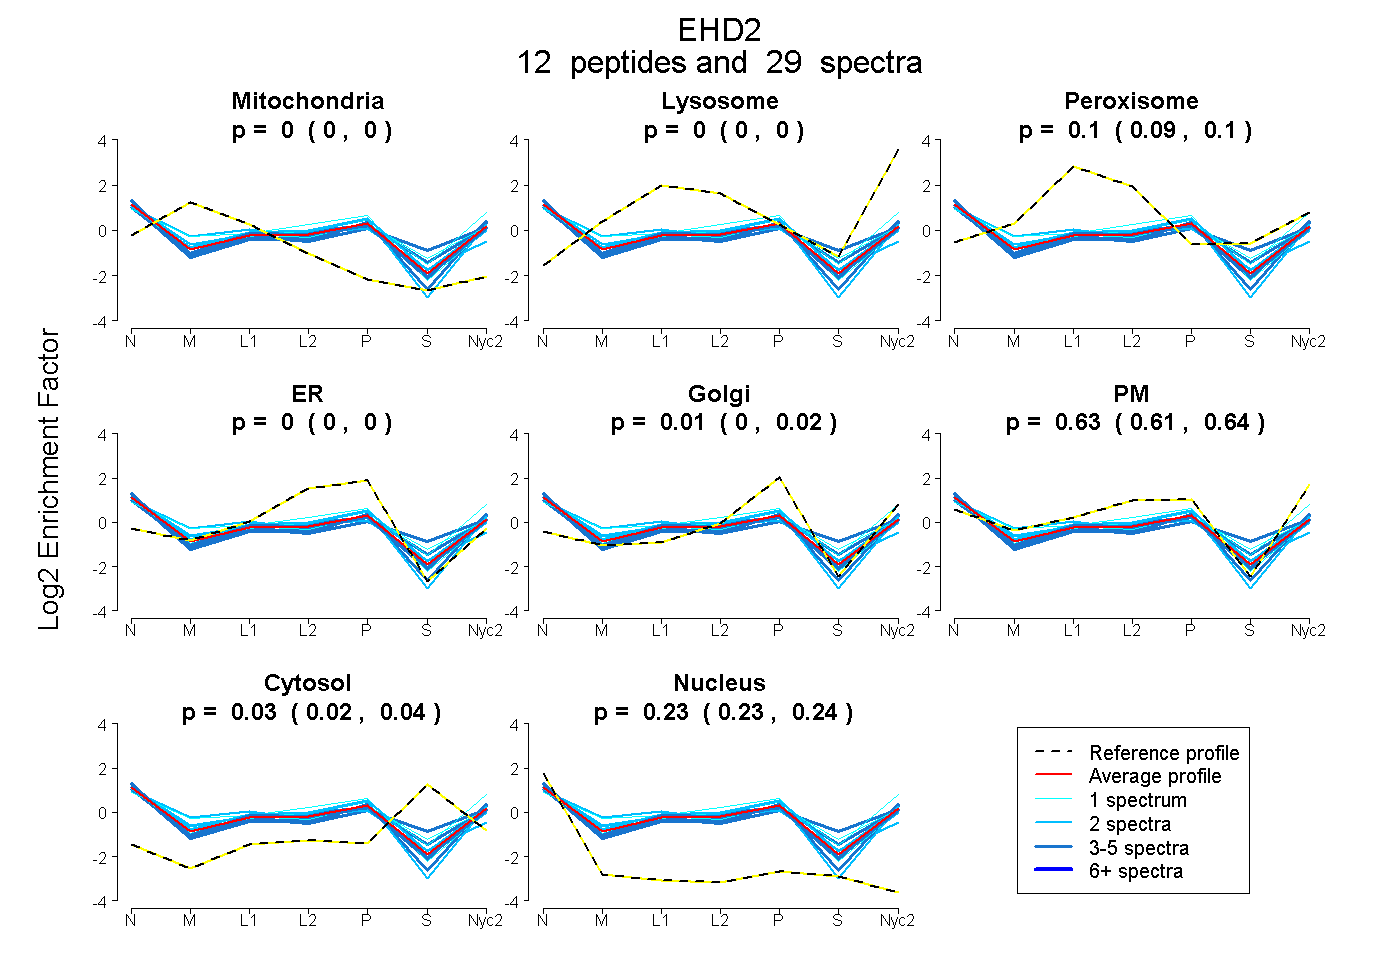
0.000 | 0.000
0.000 | 0.000
0.089 | 0.103
0.000 | 0.000
0.000 | 0.020
0.615 | 0.643
0.017 | 0.042
0.227 | 0.240
4peptides
spectra
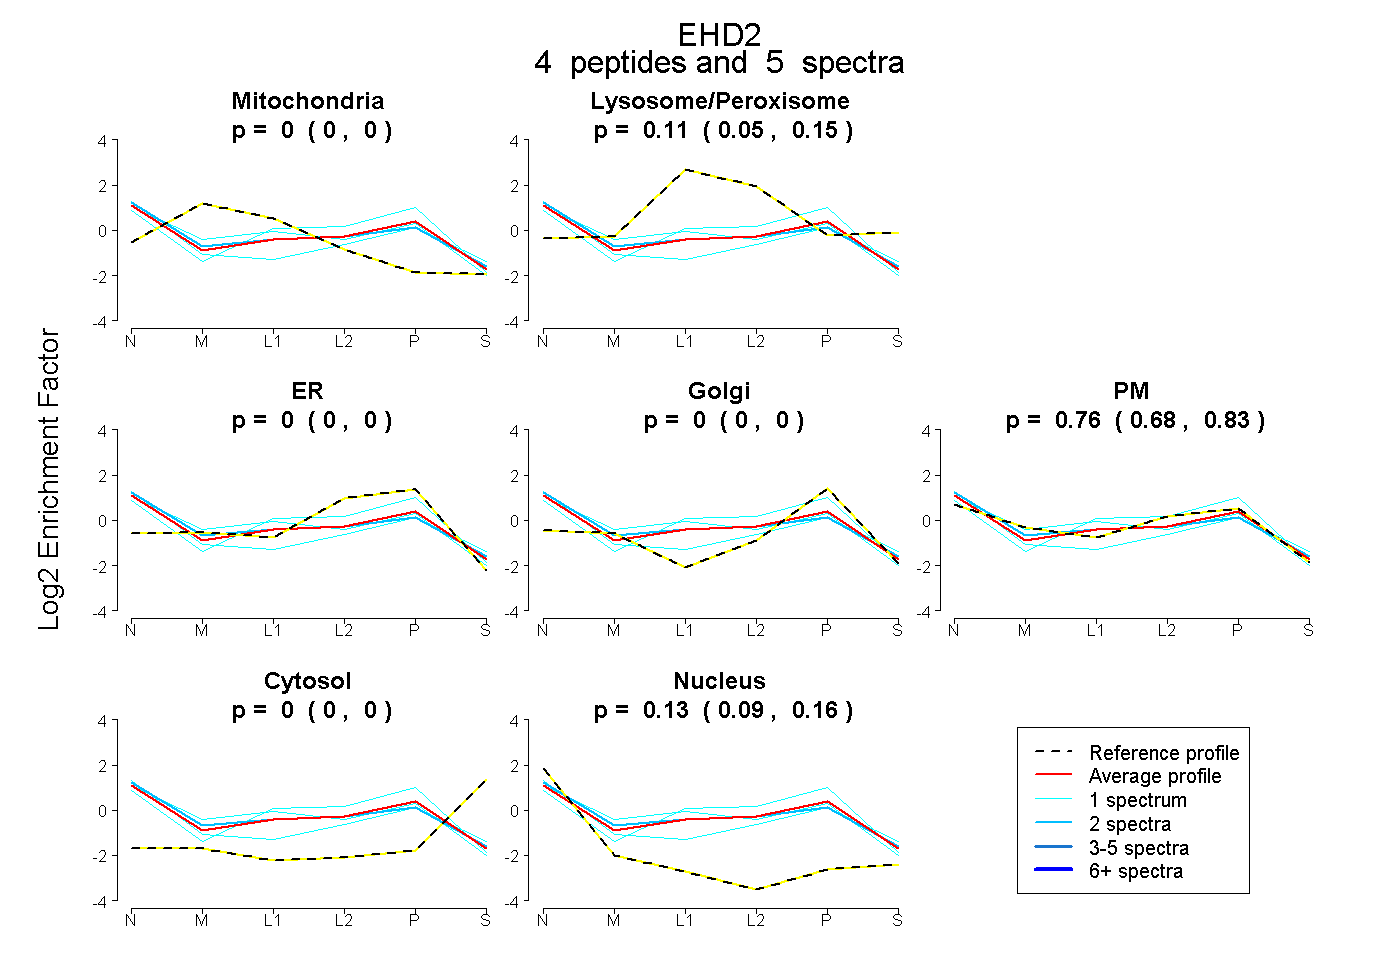
0.000 | 0.000
0.049 | 0.155
0.000 | 0.000
0.000 | 0.000
0.677 | 0.832
0.000 | 0.000
0.092 | 0.161
10peptides
spectra
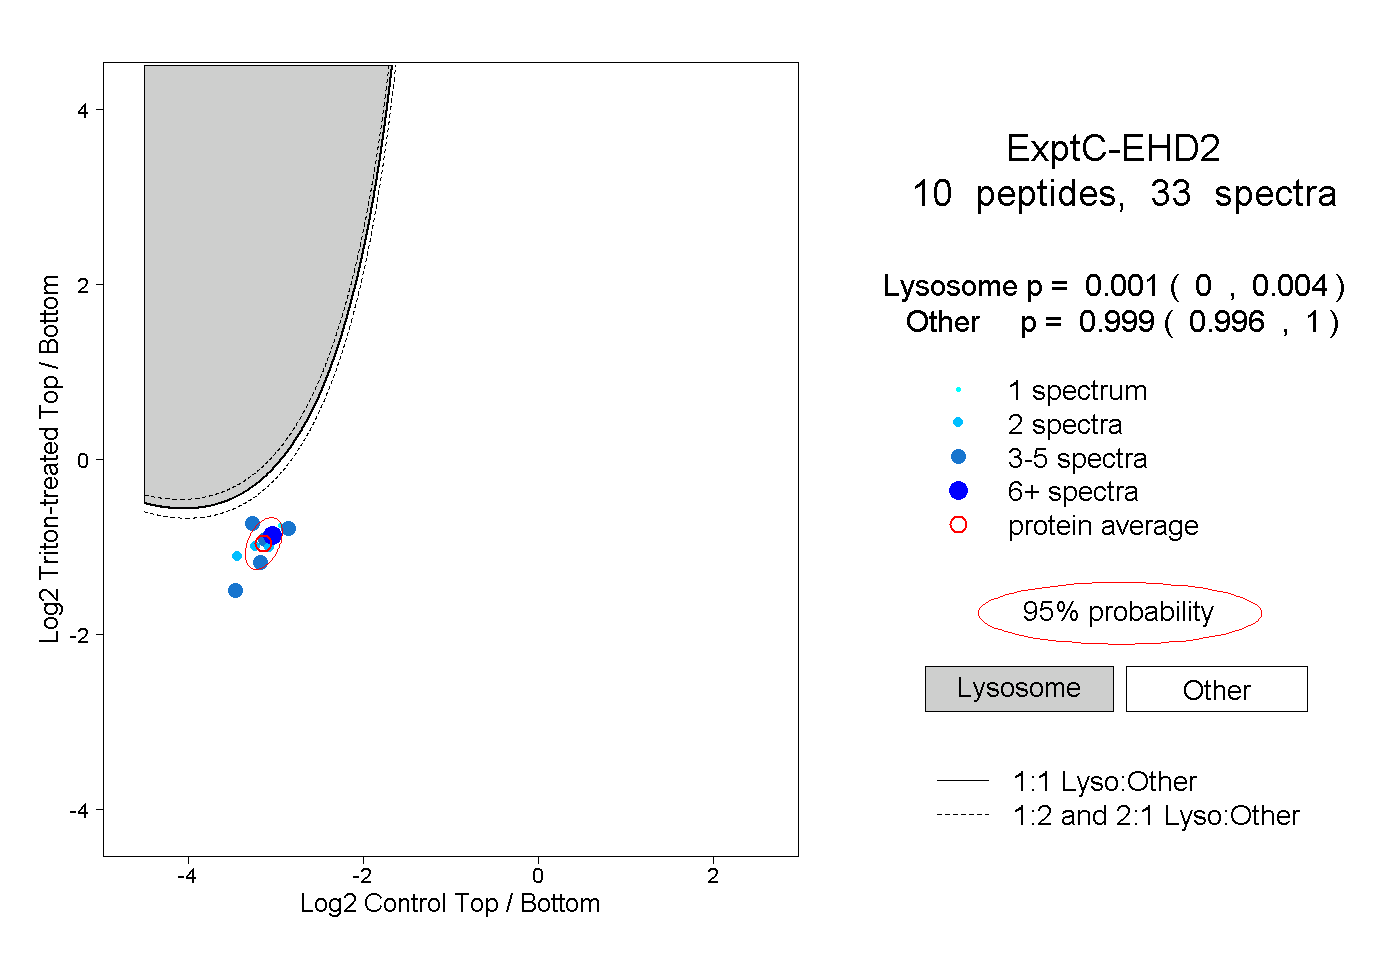
0.000 | 0.004
0.996 | 1.000
1peptide
spectrum
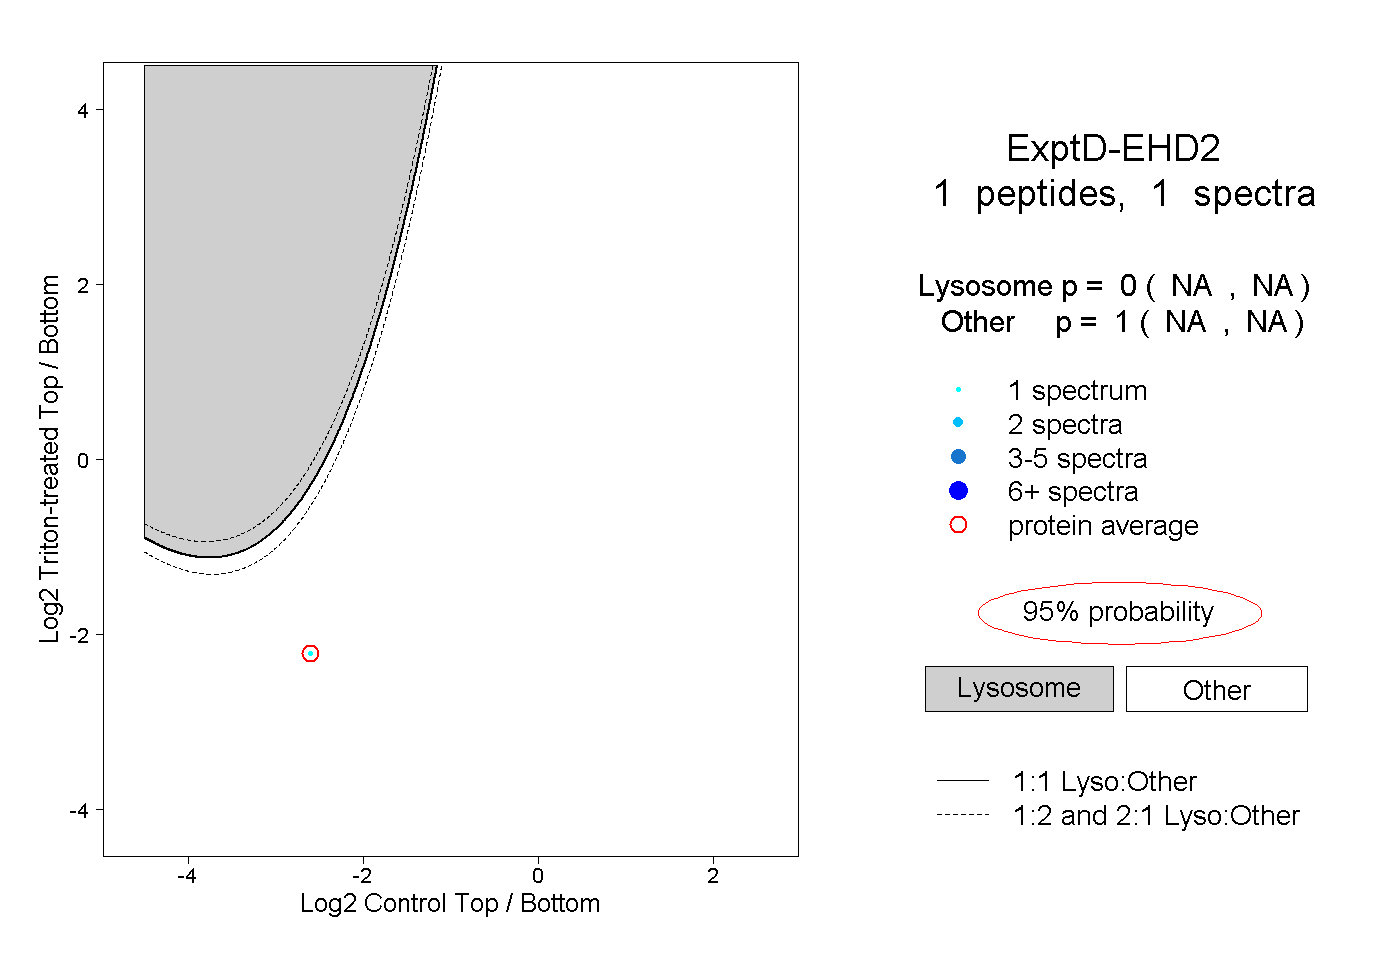
NA | NA
NA | NA