EHD2
[ENSRNOP00000017353]
Main page
| | | Plot |
Mito |
Lyso |
|
Perox |
ER |
Golgi |
PM |
Cytosol |
Nucleus |
|
| Expt A |
 12
12
peptides |
29
spectra |
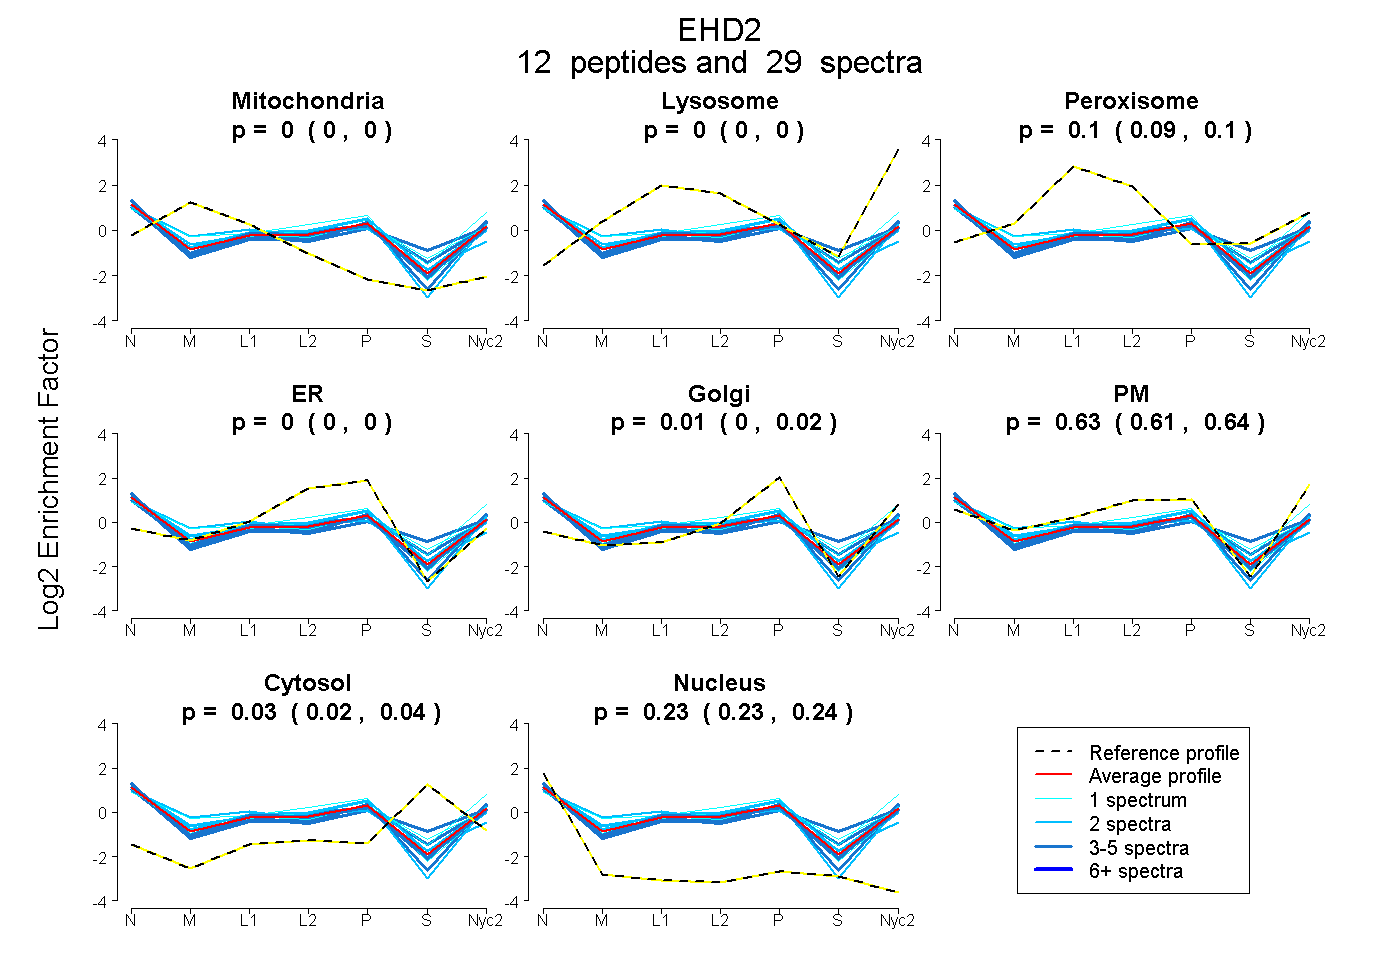 |
0.000
0.000 | 0.000 |
0.000
0.000 | 0.000 |
|
0.096
0.089 | 0.103 |
0.000
0.000 | 0.000 |
0.007
0.000 | 0.020 |
0.633
0.615 | 0.643 |
0.031
0.017 | 0.042 |
0.234
0.227 | 0.240 |
|
| | | Plot |
Mito |
|
Lyso or Perox |
|
ER |
Golgi |
PM |
Cytosol |
Nucleus |
|
| Expt B |
4
peptides |
5
spectra |
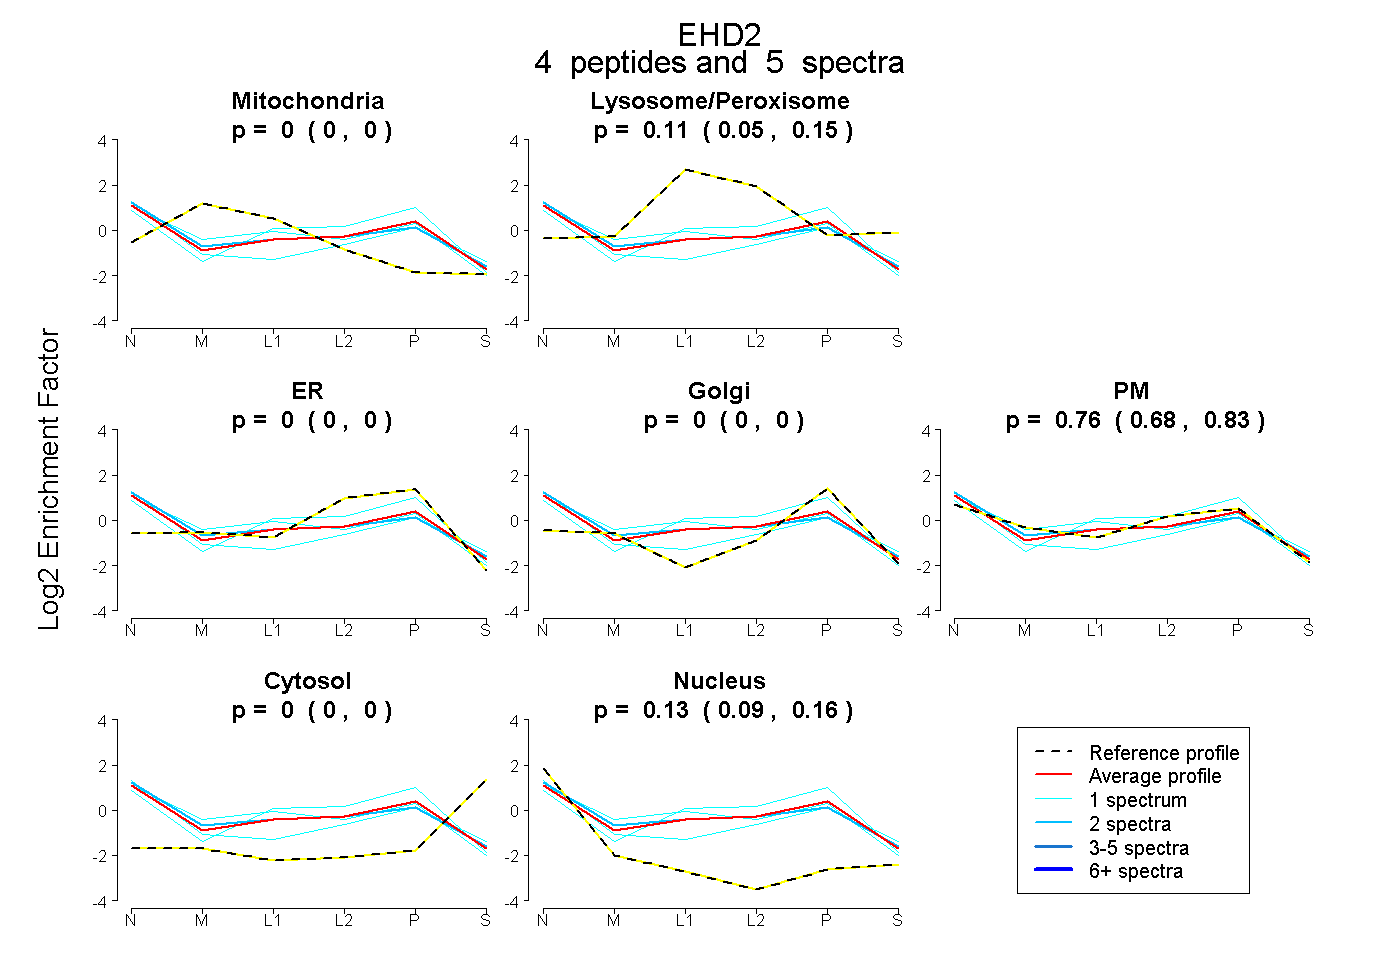 |
0.000
0.000 | 0.000 |
|
0.105
0.049 | 0.155 |
|
0.000
0.000 | 0.000 |
0.000
0.000 | 0.000 |
0.764
0.677 | 0.832 |
0.000
0.000 | 0.000 |
0.131
0.092 | 0.161 |
|
| 2 spectra, VVGTPEVLR |
0.000 |
|
0.148 |
|
0.000 |
0.000 |
0.687 |
0.000 |
0.165 |
|
| 1 spectrum, LNPFGNTFLNR |
0.000 |
|
0.000 |
|
0.000 |
0.000 |
0.757 |
0.054 |
0.189 |
|
| 1 spectrum, LFELEEQDLFR |
0.000 |
|
0.144 |
|
0.189 |
0.000 |
0.603 |
0.000 |
0.064 |
|
| 1 spectrum, LPNSVLGR |
0.026 |
|
0.117 |
|
0.000 |
0.000 |
0.747 |
0.000 |
0.110 |
|
| | | Plot |
|
Lyso |
|
|
|
|
|
|
|
Other |
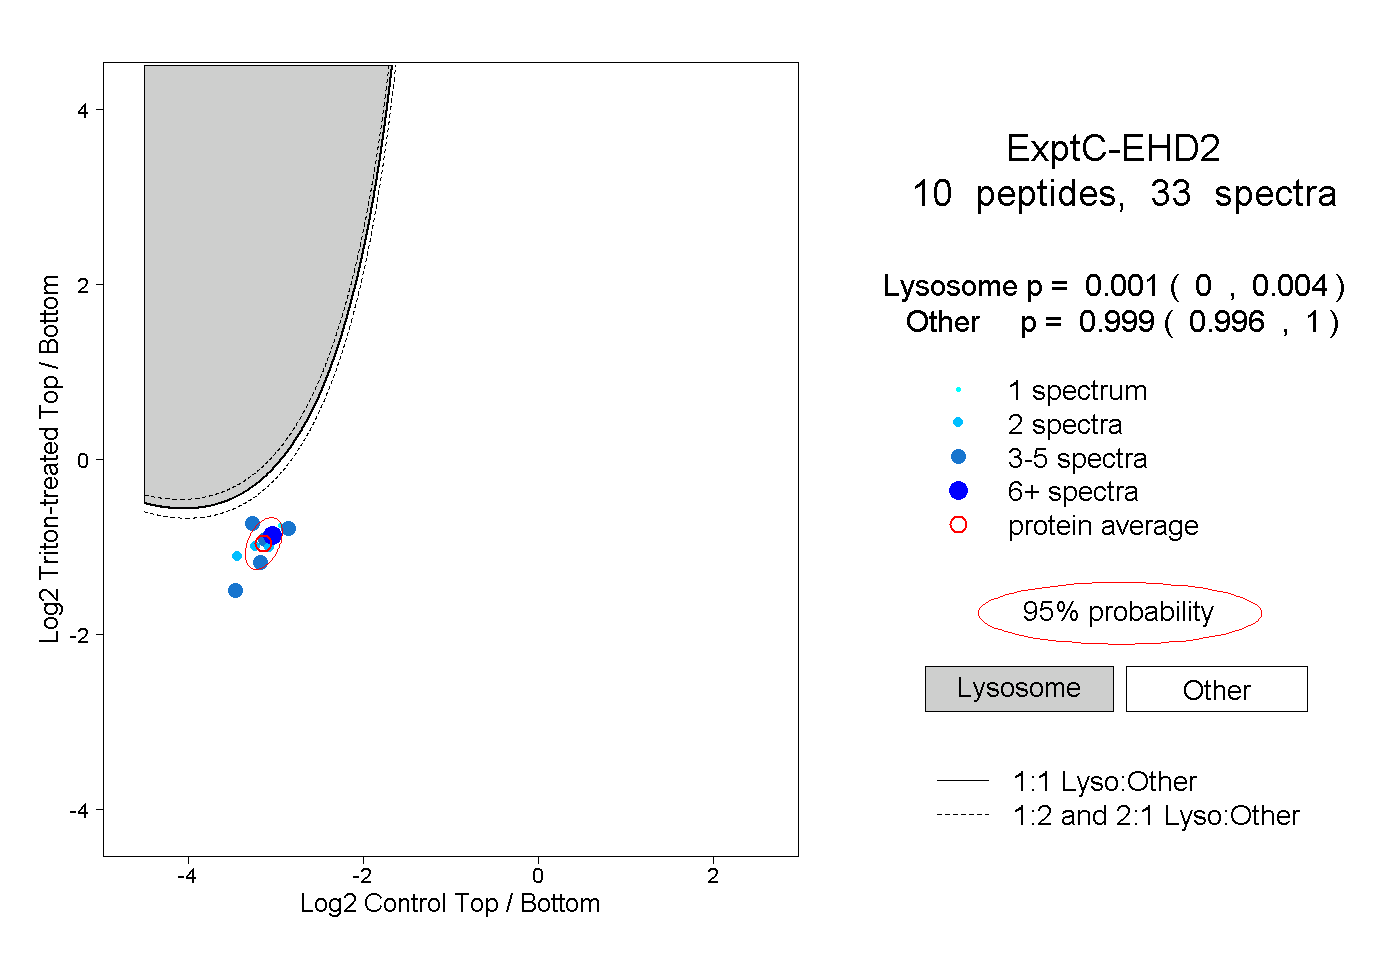
| Expt C |
10
peptides |
33
spectra |
 |
|
0.001
0.000 | 0.004 |
|
|
|
|
|
|
|
0.999
0.996 | 1.000 |
| | | Plot |
|
Lyso |
|
|
|
|
|
|
|
Other |
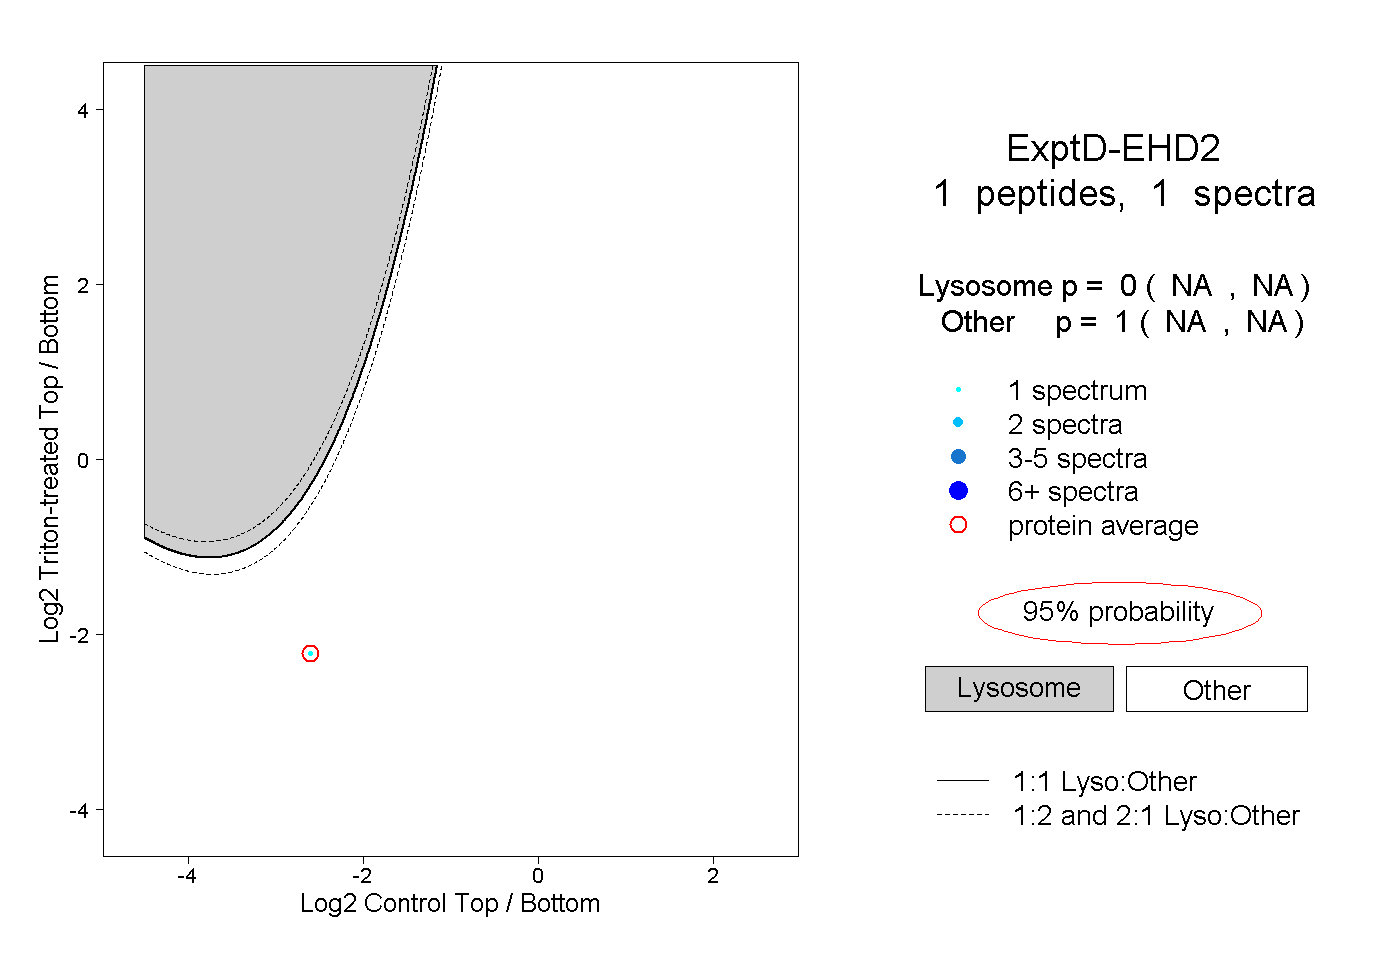
| Expt D |
1
peptide |
1
spectrum |
 |
|
0.000
NA | NA |
|
|
|
|
|
|
|
1.000
NA | NA |