 12
12peptides
spectra
0.000 | 0.000
0.000 | 0.000
0.089 | 0.103
0.000 | 0.000
0.000 | 0.020
0.615 | 0.643
0.017 | 0.042
0.227 | 0.240
| Plot | Mito | Lyso | Perox | ER | Golgi | PM | Cytosol | Nucleus | |||||
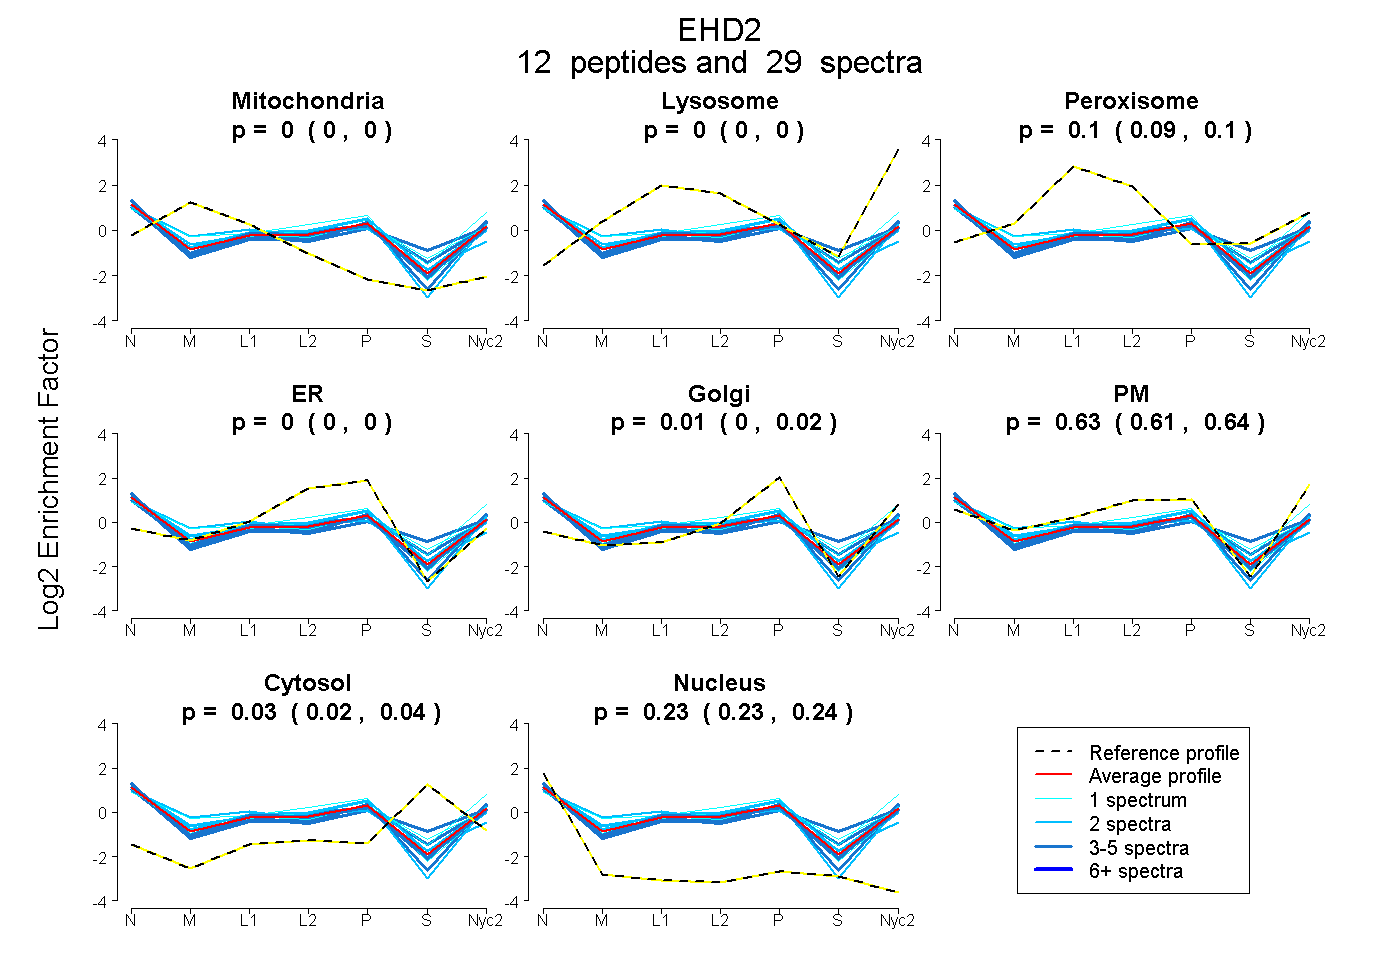
| Expt A |
12 peptides |
29 spectra |
|
0.000 0.000 | 0.000 |
0.000 0.000 | 0.000 |
0.096 0.089 | 0.103 |
0.000 0.000 | 0.000 |
0.007 0.000 | 0.020 |
0.633 0.615 | 0.643 |
0.031 0.017 | 0.042 |
0.234 0.227 | 0.240 |
| 2 spectra, TWMVGTK | 0.000 | 0.000 | 0.138 | 0.009 | 0.083 | 0.550 | 0.019 | 0.201 | ||
| 4 spectra, VVGTPEVLR | 0.000 | 0.000 | 0.111 | 0.000 | 0.000 | 0.624 | 0.000 | 0.265 | ||
| 4 spectra, LNPFGNTFLNR | 0.000 | 0.000 | 0.000 | 0.000 | 0.000 | 0.736 | 0.000 | 0.264 | ||
| 2 spectra, ADMVETQQLMR | 0.149 | 0.000 | 0.086 | 0.000 | 0.046 | 0.555 | 0.000 | 0.165 | ||
| 2 spectra, LEGHGLPTNLPR | 0.004 | 0.000 | 0.216 | 0.098 | 0.000 | 0.395 | 0.000 | 0.287 | ||
| 1 spectrum, TVTSSLK | 0.000 | 0.000 | 0.013 | 0.000 | 0.000 | 0.745 | 0.137 | 0.106 | ||
| 1 spectrum, MQELLMAHDFTK | 0.119 | 0.000 | 0.016 | 0.180 | 0.000 | 0.561 | 0.000 | 0.123 | ||
| 1 spectrum, LSDVDR | 0.000 | 0.000 | 0.089 | 0.000 | 0.000 | 0.578 | 0.154 | 0.179 | ||
| 4 spectra, GYDFPAVLR | 0.000 | 0.000 | 0.096 | 0.000 | 0.000 | 0.510 | 0.231 | 0.163 | ||
| 3 spectra, LFELEEQDLFR | 0.000 | 0.000 | 0.040 | 0.000 | 0.000 | 0.707 | 0.014 | 0.239 | ||
| 2 spectra, LPNSVLGR | 0.048 | 0.000 | 0.000 | 0.052 | 0.000 | 0.707 | 0.000 | 0.192 | ||
| 3 spectra, LMPLLR | 0.000 | 0.000 | 0.029 | 0.000 | 0.000 | 0.621 | 0.155 | 0.195 |
| Plot | Mito | Lyso or Perox | ER | Golgi | PM | Cytosol | Nucleus | ||||||
| Expt B |
4 peptides |
5 spectra |
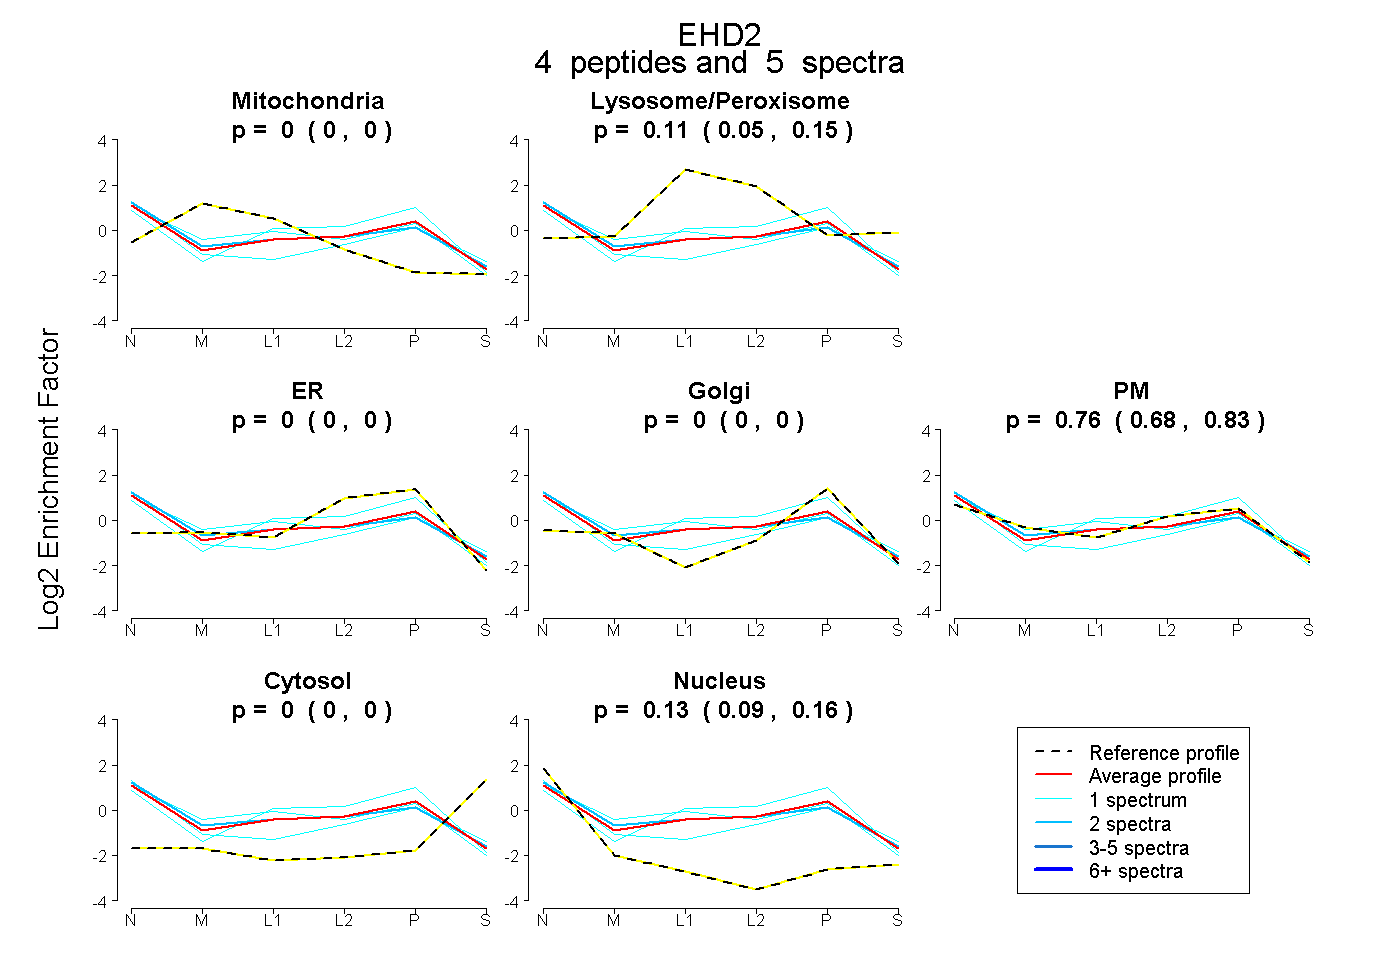 |
0.000 0.000 | 0.000 |
0.105 0.049 | 0.155 |
0.000 0.000 | 0.000 |
0.000 0.000 | 0.000 |
0.764 0.677 | 0.832 |
0.000 0.000 | 0.000 |
0.131 0.092 | 0.161 |
|||
| Plot | Lyso | Other | |||||||||||
| Expt C |
10 peptides |
33 spectra |
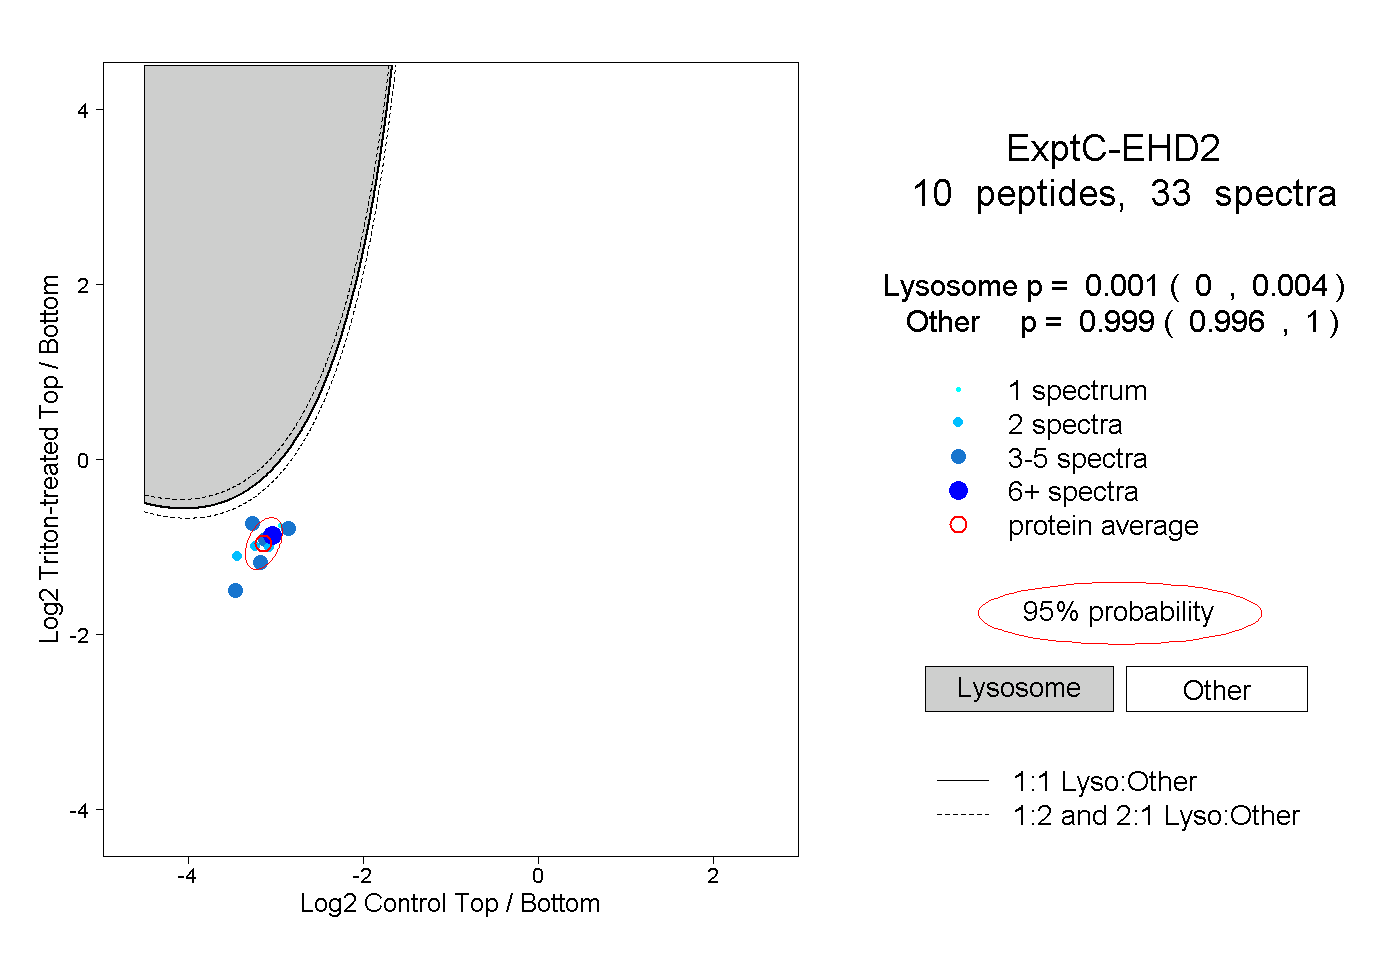 |
0.001 0.000 | 0.004 |
0.999 0.996 | 1.000 |
||||||||
| Plot | Lyso | Other | |||||||||||
| Expt D |
1 peptide |
1 spectrum |
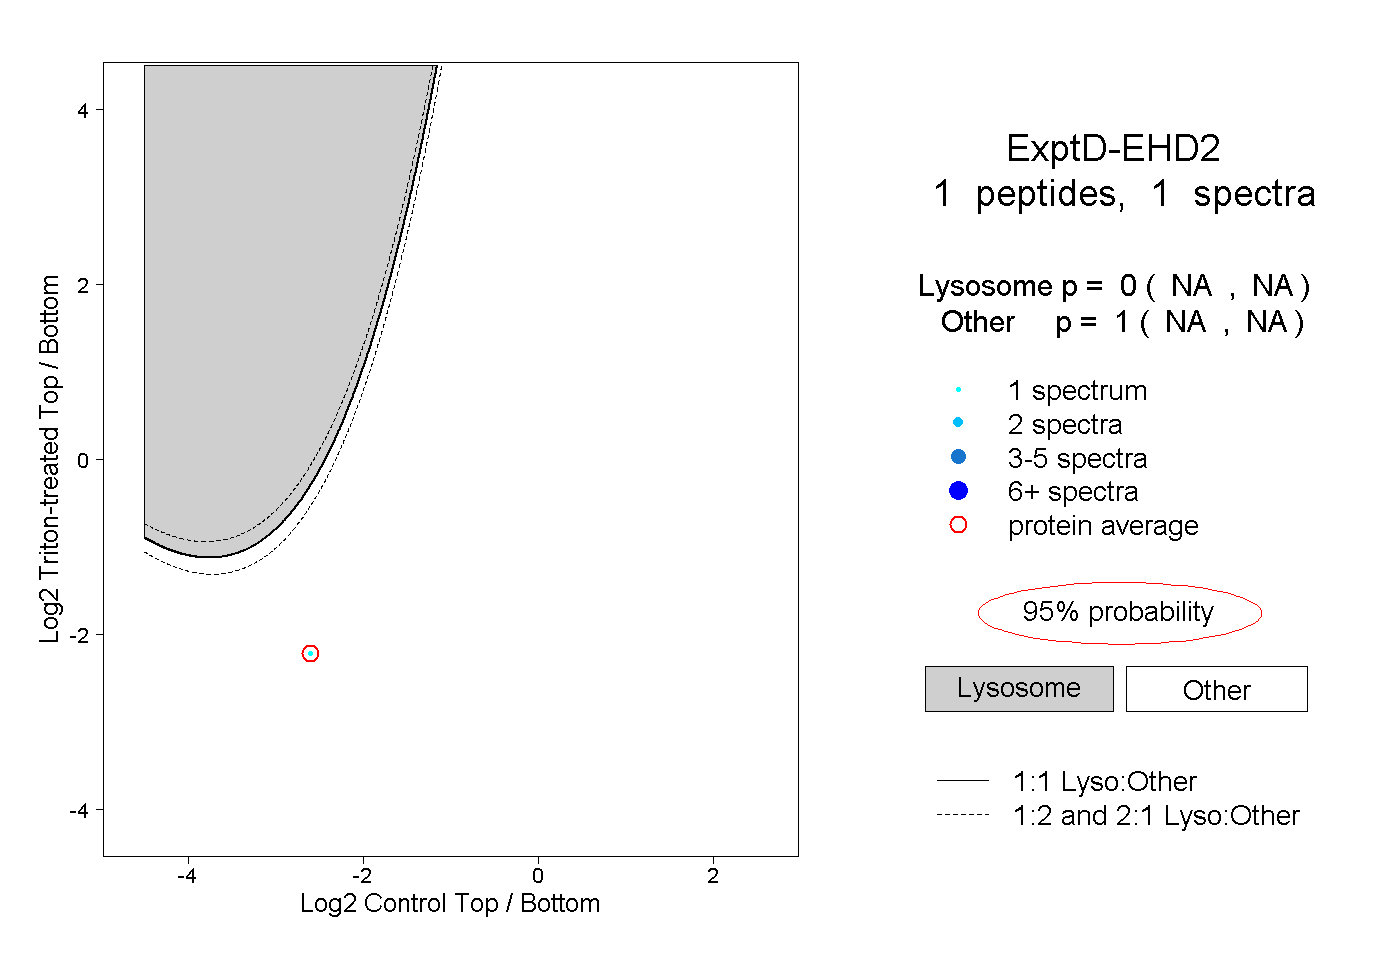 |
0.000 NA | NA |
1.000 NA | NA |