 10
10peptides
spectra
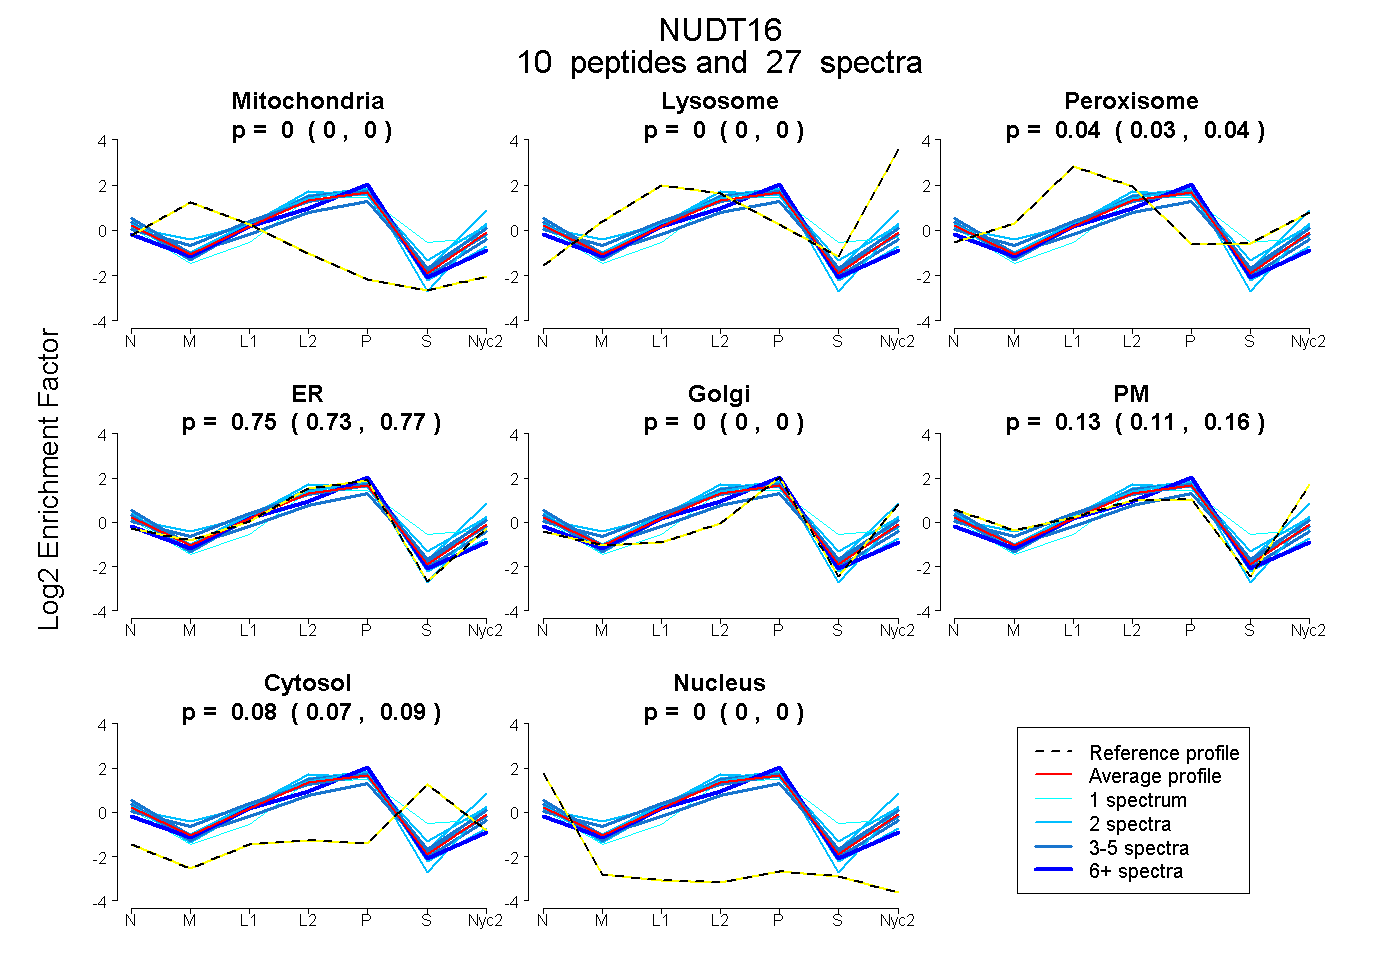
0.000 | 0.000
0.000 | 0.000
0.026 | 0.042
0.728 | 0.769
0.000 | 0.000
0.108 | 0.156
0.075 | 0.086
0.000 | 0.000
6peptides
spectra
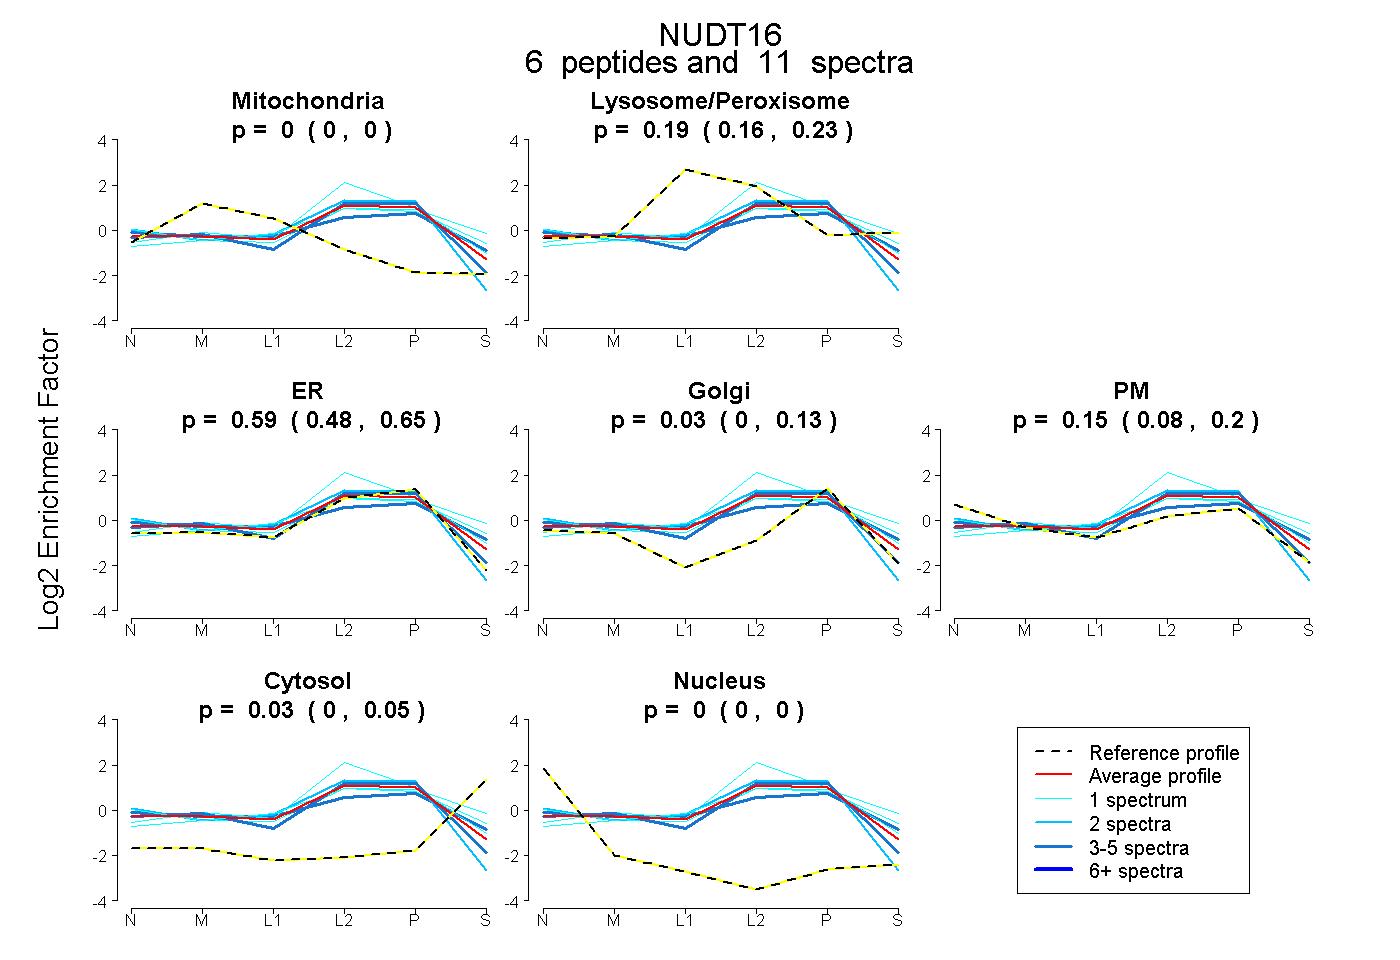
0.000 | 0.000
0.158 | 0.234
0.480 | 0.652
0.000 | 0.133
0.080 | 0.200
0.001 | 0.046
0.000 | 0.000
9peptides
spectra
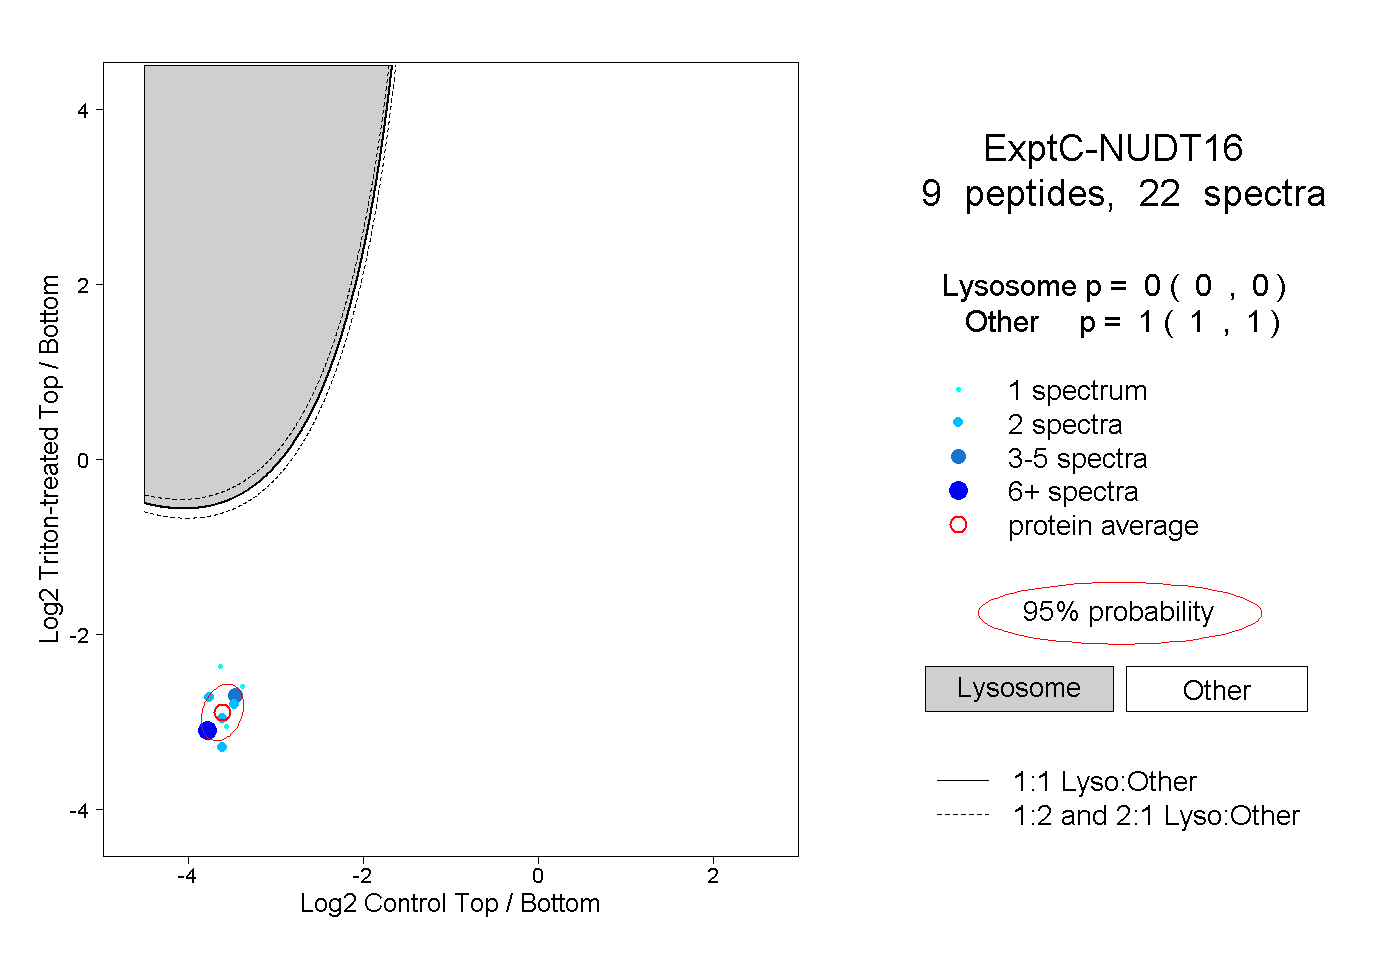
0.000 | 0.000
1.000 | 1.000
1peptide
spectrum
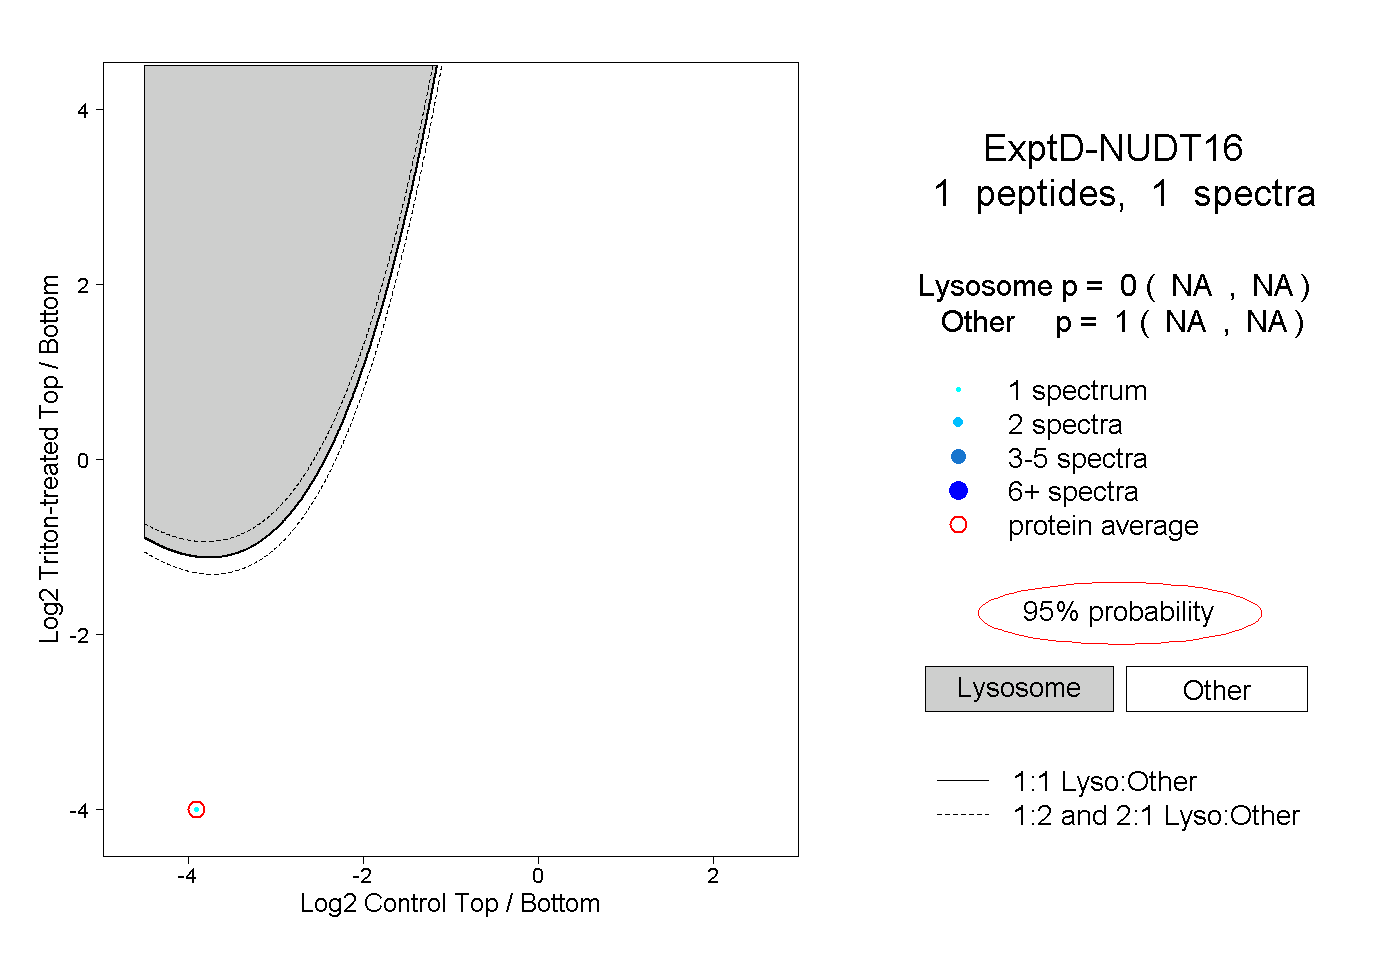
NA | NA
NA | NA