 10
10peptides
spectra
0.000 | 0.000
0.000 | 0.000
0.026 | 0.042
0.728 | 0.769
0.000 | 0.000
0.108 | 0.156
0.075 | 0.086
0.000 | 0.000
| Plot | Mito | Lyso | Perox | ER | Golgi | PM | Cytosol | Nucleus | |||||
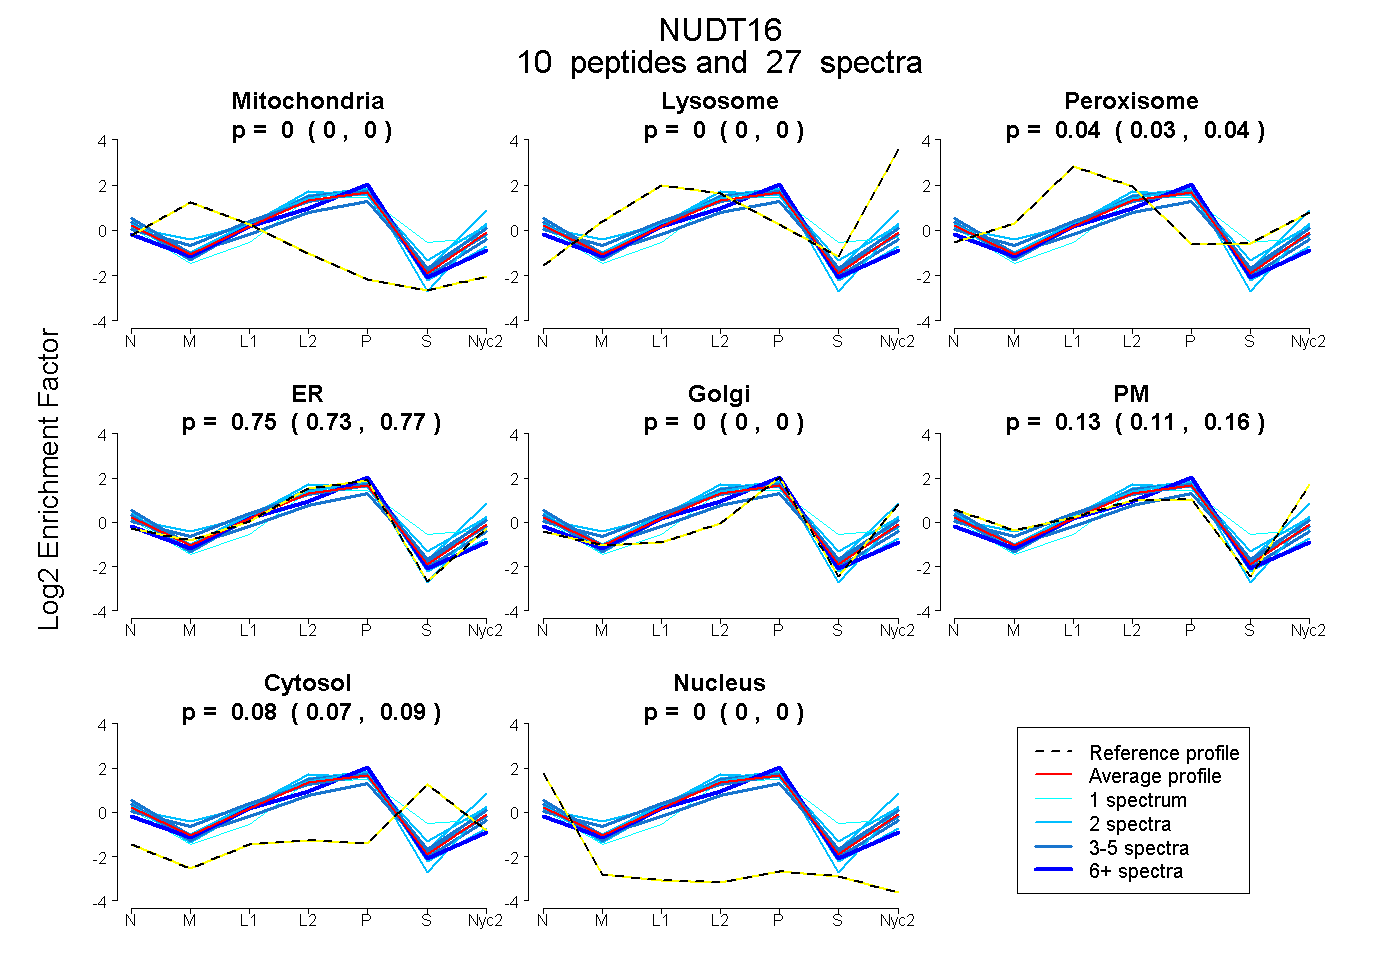
| Expt A |
10 peptides |
27 spectra |
|
0.000 0.000 | 0.000 |
0.000 0.000 | 0.000 |
0.035 0.026 | 0.042 |
0.750 0.728 | 0.769 |
0.000 0.000 | 0.000 |
0.134 0.108 | 0.156 |
0.081 0.075 | 0.086 |
0.000 0.000 | 0.000 |
| 2 spectra, FAVLMQMR | 0.000 | 0.000 | 0.128 | 0.645 | 0.000 | 0.227 | 0.000 | 0.000 | ||
| 2 spectra, EQLLEALR | 0.000 | 0.000 | 0.012 | 0.928 | 0.000 | 0.000 | 0.021 | 0.040 | ||
| 4 spectra, IAARPR | 0.000 | 0.000 | 0.035 | 0.875 | 0.000 | 0.018 | 0.051 | 0.021 | ||
| 2 spectra, LTLEQLQAVEAR | 0.000 | 0.000 | 0.000 | 0.745 | 0.000 | 0.255 | 0.000 | 0.000 | ||
| 1 spectrum, DHGLEVLGLVR | 0.000 | 0.000 | 0.017 | 0.687 | 0.000 | 0.013 | 0.283 | 0.000 | ||
| 2 spectra, DGEGGLPAFLENSFIGAAR | 0.000 | 0.000 | 0.048 | 0.439 | 0.000 | 0.459 | 0.054 | 0.000 | ||
| 6 spectra, VPLYIMR | 0.000 | 0.000 | 0.000 | 0.893 | 0.000 | 0.000 | 0.078 | 0.029 | ||
| 2 spectra, EELGDAVSAFR | 0.000 | 0.000 | 0.114 | 0.587 | 0.000 | 0.191 | 0.109 | 0.000 | ||
| 3 spectra, SDYQSSR | 0.000 | 0.000 | 0.003 | 0.548 | 0.000 | 0.273 | 0.104 | 0.072 | ||
| 3 spectra, VVAHFYAK | 0.000 | 0.000 | 0.164 | 0.616 | 0.108 | 0.072 | 0.040 | 0.000 |
| Plot | Mito | Lyso or Perox | ER | Golgi | PM | Cytosol | Nucleus | ||||||
| Expt B |
6 peptides |
11 spectra |
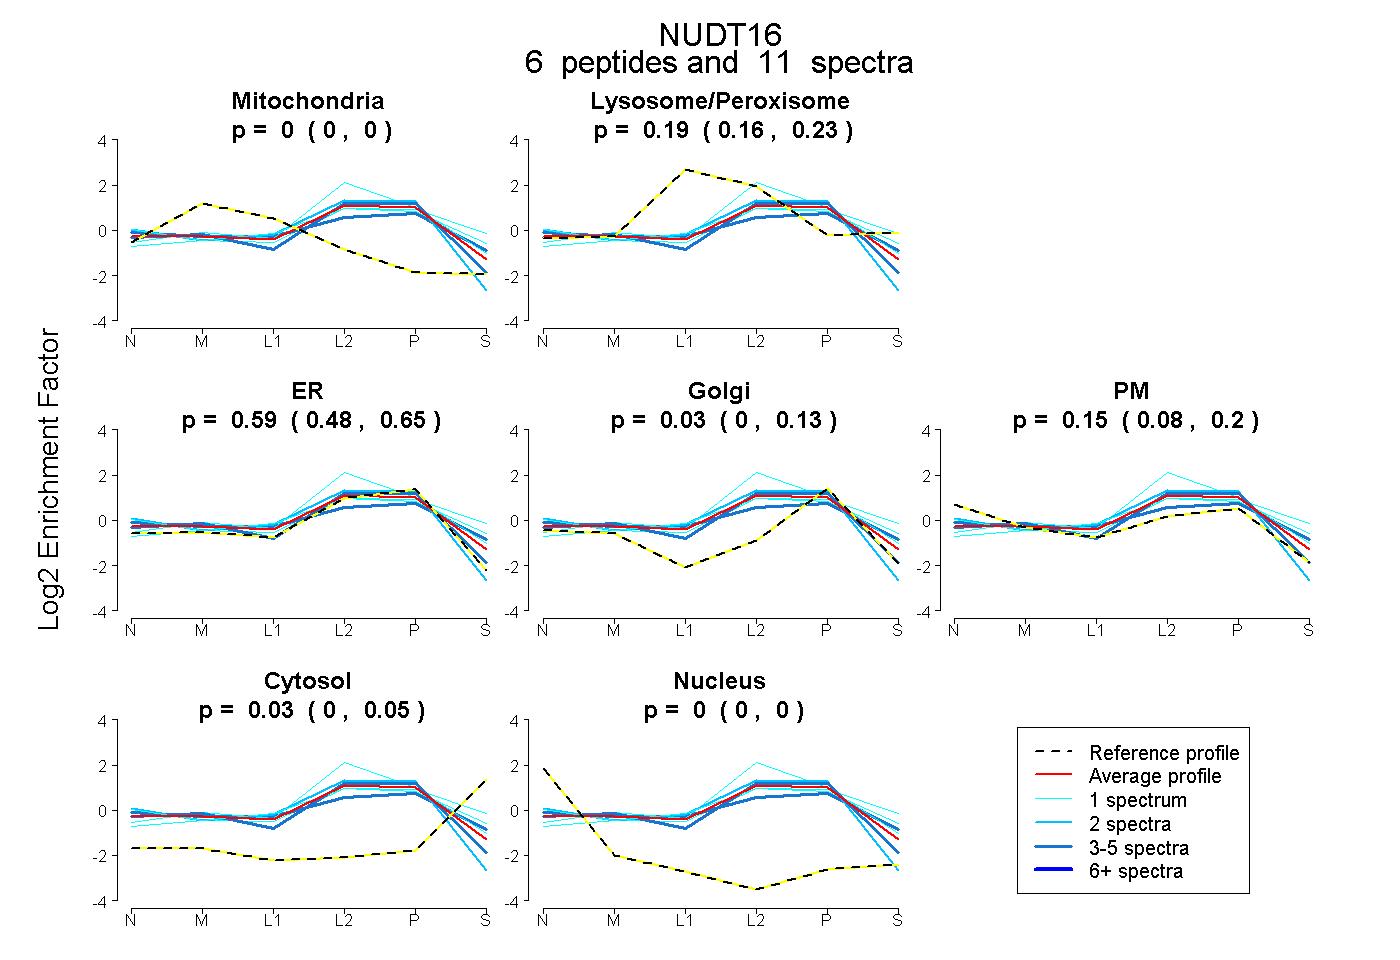 |
0.000 0.000 | 0.000 |
0.192 0.158 | 0.234 |
0.592 0.480 | 0.652 |
0.032 0.000 | 0.133 |
0.154 0.080 | 0.200 |
0.030 0.001 | 0.046 |
0.000 0.000 | 0.000 |
|||
| Plot | Lyso | Other | |||||||||||
| Expt C |
9 peptides |
22 spectra |
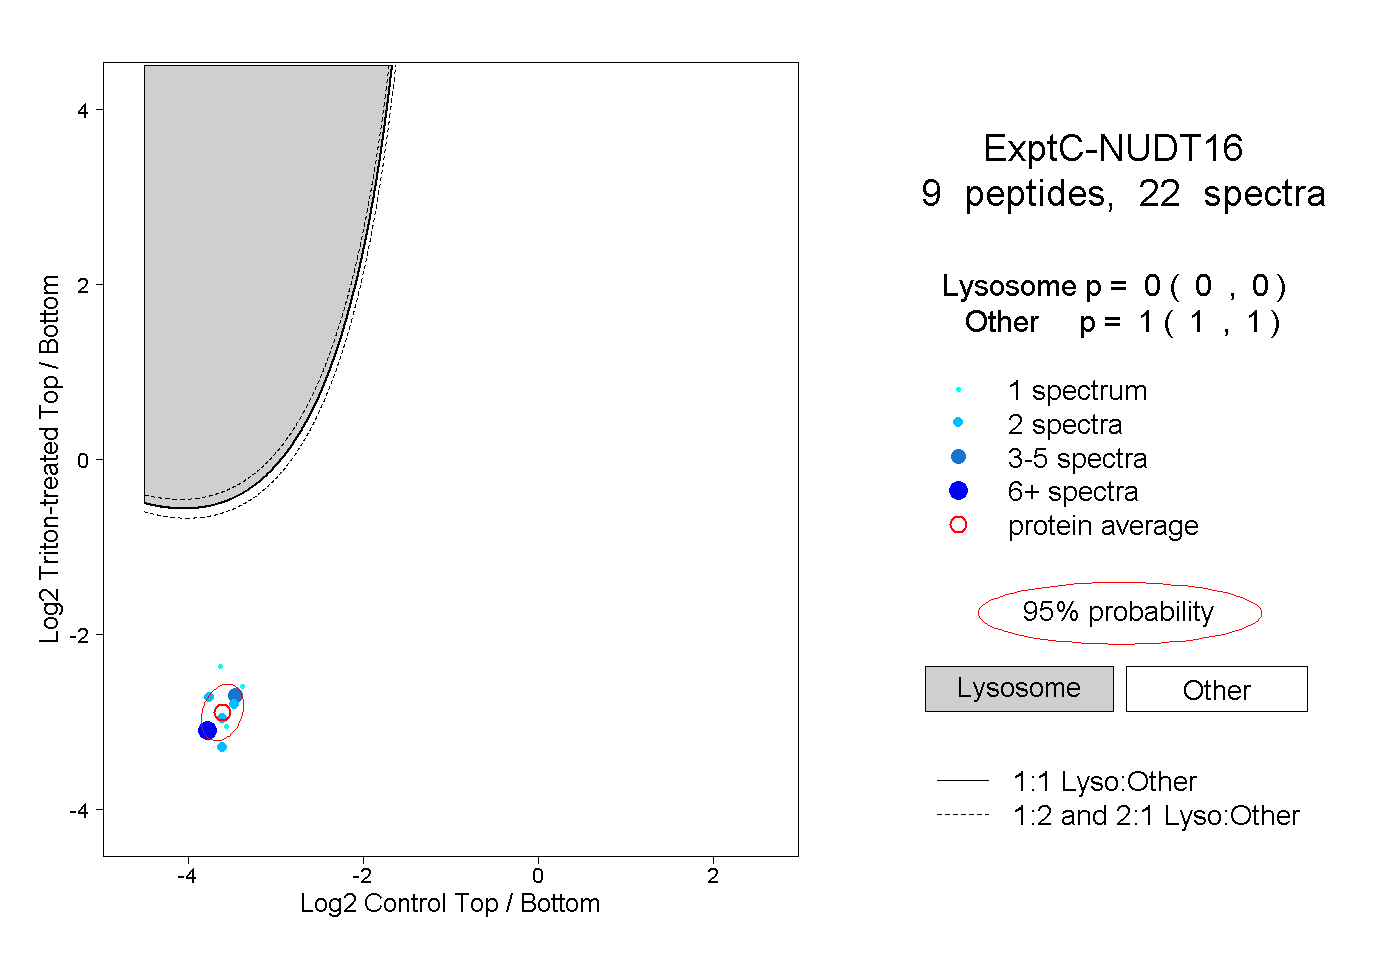 |
0.000 0.000 | 0.000 |
1.000 1.000 | 1.000 |
||||||||
| Plot | Lyso | Other | |||||||||||
| Expt D |
1 peptide |
1 spectrum |
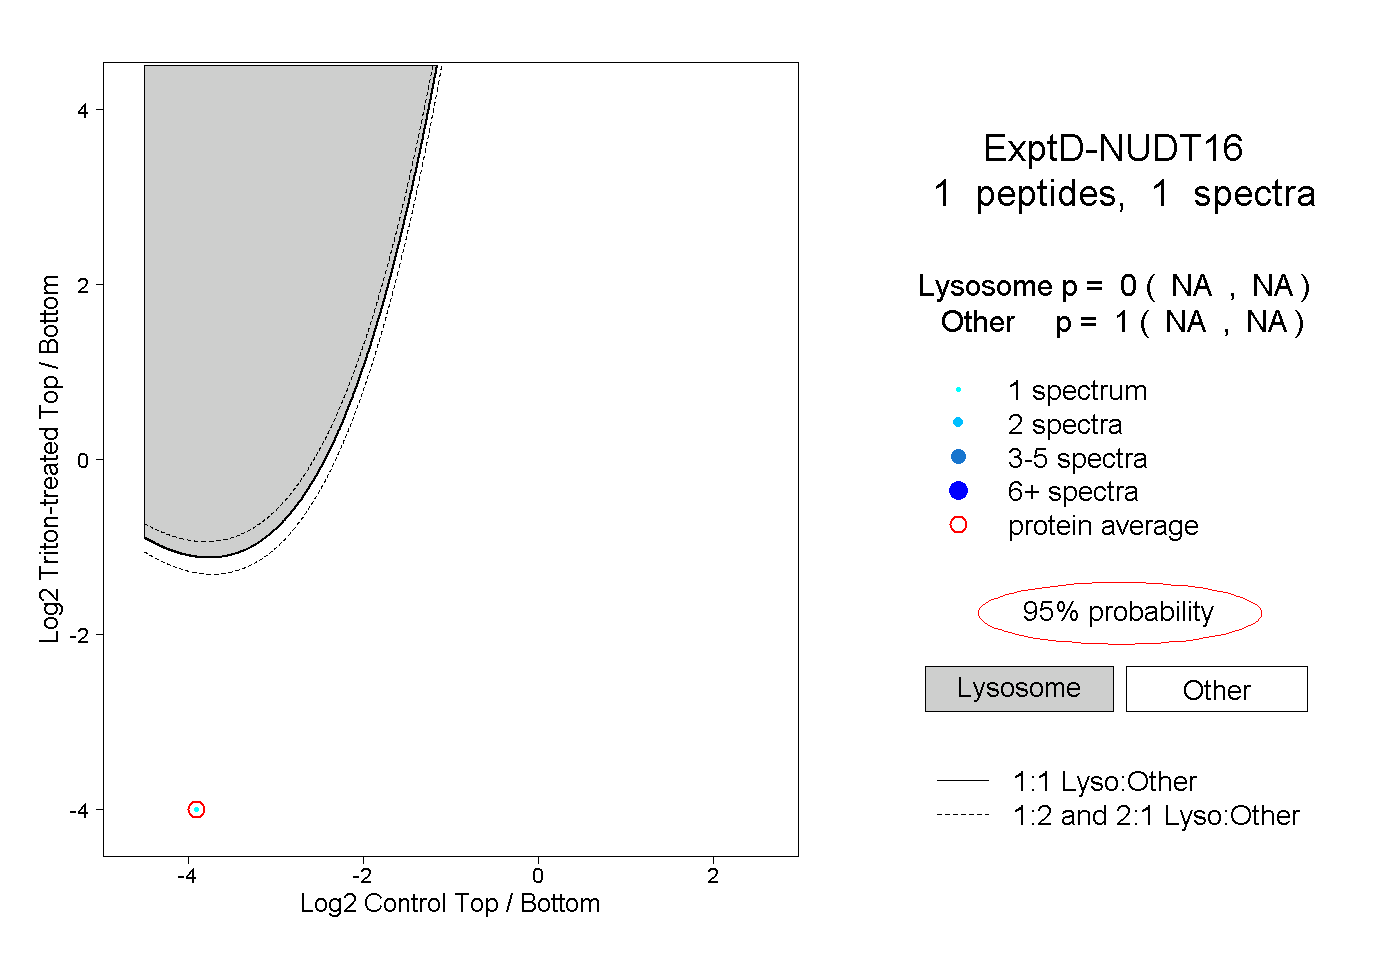 |
0.000 NA | NA |
1.000 NA | NA |