NUDT16
[ENSRNOP00000017318]
Main page
| | | Plot |
Mito |
Lyso |
|
Perox |
ER |
Golgi |
PM |
Cytosol |
Nucleus |
|
| Expt A |
 10
10
peptides |
27
spectra |
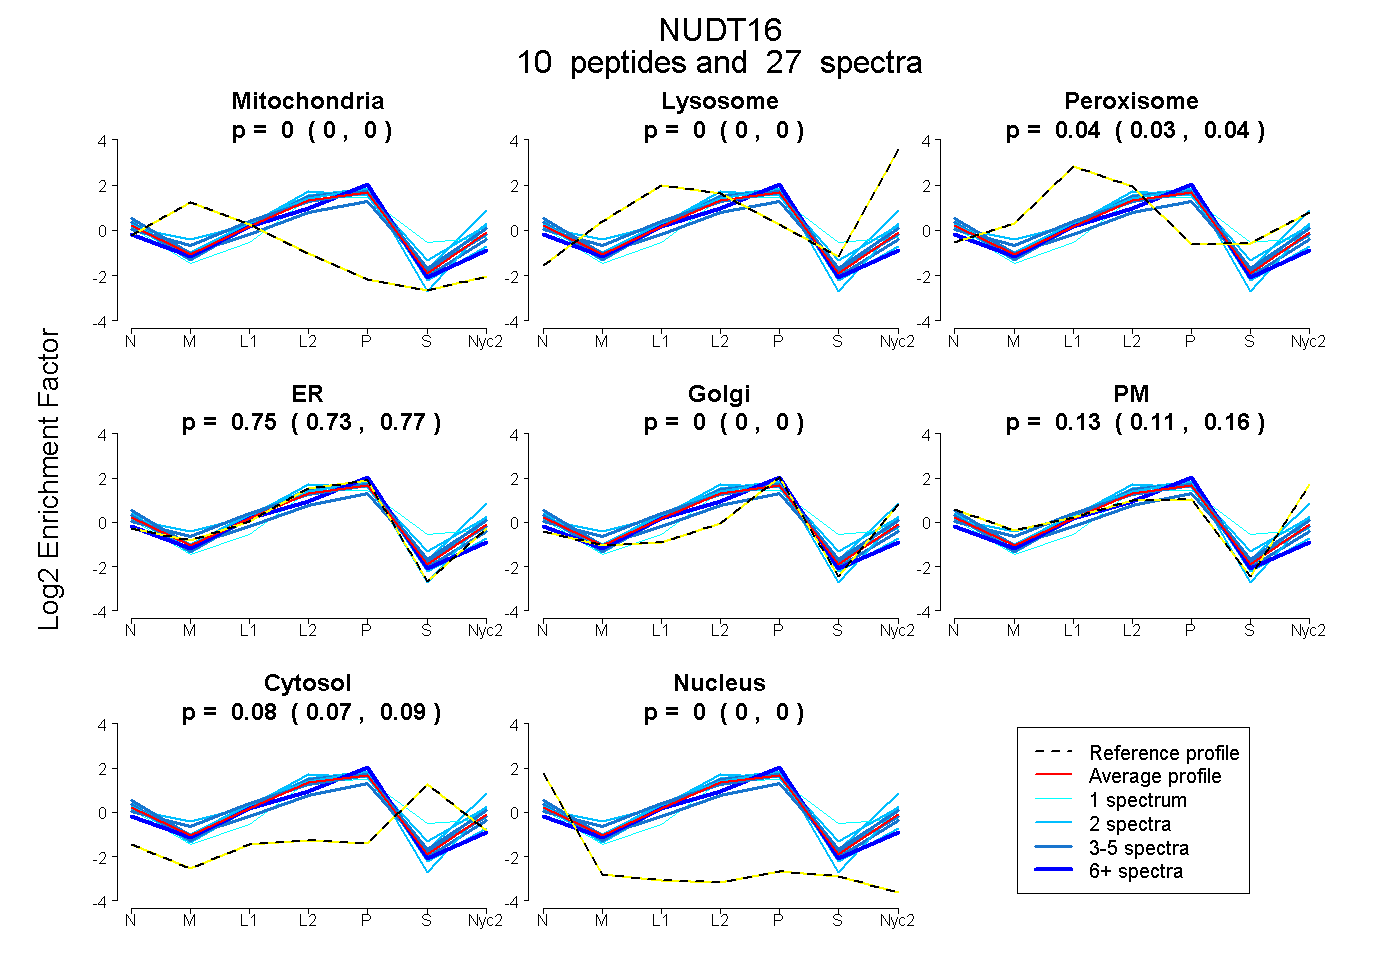 |
0.000
0.000 | 0.000 |
0.000
0.000 | 0.000 |
|
0.035
0.026 | 0.042 |
0.750
0.728 | 0.769 |
0.000
0.000 | 0.000 |
0.134
0.108 | 0.156 |
0.081
0.075 | 0.086 |
0.000
0.000 | 0.000 |
|
| | | Plot |
Mito |
|
Lyso or Perox |
|
ER |
Golgi |
PM |
Cytosol |
Nucleus |
|
| Expt B |
6
peptides |
11
spectra |
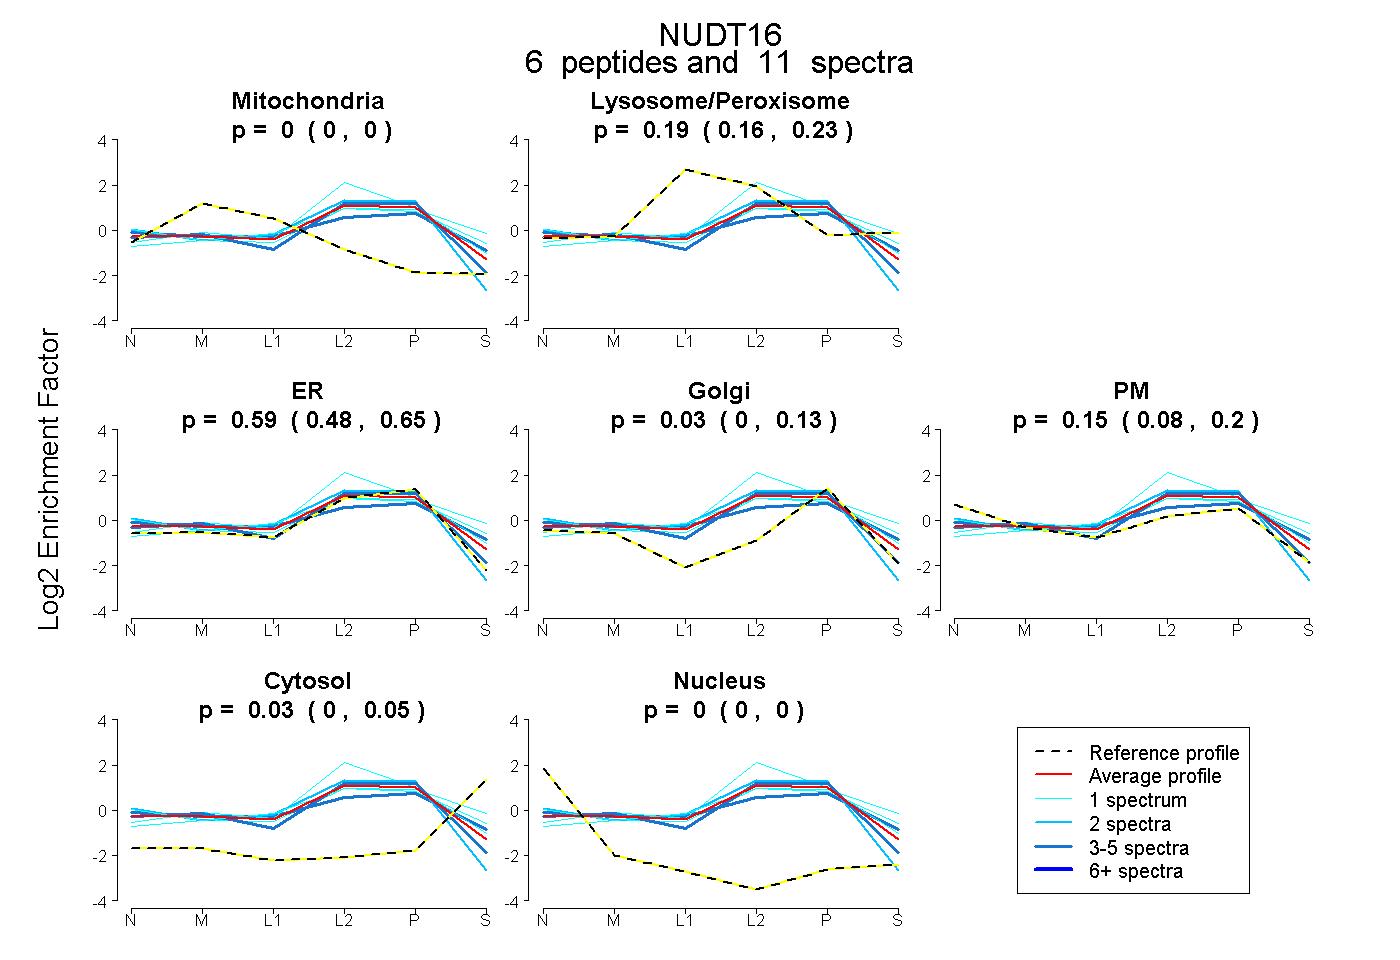 |
0.000
0.000 | 0.000 |
|
0.192
0.158 | 0.234 |
|
0.592
0.480 | 0.652 |
0.032
0.000 | 0.133 |
0.154
0.080 | 0.200 |
0.030
0.001 | 0.046 |
0.000
0.000 | 0.000 |
|
| 1 spectrum, FAVLMQMR |
0.000 |
|
0.283 |
|
0.717 |
0.000 |
0.000 |
0.000 |
0.000 |
|
| 3 spectra, EQLLEALR |
0.000 |
|
0.349 |
|
0.044 |
0.367 |
0.214 |
0.026 |
0.000 |
|
| 3 spectra, VPLYIMR |
0.000 |
|
0.045 |
|
0.799 |
0.000 |
0.156 |
0.000 |
0.000 |
|
| 1 spectrum, VVAHFYAK |
0.000 |
|
0.358 |
|
0.187 |
0.188 |
0.218 |
0.049 |
0.000 |
|
| 2 spectra, IAARPR |
0.000 |
|
0.074 |
|
0.813 |
0.000 |
0.113 |
0.000 |
0.000 |
|
| 1 spectrum, DHGLEVLGLVR |
0.000 |
|
0.254 |
|
0.542 |
0.000 |
0.000 |
0.204 |
0.000 |
|
| | | Plot |
|
Lyso |
|
|
|
|
|
|
|
Other |
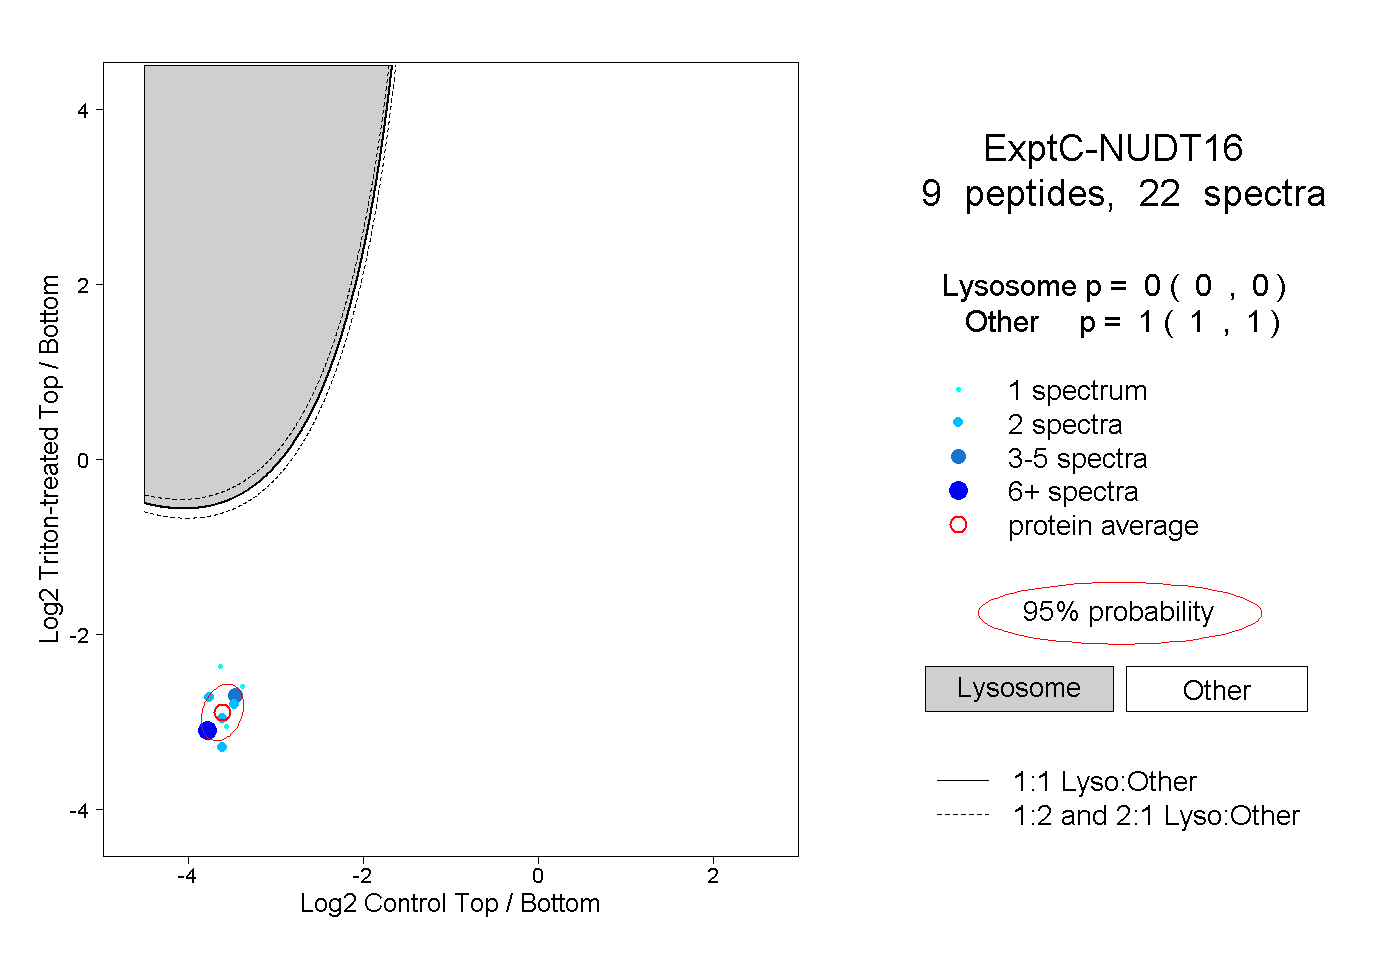
| Expt C |
9
peptides |
22
spectra |
 |
|
0.000
0.000 | 0.000 |
|
|
|
|
|
|
|
1.000
1.000 | 1.000 |
| | | Plot |
|
Lyso |
|
|
|
|
|
|
|
Other |
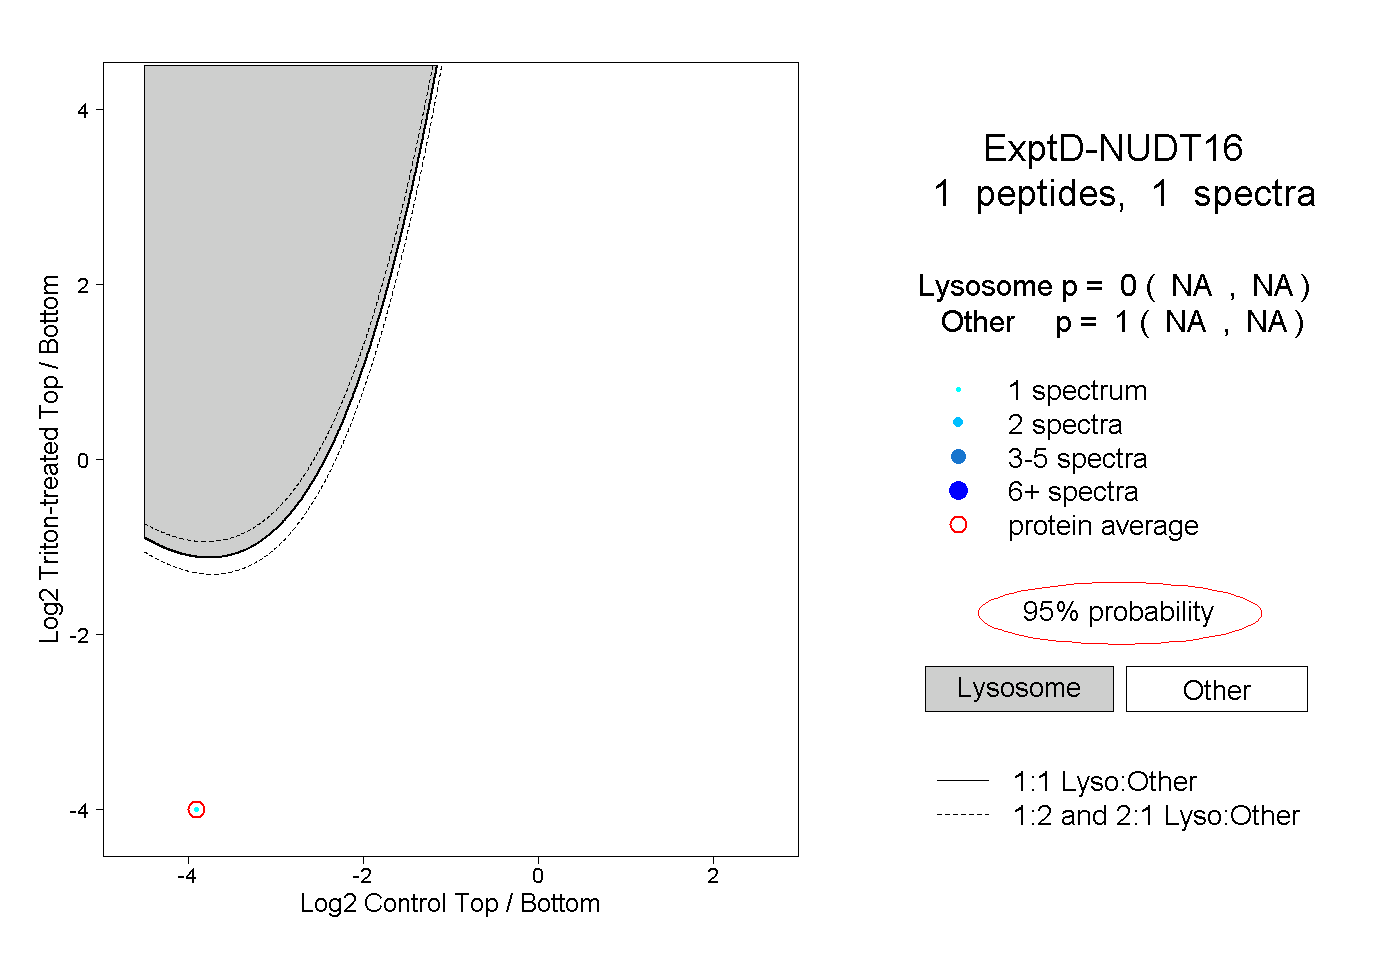
| Expt D |
1
peptide |
1
spectrum |
 |
|
0.000
NA | NA |
|
|
|
|
|
|
|
1.000
NA | NA |