 25
25peptides
spectra
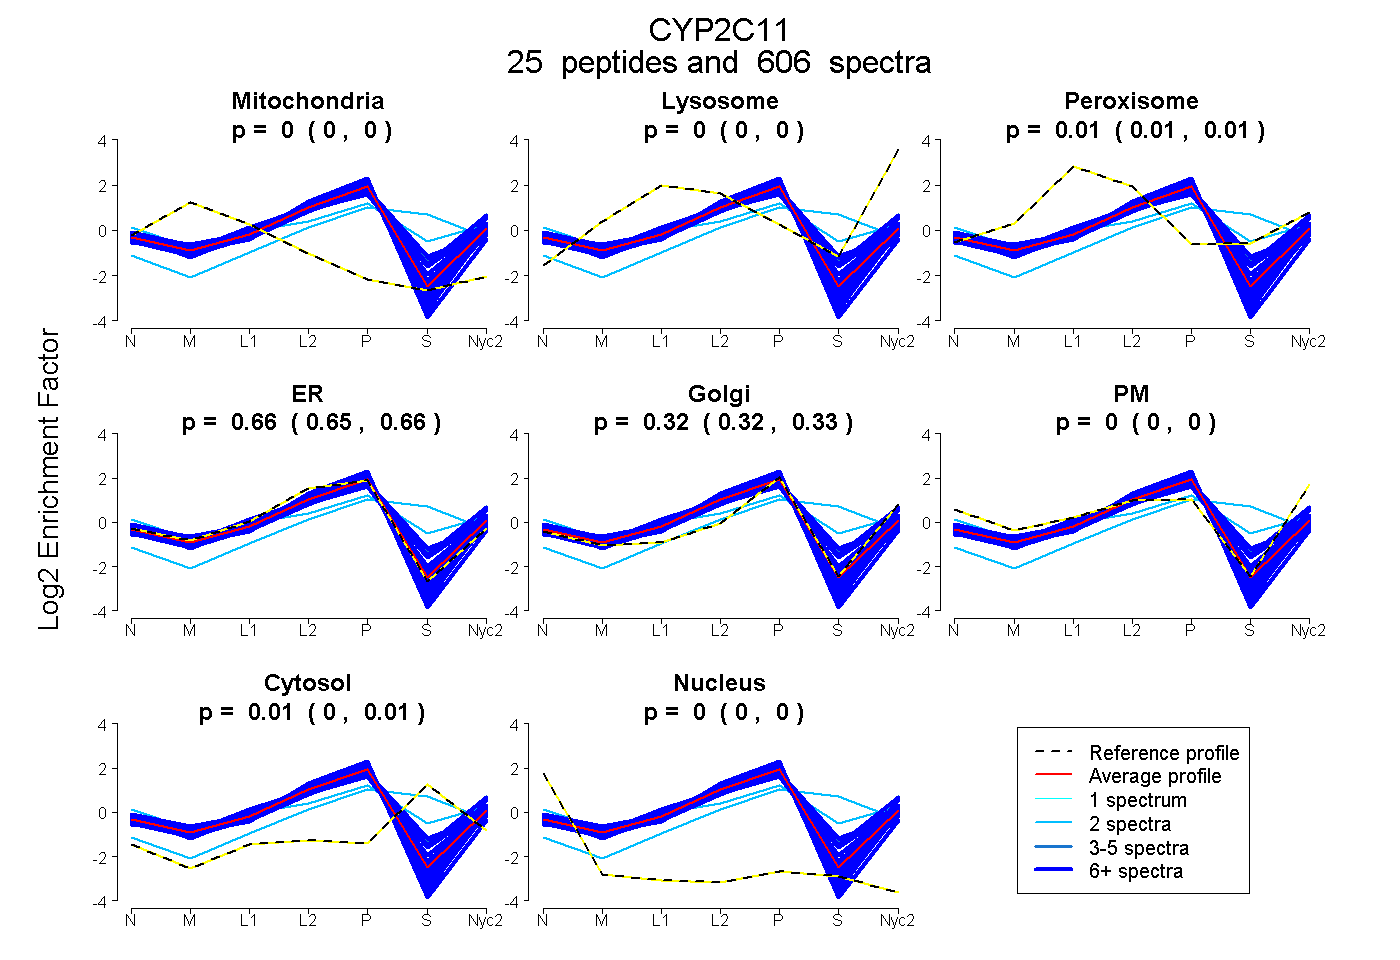
0.000 | 0.000
0.000 | 0.000
0.011 | 0.013
0.654 | 0.659
0.322 | 0.326
0.000 | 0.000
0.004 | 0.007
0.000 | 0.000
22peptides
spectra
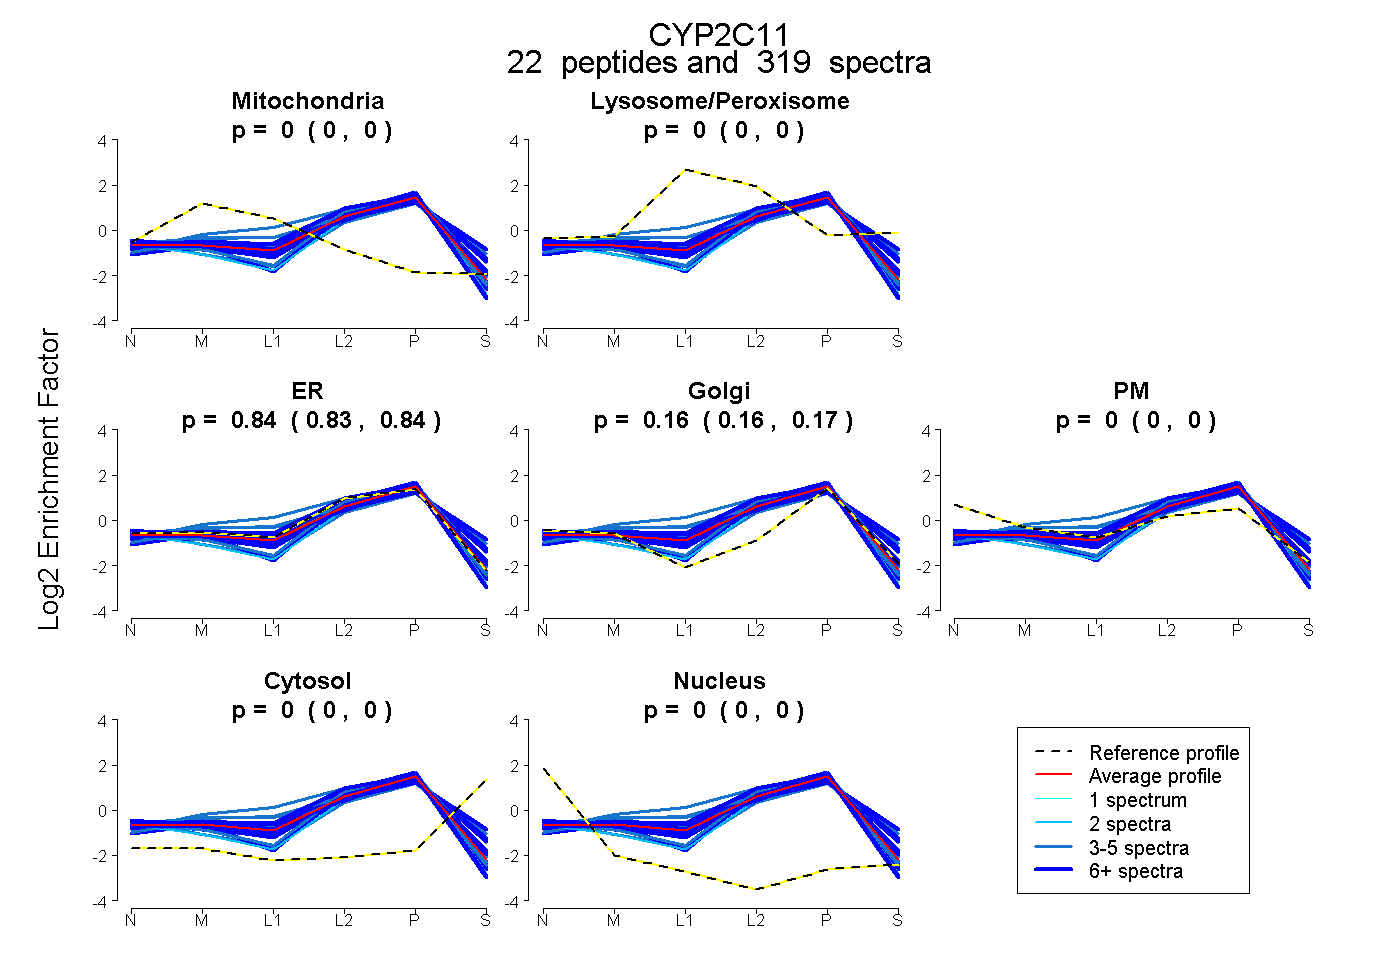
0.000 | 0.000
0.000 | 0.002
0.830 | 0.838
0.161 | 0.167
0.000 | 0.000
0.000 | 0.000
0.000 | 0.000
25peptides
spectra
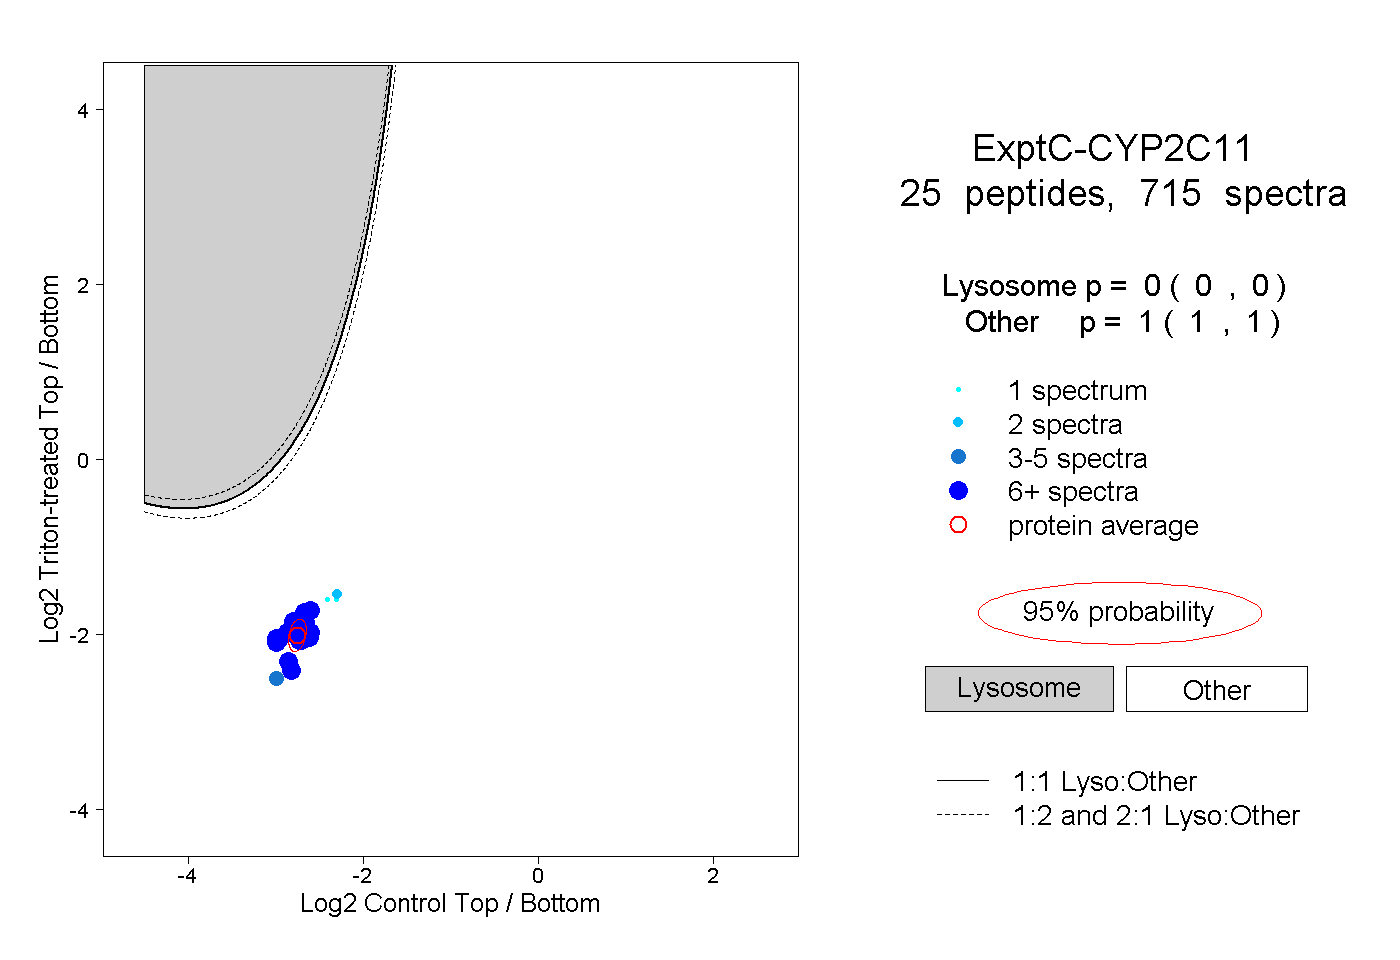
0.000 | 0.000
1.000 | 1.000
16peptides
spectra
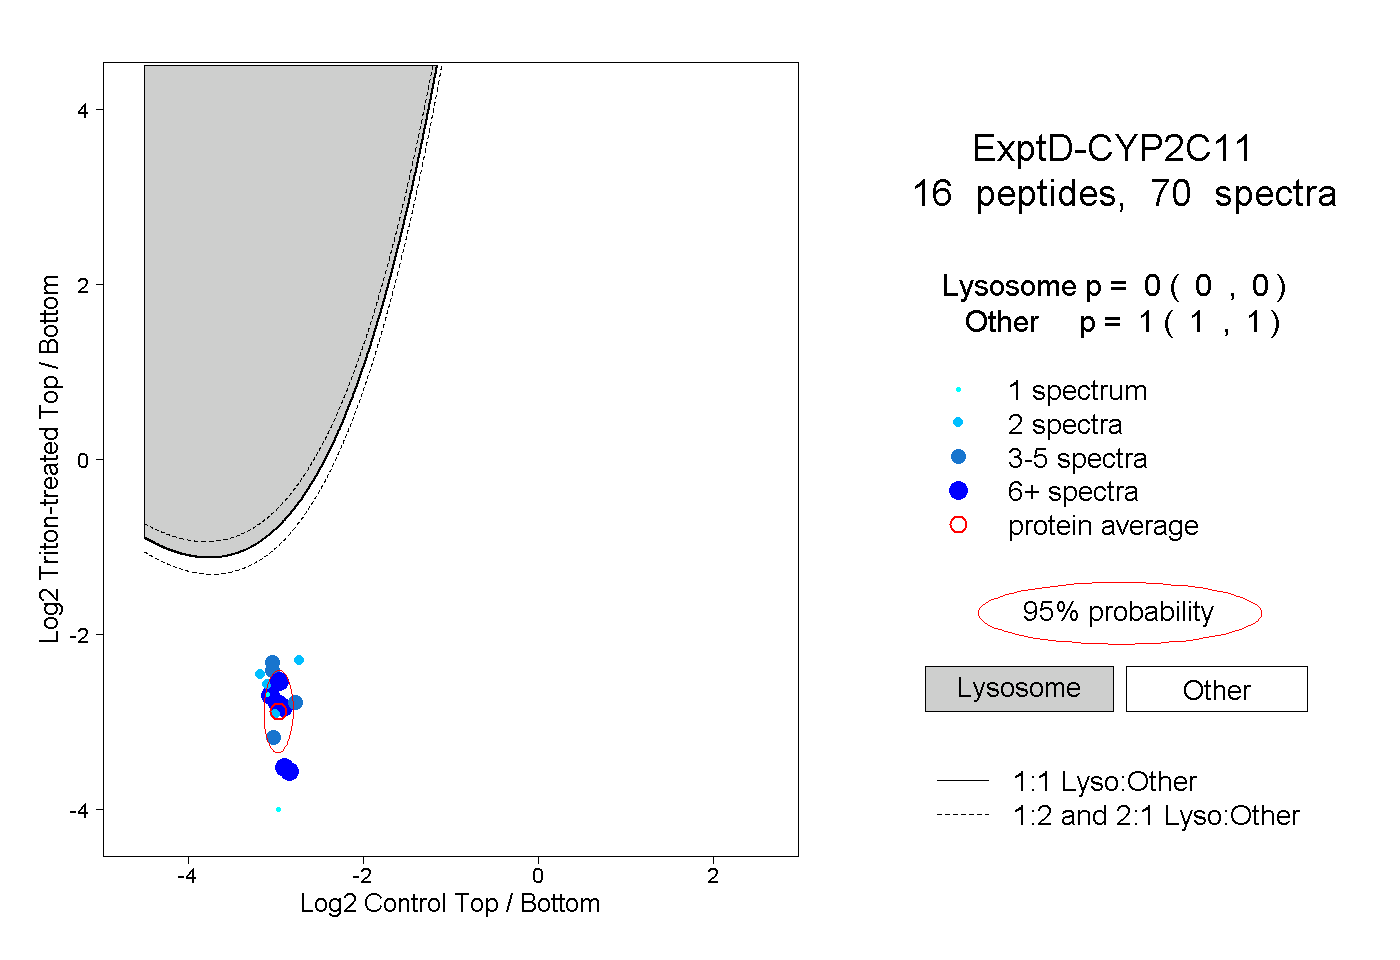
0.000 | 0.000
1.000 | 1.000