| 17 spectra, FSLMTLR |
0.000 |
|
0.000 |
|
0.731 |
0.269 |
0.000 |
0.000 |
0.000 |
|
| 29 spectra, VQEEIER |
0.000 |
|
0.000 |
|
0.848 |
0.152 |
0.000 |
0.000 |
0.000 |
|
| 7 spectra, NYVLEK |
0.000 |
|
0.104 |
|
0.608 |
0.206 |
0.000 |
0.082 |
0.000 |
|
| 13 spectra, HVDVTAK |
0.000 |
|
0.006 |
|
0.855 |
0.129 |
0.000 |
0.000 |
0.010 |
|
| 2 spectra, SDYFMPFSAGK |
0.000 |
|
0.000 |
|
0.599 |
0.401 |
0.000 |
0.000 |
0.000 |
|
| 5 spectra, NYFIPK |
0.068 |
|
0.005 |
|
0.927 |
0.000 |
0.000 |
0.000 |
0.000 |
|
| 34 spectra, GSFPVSER |
0.000 |
|
0.000 |
|
0.748 |
0.252 |
0.000 |
0.000 |
0.000 |
|
| 32 spectra, YIDLVPTNLPHLVTR |
0.000 |
|
0.060 |
|
0.661 |
0.279 |
0.000 |
0.000 |
0.000 |
|
| 8 spectra, EALVDLGEEFSGR |
0.000 |
|
0.000 |
|
0.843 |
0.157 |
0.000 |
0.000 |
0.000 |
|
| 21 spectra, NFFYIK |
0.000 |
|
0.000 |
|
0.990 |
0.000 |
0.000 |
0.000 |
0.010 |
|
| 16 spectra, YGLLLLLK |
0.000 |
|
0.000 |
|
1.000 |
0.000 |
0.000 |
0.000 |
0.000 |
|
| 35 spectra, DFIDCFLNK |
0.000 |
|
0.000 |
|
0.955 |
0.030 |
0.000 |
0.000 |
0.015 |
|
| 32 spectra, ICAGEALAR |
0.000 |
|
0.078 |
|
0.630 |
0.124 |
0.000 |
0.168 |
0.000 |
|
| 13 spectra, SQMPYTDAVVHEIQR |
0.000 |
|
0.196 |
|
0.412 |
0.381 |
0.000 |
0.012 |
0.000 |
|
| 5 spectra, ADSLSSHL |
0.000 |
|
0.000 |
|
0.555 |
0.445 |
0.000 |
0.000 |
0.000 |
|
| 21 spectra, FDPGHFLDER |
0.000 |
|
0.000 |
|
0.846 |
0.154 |
0.000 |
0.000 |
0.000 |
|
| 4 spectra, IQEEAQCLVEELR |
0.000 |
|
0.088 |
|
0.759 |
0.088 |
0.000 |
0.065 |
0.000 |
|
| 3 spectra, TFGMGK |
0.000 |
|
0.000 |
|
0.740 |
0.258 |
0.000 |
0.003 |
0.000 |
|
| 4 spectra, FNENFR |
0.000 |
|
0.347 |
|
0.097 |
0.556 |
0.000 |
0.000 |
0.000 |
|
| 10 spectra, GLGVIFSNGMQWK |
0.000 |
|
0.000 |
|
0.764 |
0.184 |
0.000 |
0.052 |
0.000 |
|
| 4 spectra, DPTFLNLMHR |
0.000 |
|
0.319 |
|
0.498 |
0.183 |
0.000 |
0.000 |
0.000 |
|
| 4 spectra, VQEEELR |
0.000 |
|
0.000 |
|
0.843 |
0.157 |
0.000 |
0.000 |
0.000 |
|
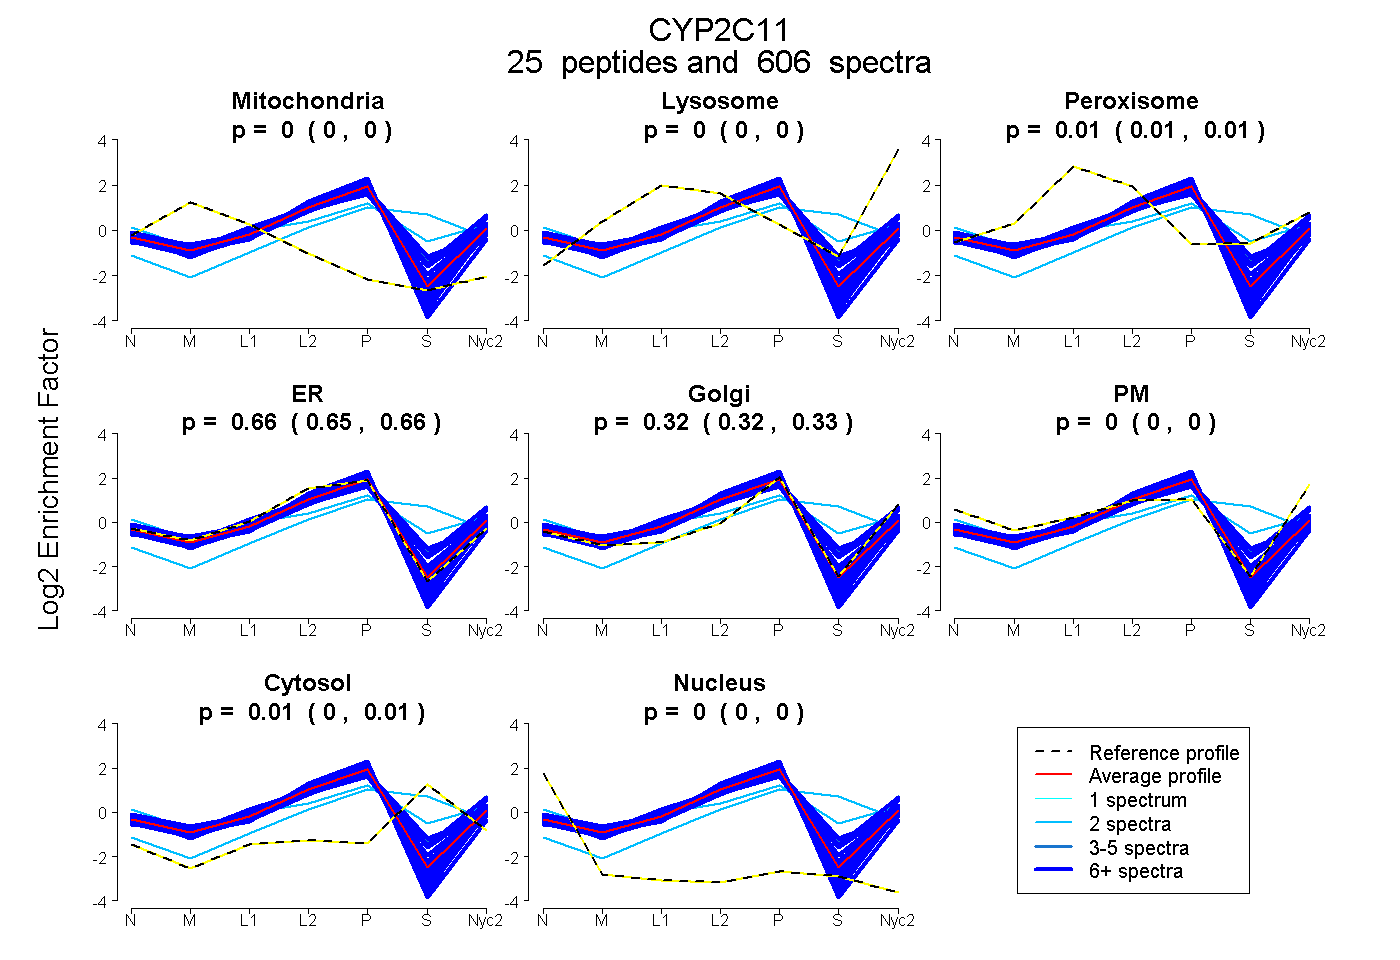
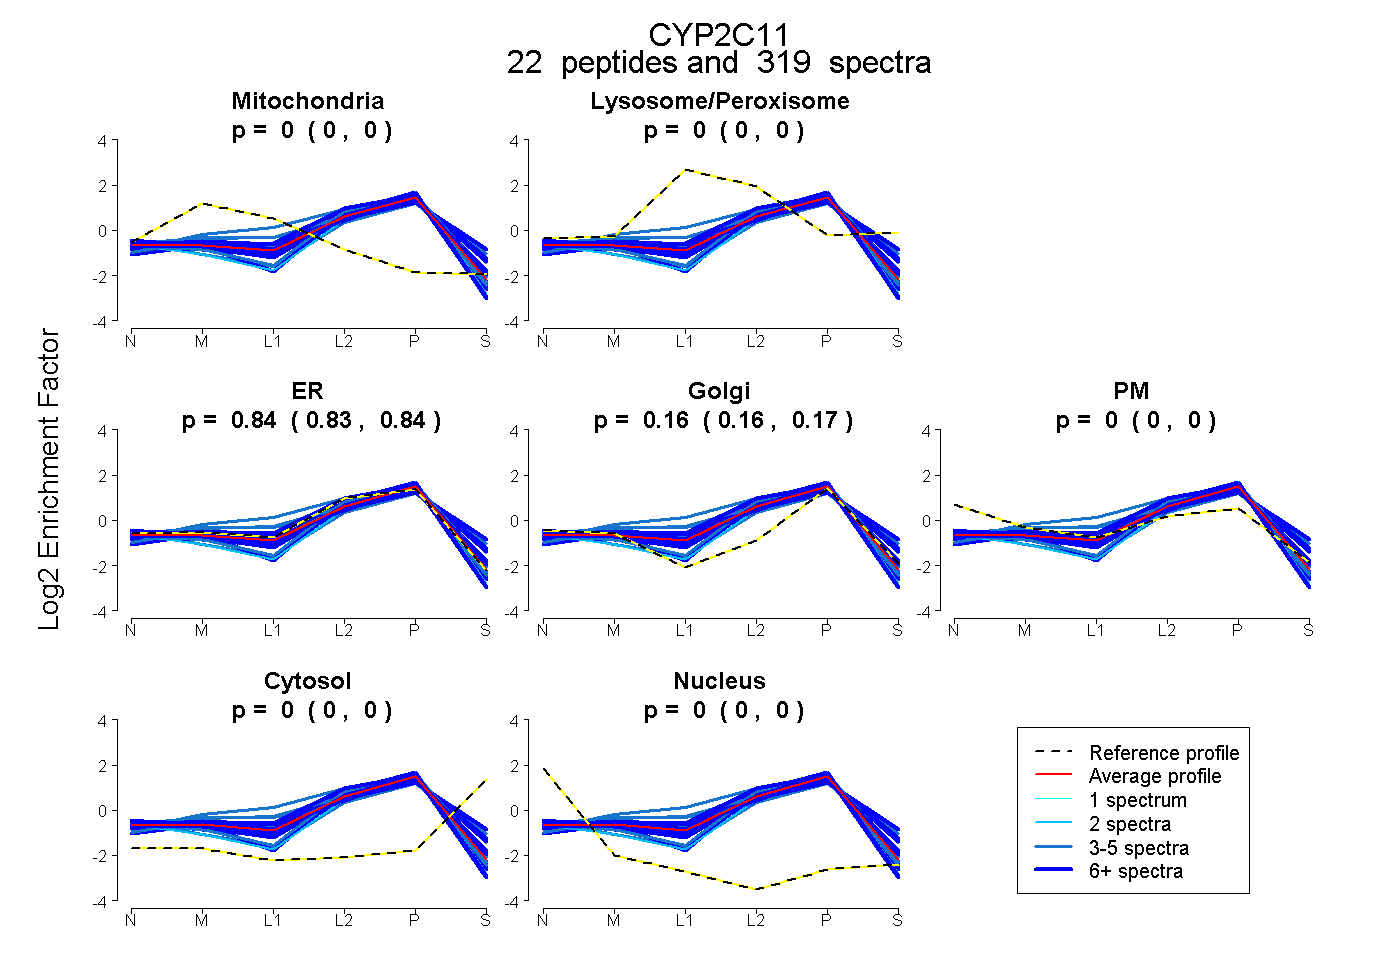
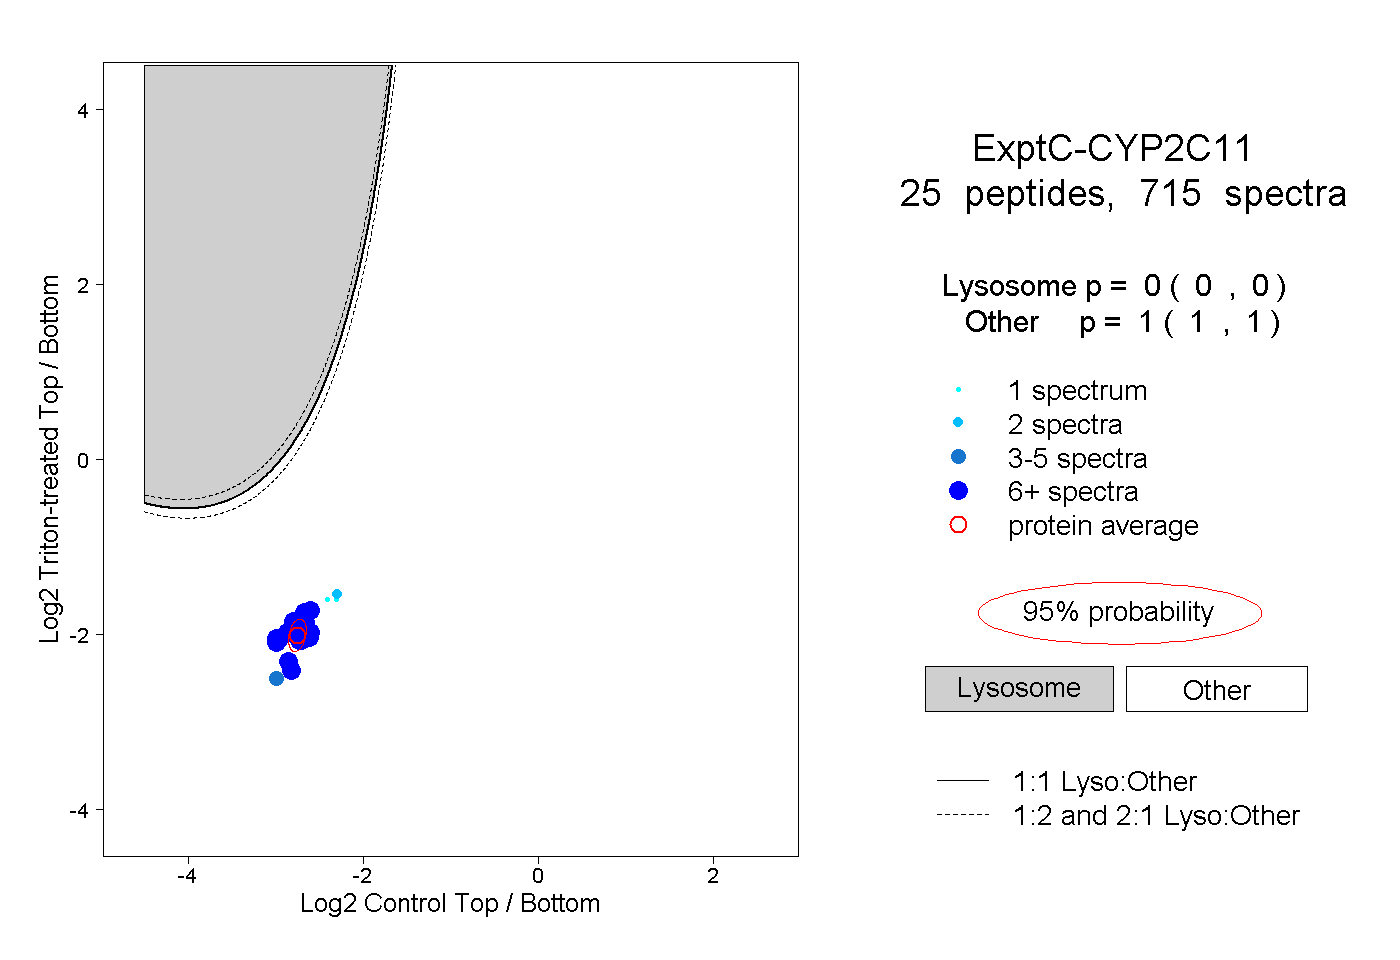
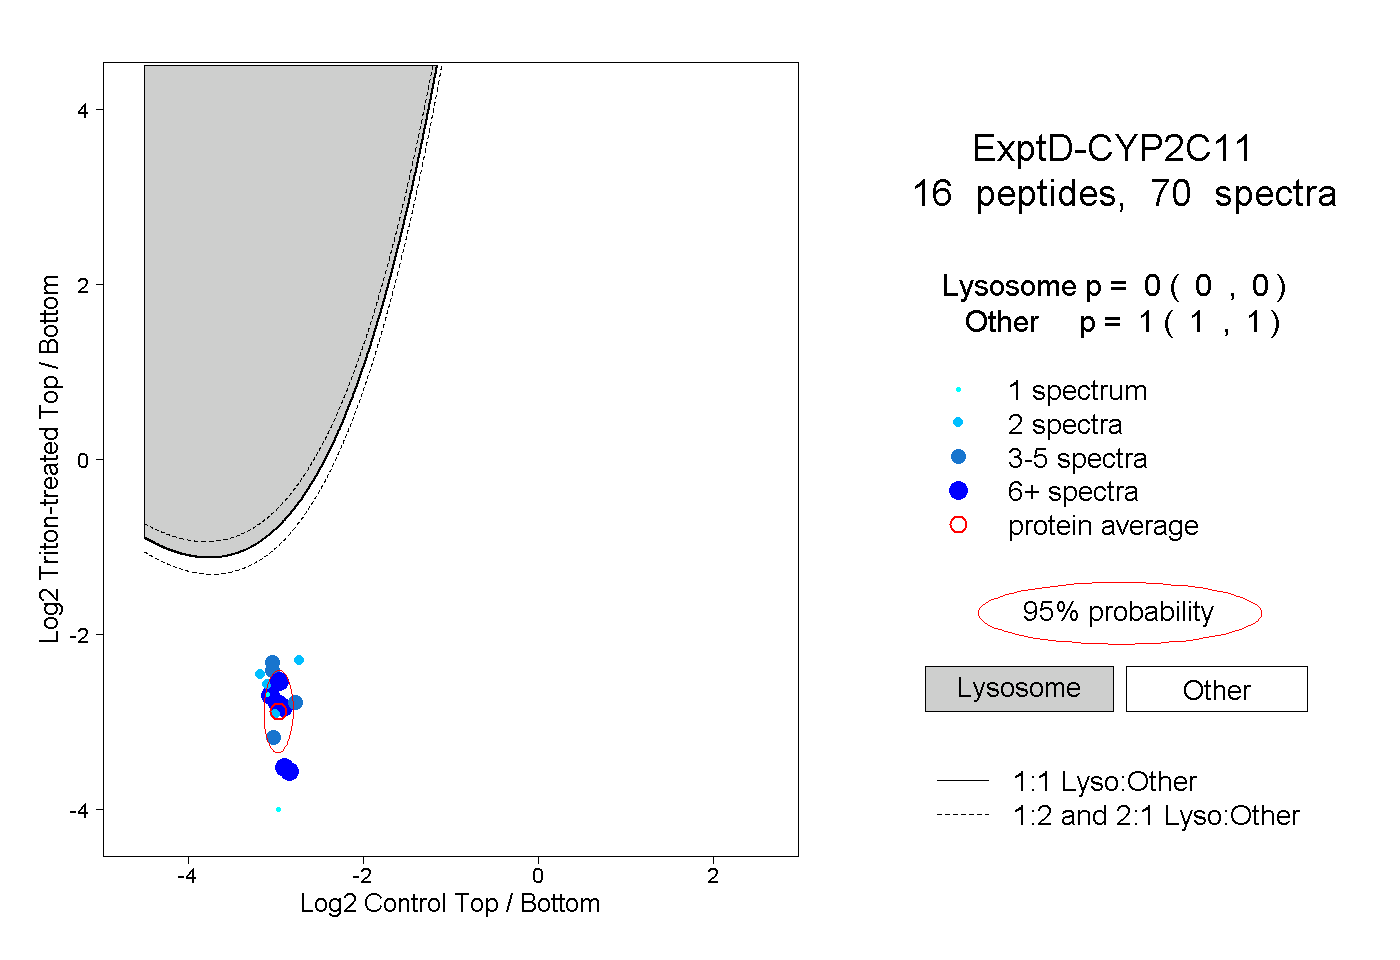
 25
25