 13
13peptides
spectra

0.028 | 0.034
0.000 | 0.000
0.000 | 0.000
0.966 | 0.971
0.000 | 0.000
0.000 | 0.000
0.000 | 0.000
0.000 | 0.000
12peptides
spectra
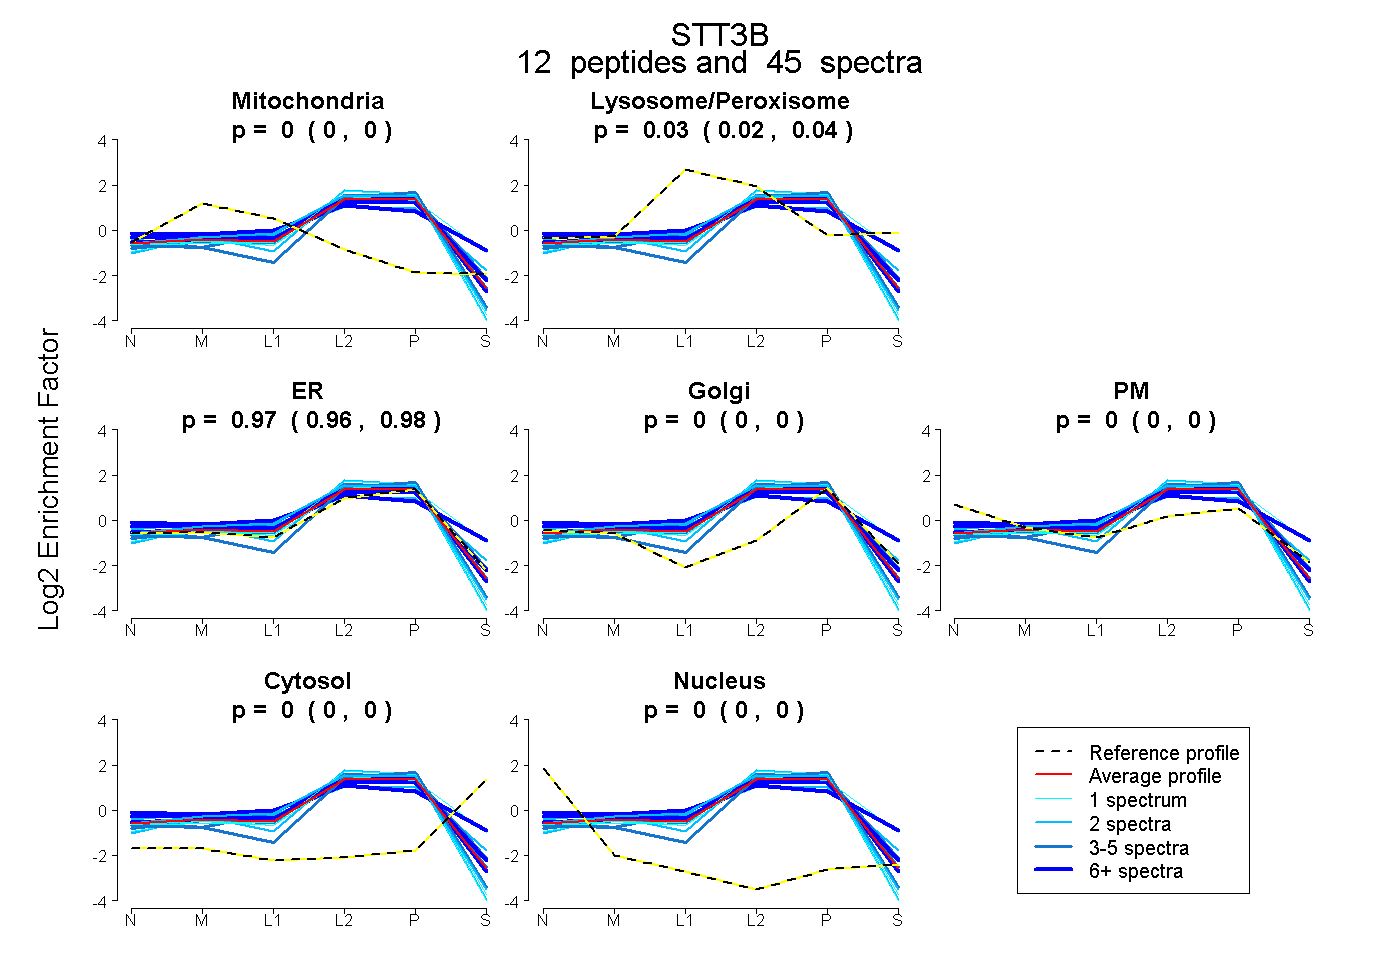
0.000 | 0.000
0.019 | 0.040
0.958 | 0.979
0.000 | 0.000
0.000 | 0.000
0.000 | 0.000
0.000 | 0.000
11peptides
spectra
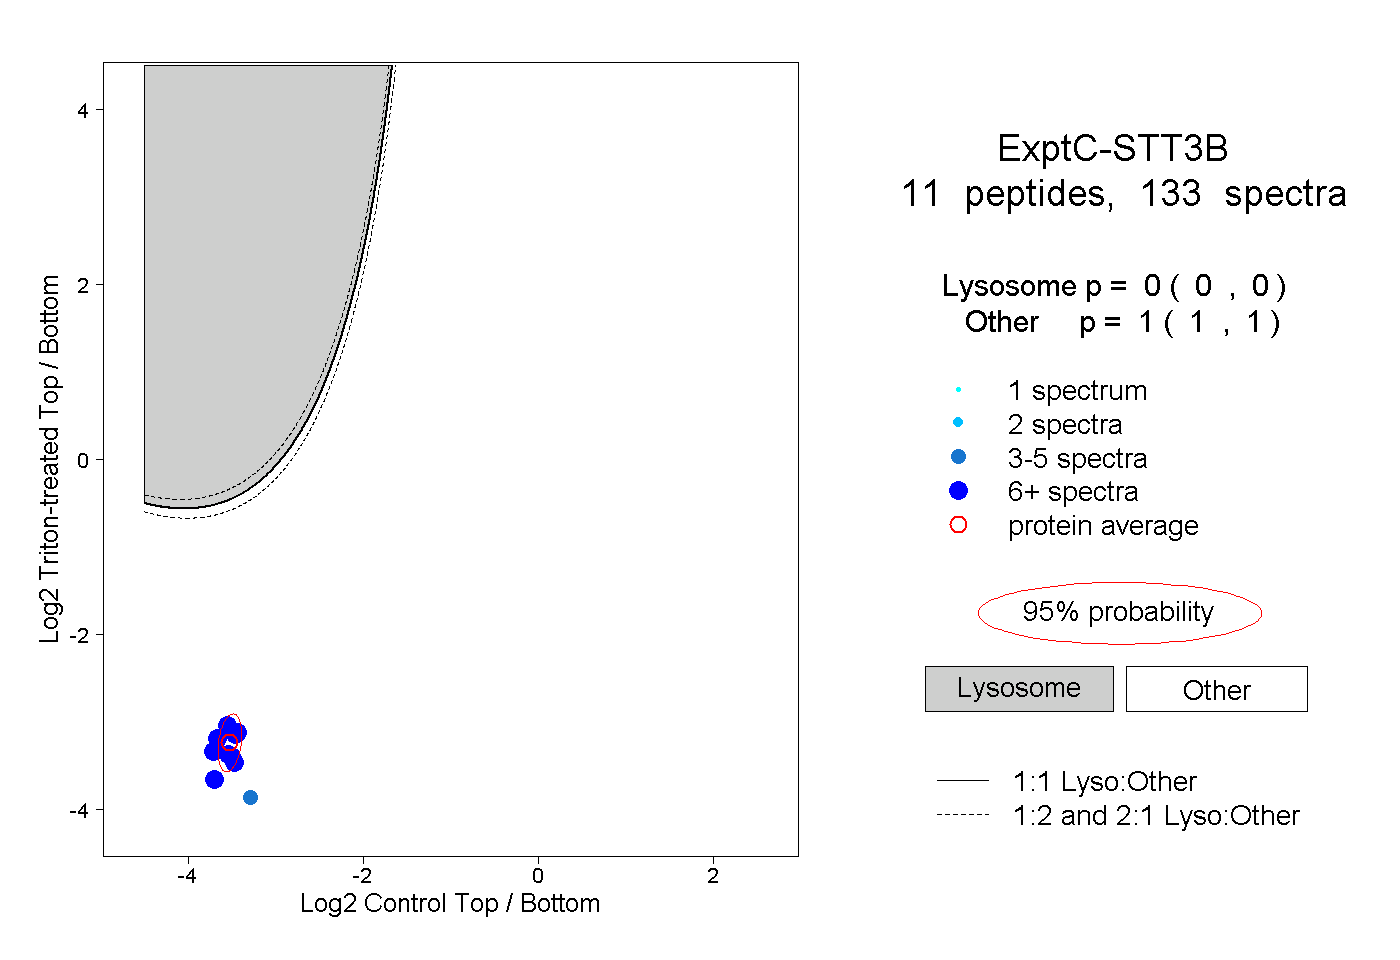
0.000 | 0.000
1.000 | 1.000
4peptides
spectra
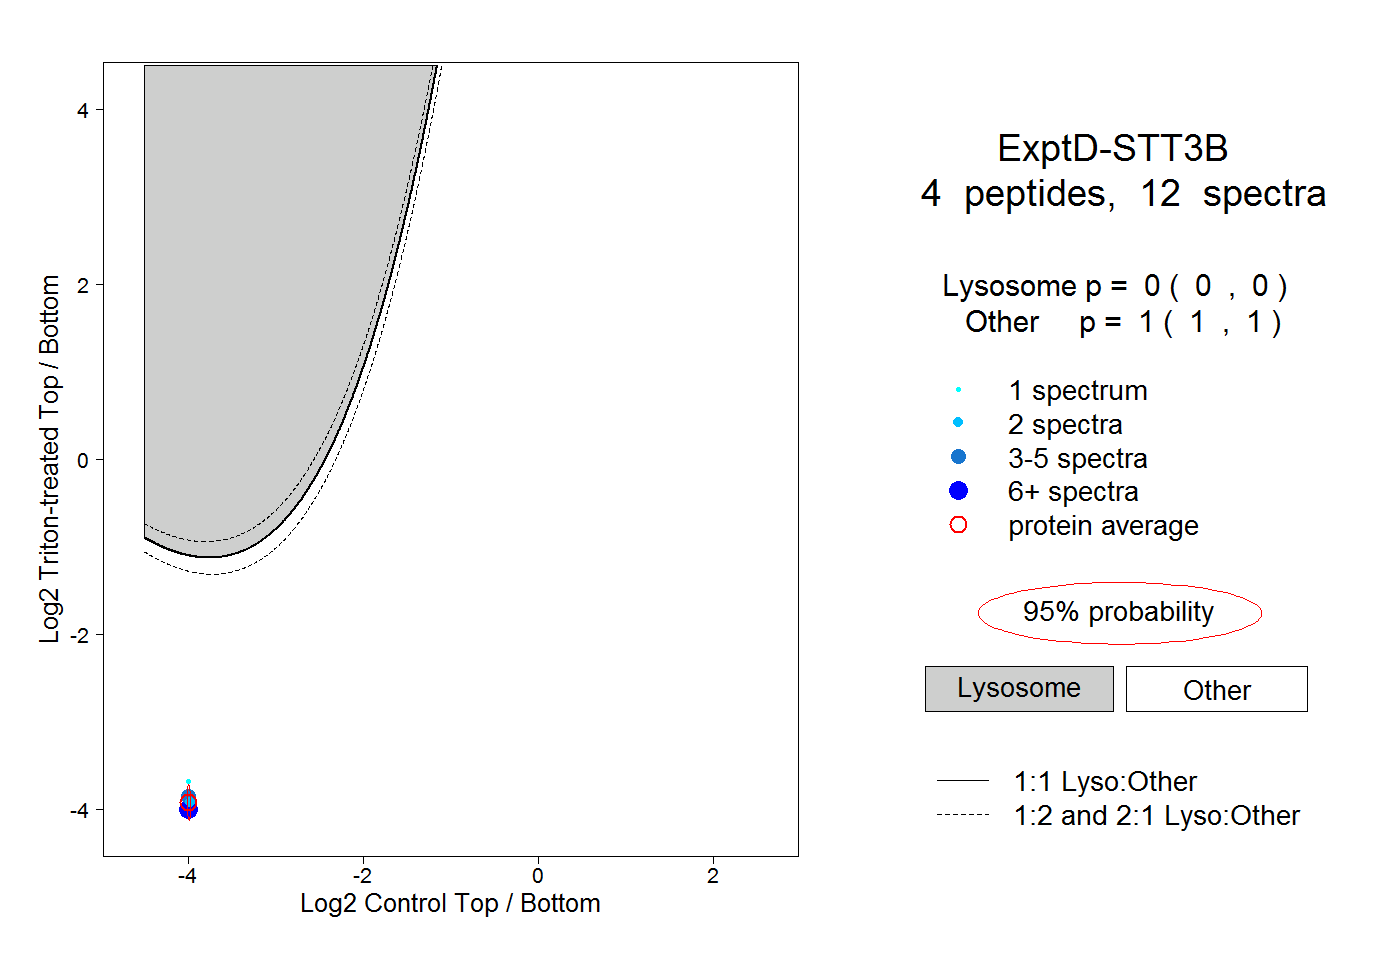
0.000 | 0.000
1.000 | 1.000