STT3B
[ENSRNOP00000017243]
Main page
| | | Plot |
Mito |
Lyso |
|
Perox |
ER |
Golgi |
PM |
Cytosol |
Nucleus |
|
| Expt A |
 13
13
peptides |
89
spectra |
 |
0.031
0.028 | 0.034 |
0.000
0.000 | 0.000 |
|
0.000
0.000 | 0.000 |
0.969
0.966 | 0.971 |
0.000
0.000 | 0.000 |
0.000
0.000 | 0.000 |
0.000
0.000 | 0.000 |
0.000
0.000 | 0.000 |
|
| | | Plot |
Mito |
|
Lyso or Perox |
|
ER |
Golgi |
PM |
Cytosol |
Nucleus |
|
| Expt B |
12
peptides |
45
spectra |
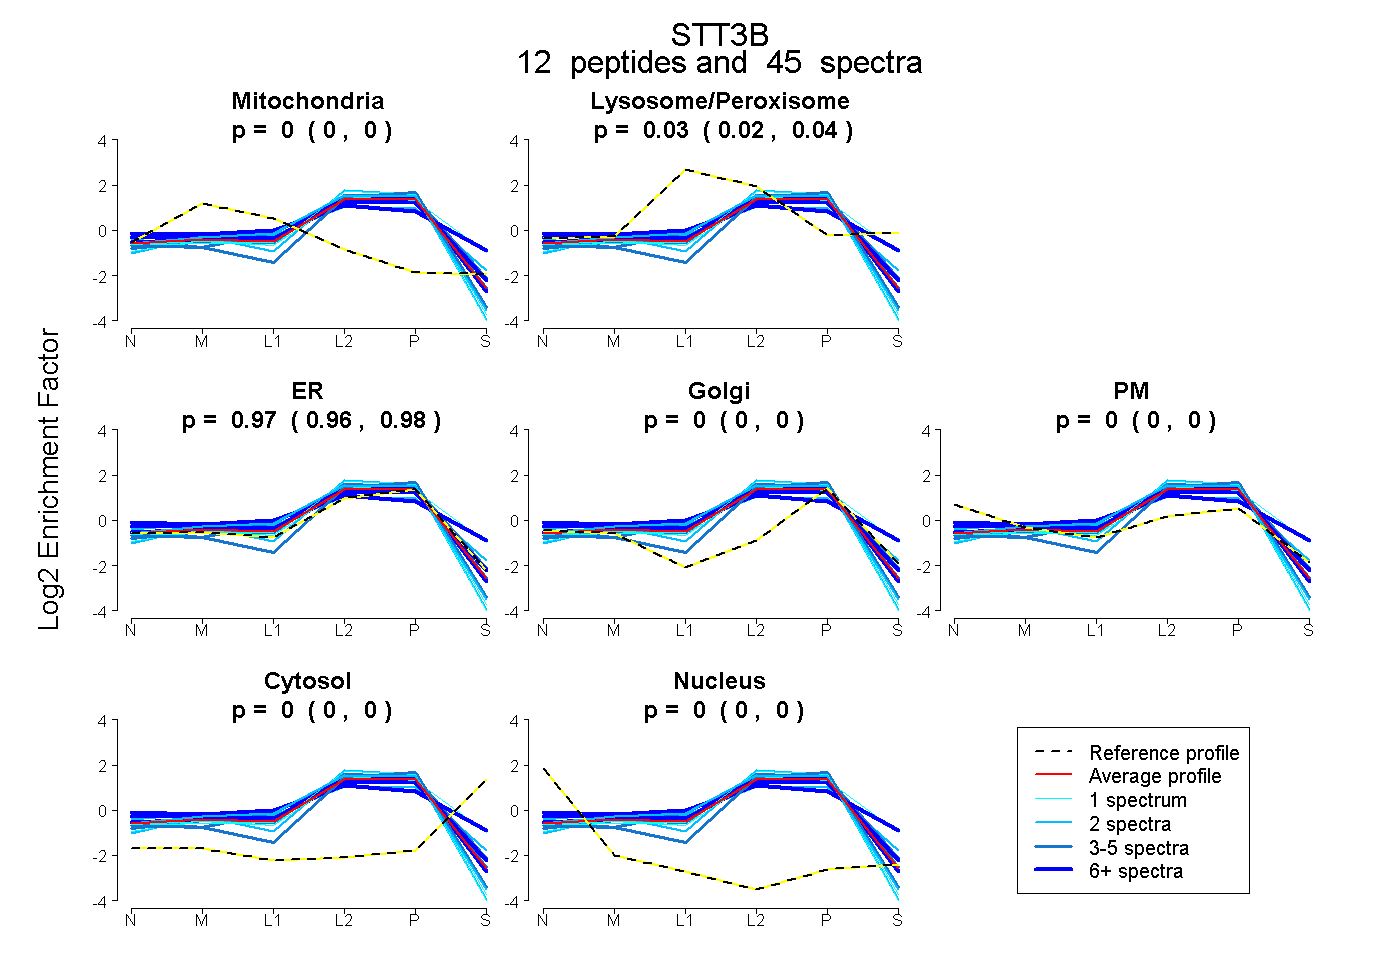 |
0.000
0.000 | 0.000 |
|
0.031
0.019 | 0.040 |
|
0.969
0.958 | 0.979 |
0.000
0.000 | 0.000 |
0.000
0.000 | 0.000 |
0.000
0.000 | 0.000 |
0.000
0.000 | 0.000 |
|
| | | Plot |
|
Lyso |
|
|
|
|
|
|
|
Other |
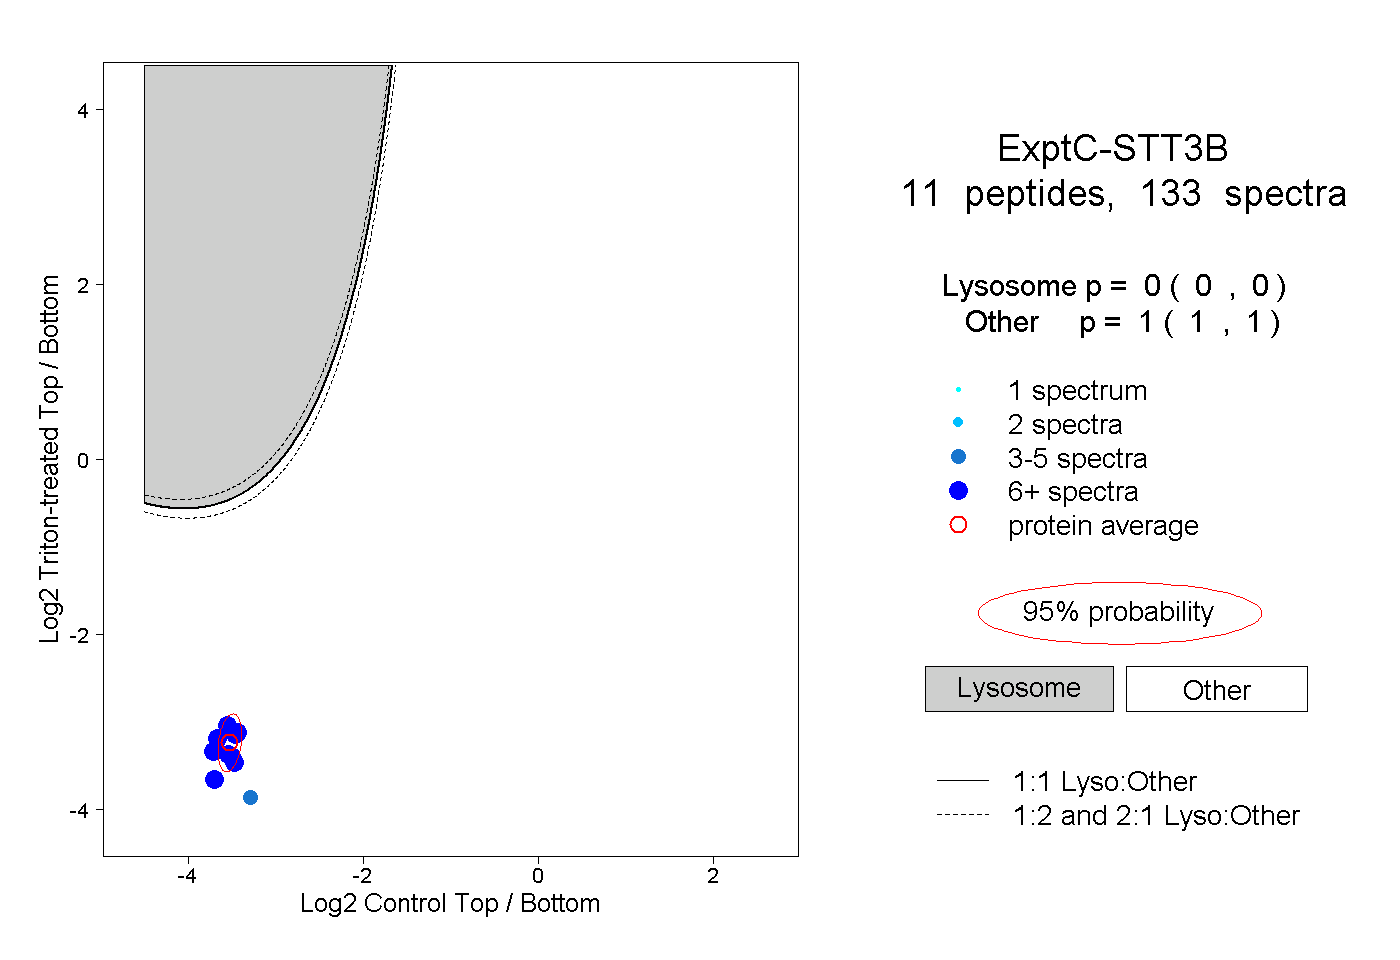
| Expt C |
11
peptides |
133
spectra |
 |
|
0.000
0.000 | 0.000 |
|
|
|
|
|
|
|
1.000
1.000 | 1.000 |
| 13 spectra, NILDDFR |
|
0.000 |
|
|
|
|
|
|
|
1.000 |
| 9 spectra, EAYFWLR |
|
0.000 |
|
|
|
|
|
|
|
1.000 |
| 6 spectra, AGSPTLLNCLMYK |
|
0.000 |
|
|
|
|
|
|
|
1.000 |
| 13 spectra, EGDYFTQQGEFR |
|
0.000 |
|
|
|
|
|
|
|
1.000 |
| 23 spectra, VTNIFPK |
|
0.000 |
|
|
|
|
|
|
|
1.000 |
| 7 spectra, FYSLWDTGYAK |
|
0.000 |
|
|
|
|
|
|
|
1.000 |
| 7 spectra, ETLGHKPR |
|
0.000 |
|
|
|
|
|
|
|
1.000 |
| 8 spectra, TPPGFDR |
|
0.000 |
|
|
|
|
|
|
|
1.000 |
| 5 spectra, SPGNLYDK |
|
0.000 |
|
|
|
|
|
|
|
1.000 |
| 11 spectra, FGEMQLDFR |
|
0.000 |
|
|
|
|
|
|
|
1.000 |
| 31 spectra, IAEGEHPK |
|
0.000 |
|
|
|
|
|
|
|
1.000 |
| | | Plot |
|
Lyso |
|
|
|
|
|
|
|
Other |
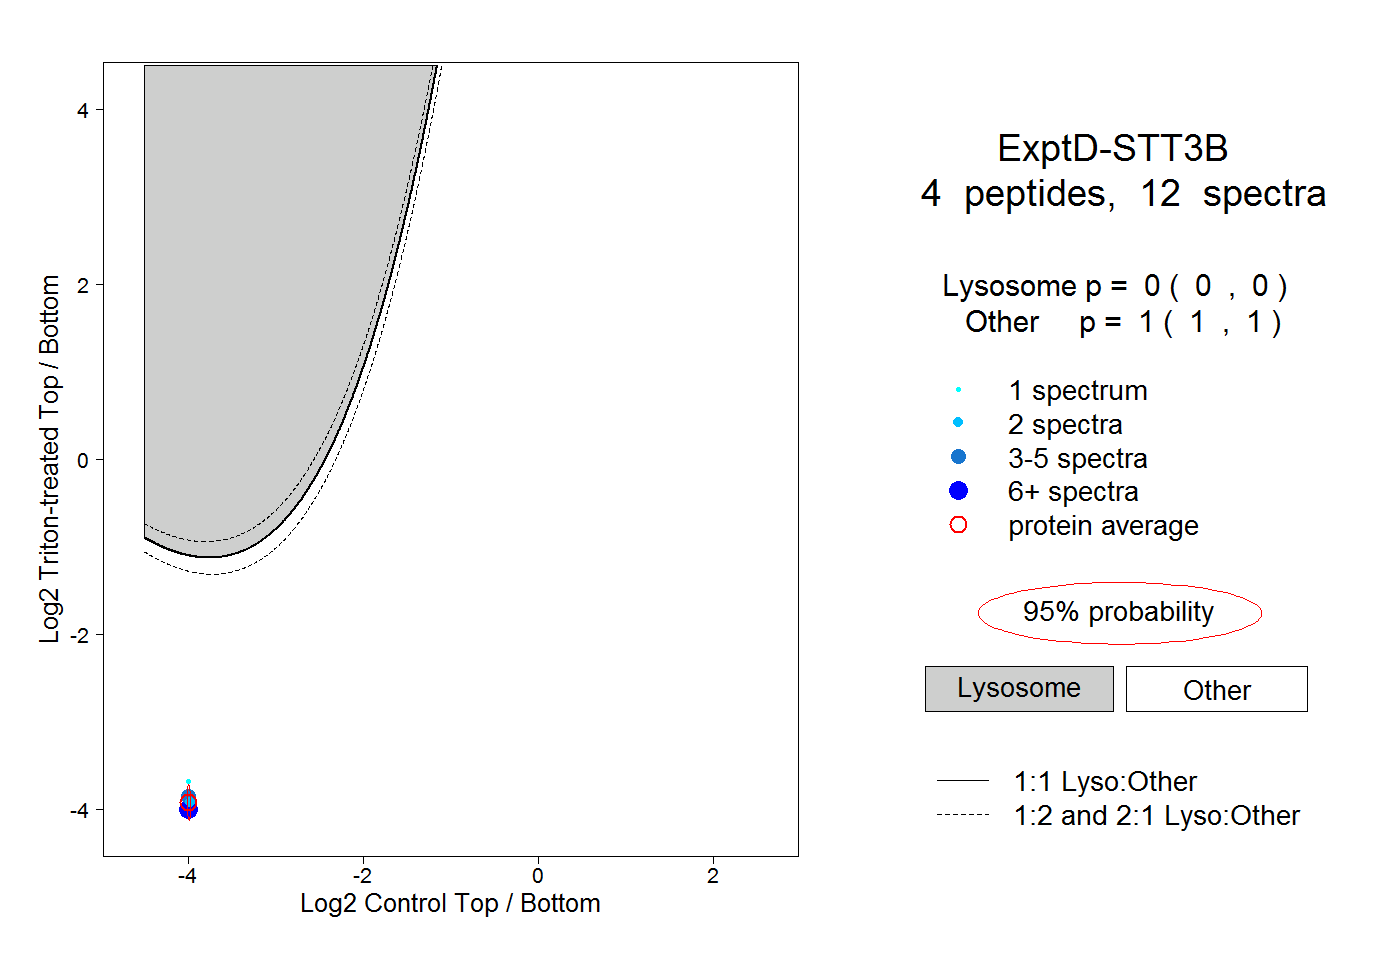
| Expt D |
4
peptides |
12
spectra |
 |
|
0.000
0.000 | 0.000 |
|
|
|
|
|
|
|
1.000
1.000 | 1.000 |