 9
9peptides
spectra
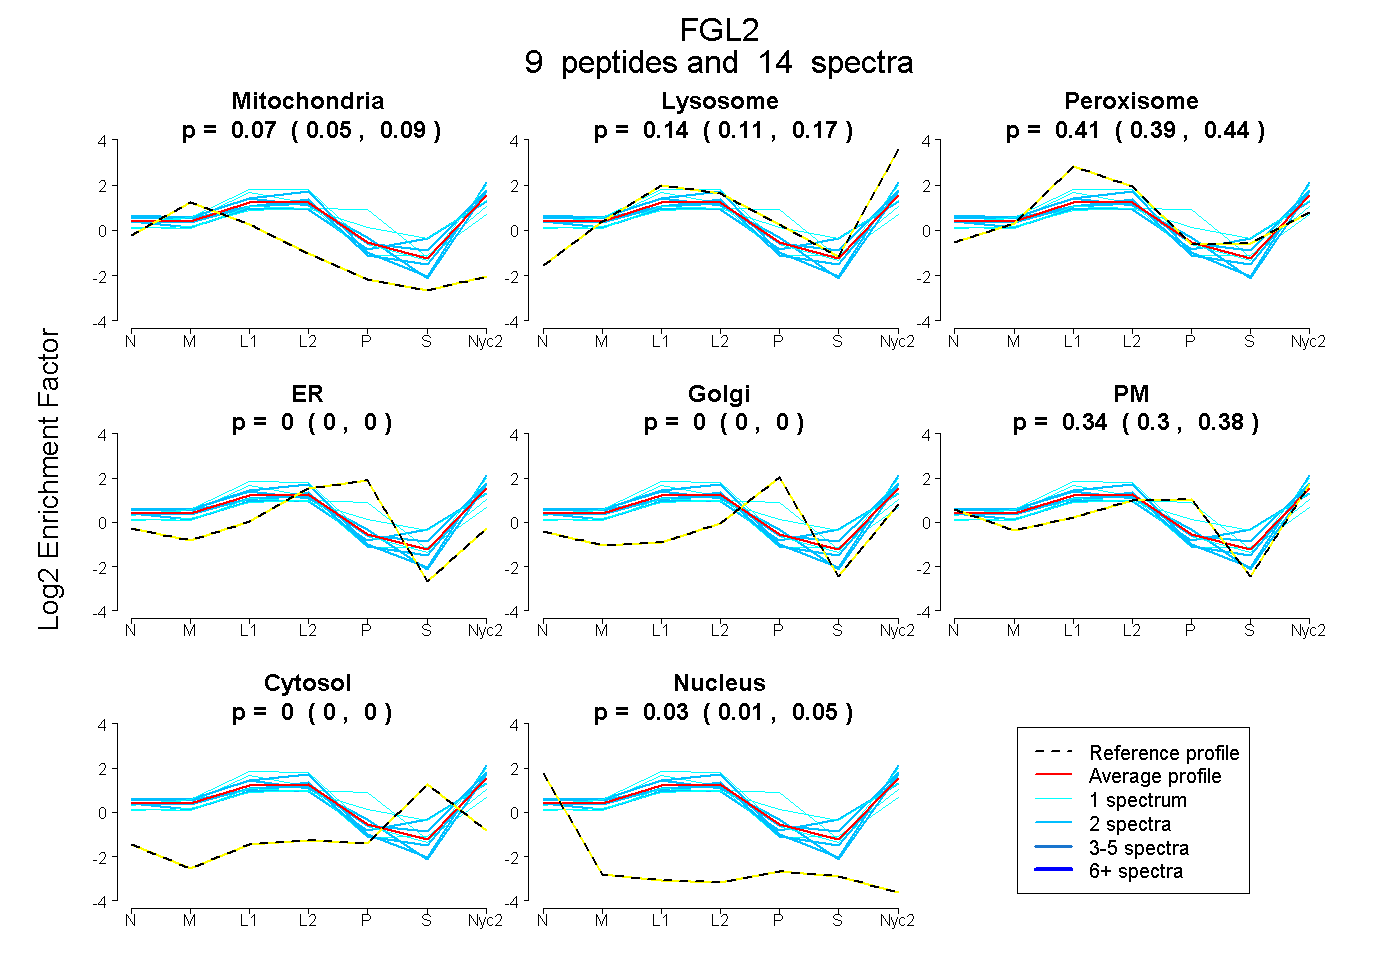
0.046 | 0.087
0.109 | 0.171
0.386 | 0.438
0.000 | 0.000
0.000 | 0.000
0.302 | 0.375
0.000 | 0.000
0.014 | 0.046
10peptides
spectra
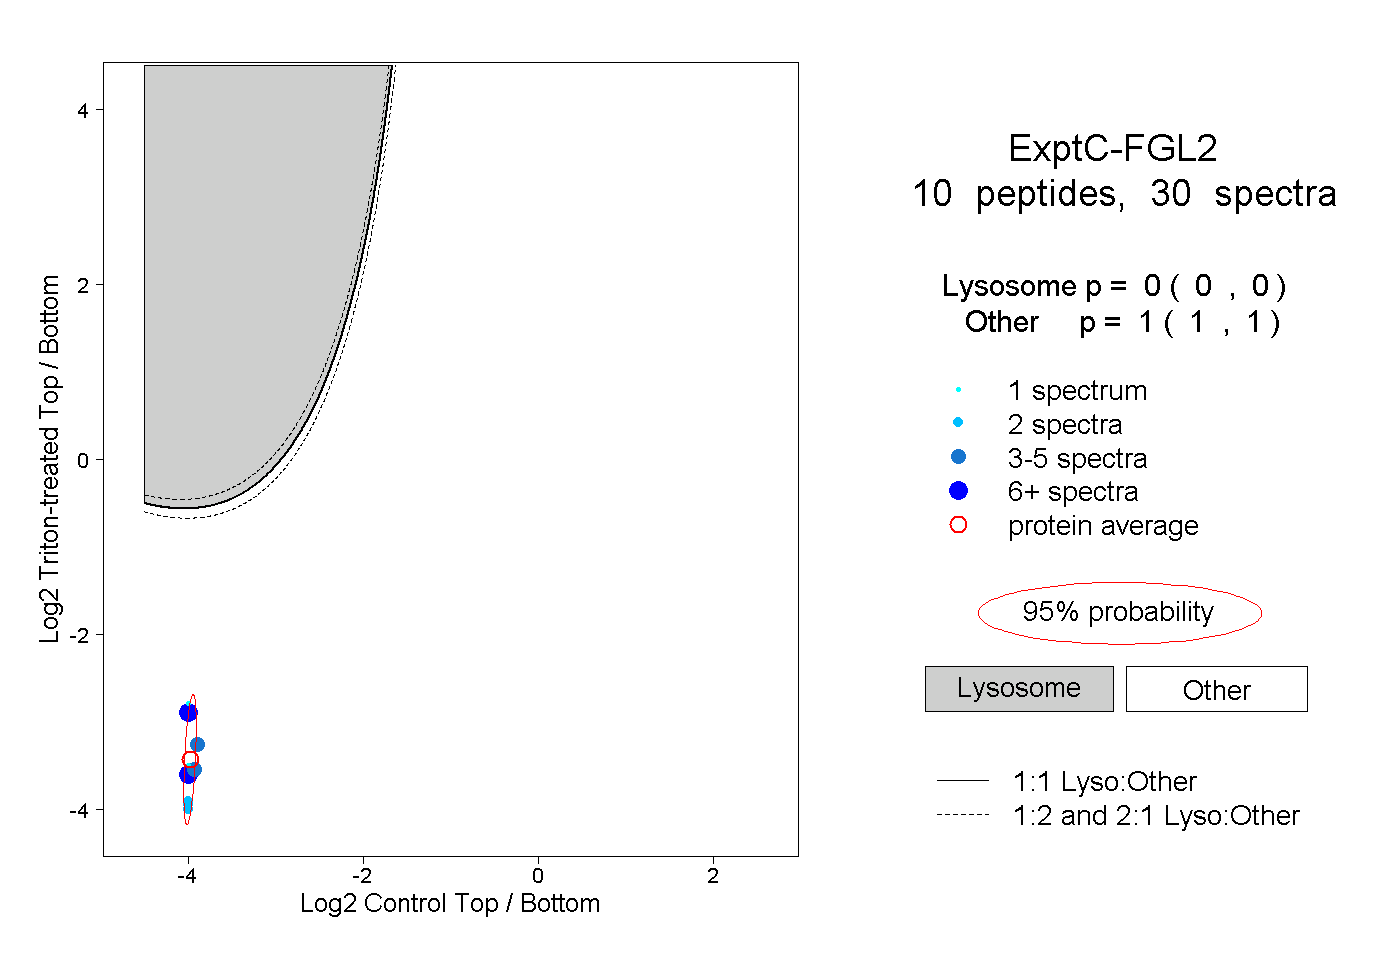
0.000 | 0.000
1.000 | 1.000
1peptide
spectrum
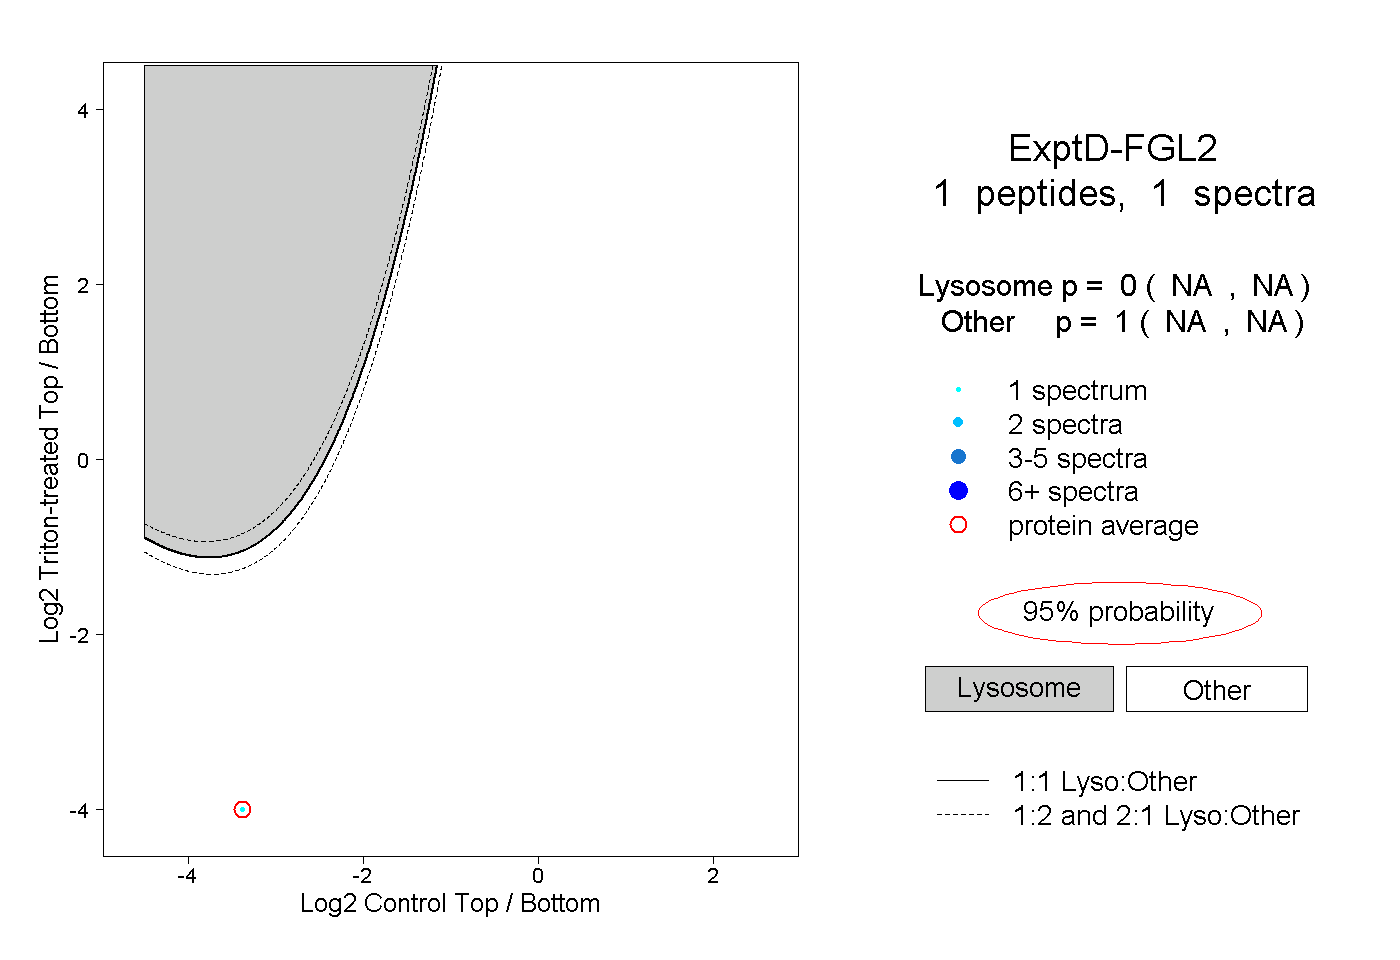
NA | NA
NA | NA