 9
9peptides
spectra
0.046 | 0.087
0.109 | 0.171
0.386 | 0.438
0.000 | 0.000
0.000 | 0.000
0.302 | 0.375
0.000 | 0.000
0.014 | 0.046
| Plot | Mito | Lyso | Perox | ER | Golgi | PM | Cytosol | Nucleus | |||||
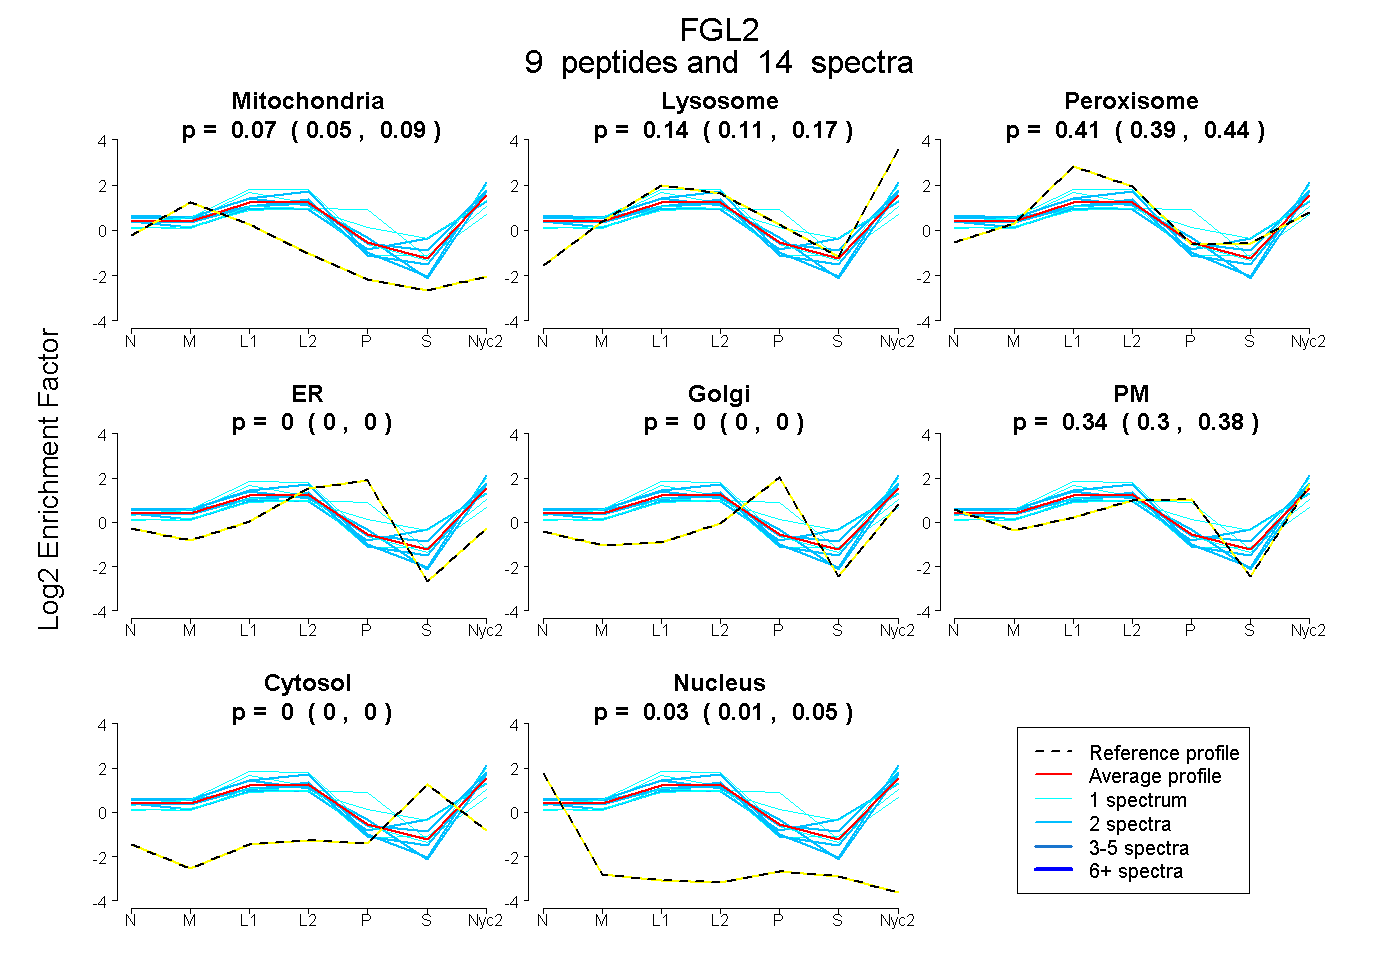
| Expt A |
9 peptides |
14 spectra |
|
0.070 0.046 | 0.087 |
0.142 0.109 | 0.171 |
0.413 0.386 | 0.438 |
0.000 0.000 | 0.000 |
0.000 0.000 | 0.000 |
0.343 0.302 | 0.375 |
0.000 0.000 | 0.000 |
0.032 0.014 | 0.046 |
| 2 spectra, VQELESQVNK | 0.000 | 0.295 | 0.378 | 0.000 | 0.000 | 0.230 | 0.001 | 0.096 | ||
| 1 spectrum, MMIRPK | 0.020 | 0.194 | 0.509 | 0.000 | 0.000 | 0.277 | 0.000 | 0.000 | ||
| 1 spectrum, CPSQEHNQPNPVQHLIYK | 0.028 | 0.000 | 0.432 | 0.038 | 0.313 | 0.189 | 0.000 | 0.000 | ||
| 2 spectra, FFTTPDR | 0.100 | 0.232 | 0.302 | 0.000 | 0.000 | 0.366 | 0.000 | 0.000 | ||
| 2 spectra, EFWLGNDK | 0.135 | 0.223 | 0.316 | 0.000 | 0.000 | 0.294 | 0.000 | 0.031 | ||
| 1 spectrum, DCSDYYVLGK | 0.101 | 0.046 | 0.622 | 0.000 | 0.000 | 0.179 | 0.000 | 0.052 | ||
| 2 spectra, AGFGNLER | 0.000 | 0.124 | 0.482 | 0.000 | 0.000 | 0.203 | 0.132 | 0.058 | ||
| 1 spectrum, VTPDHR | 0.000 | 0.092 | 0.412 | 0.000 | 0.000 | 0.345 | 0.151 | 0.000 | ||
| 2 spectra, HYNHDLR | 0.135 | 0.182 | 0.229 | 0.000 | 0.000 | 0.454 | 0.000 | 0.000 |
| Plot | Lyso | Other | |||||||||||
| Expt C |
10 peptides |
30 spectra |
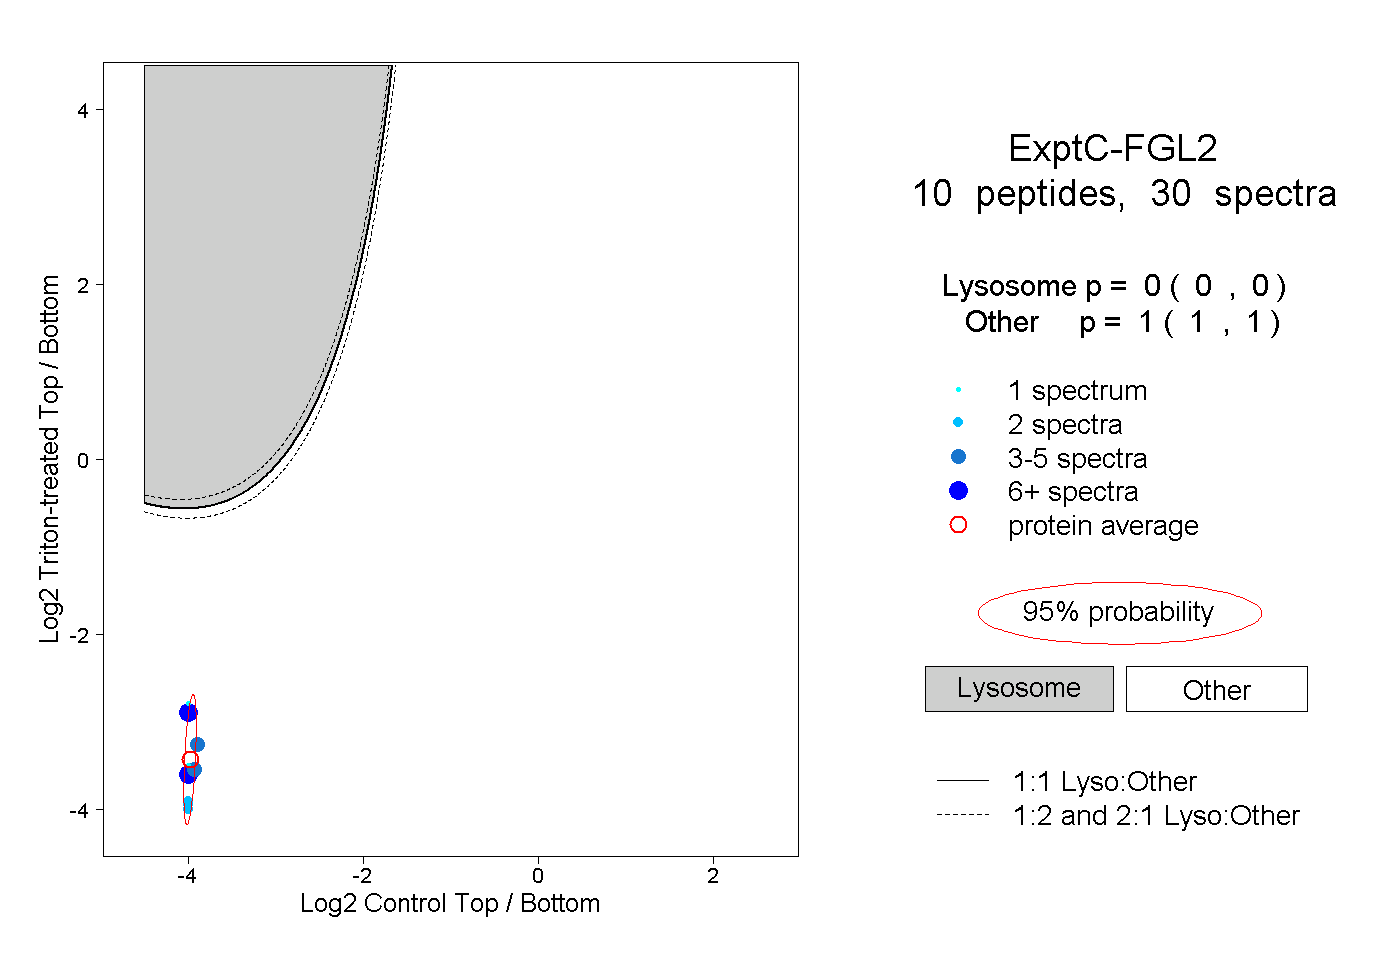 |
0.000 0.000 | 0.000 |
1.000 1.000 | 1.000 |
||||||||
| Plot | Lyso | Other | |||||||||||
| Expt D |
1 peptide |
1 spectrum |
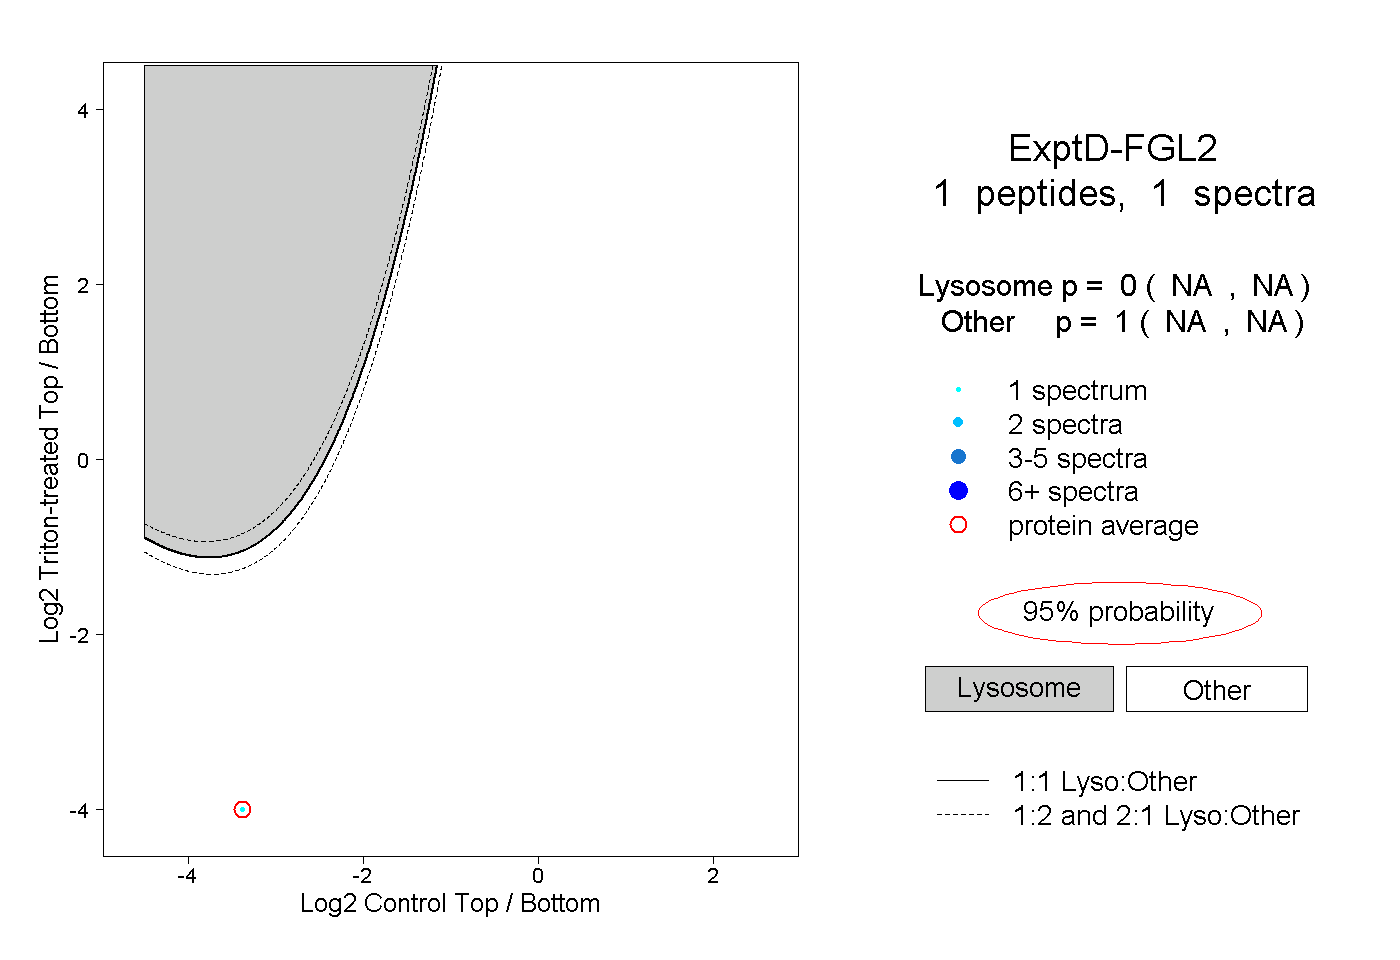 |
0.000 NA | NA |
1.000 NA | NA |