 9
9peptides
spectra
0.046 | 0.087
0.109 | 0.171
0.386 | 0.438
0.000 | 0.000
0.000 | 0.000
0.302 | 0.375
0.000 | 0.000
0.014 | 0.046
10peptides
spectra
0.000 | 0.000
1.000 | 1.000
| Plot | Mito | Lyso | Perox | ER | Golgi | PM | Cytosol | Nucleus | |||||
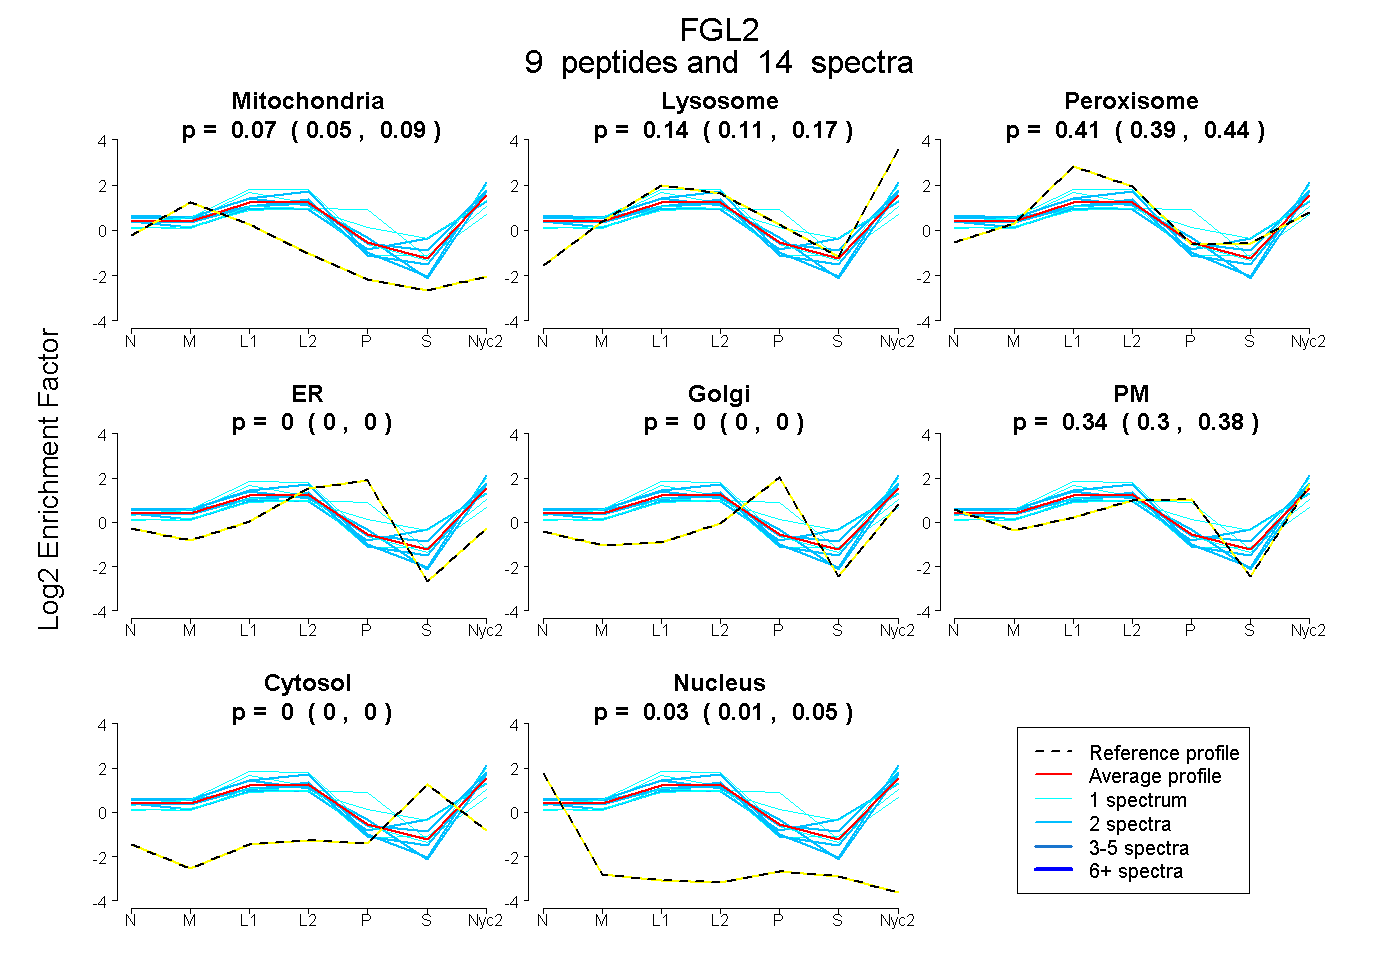
| Expt A |
9 peptides |
14 spectra |
|
0.070 0.046 | 0.087 |
0.142 0.109 | 0.171 |
0.413 0.386 | 0.438 |
0.000 0.000 | 0.000 |
0.000 0.000 | 0.000 |
0.343 0.302 | 0.375 |
0.000 0.000 | 0.000 |
0.032 0.014 | 0.046 |
||
| Plot | Lyso | Other | |||||||||||
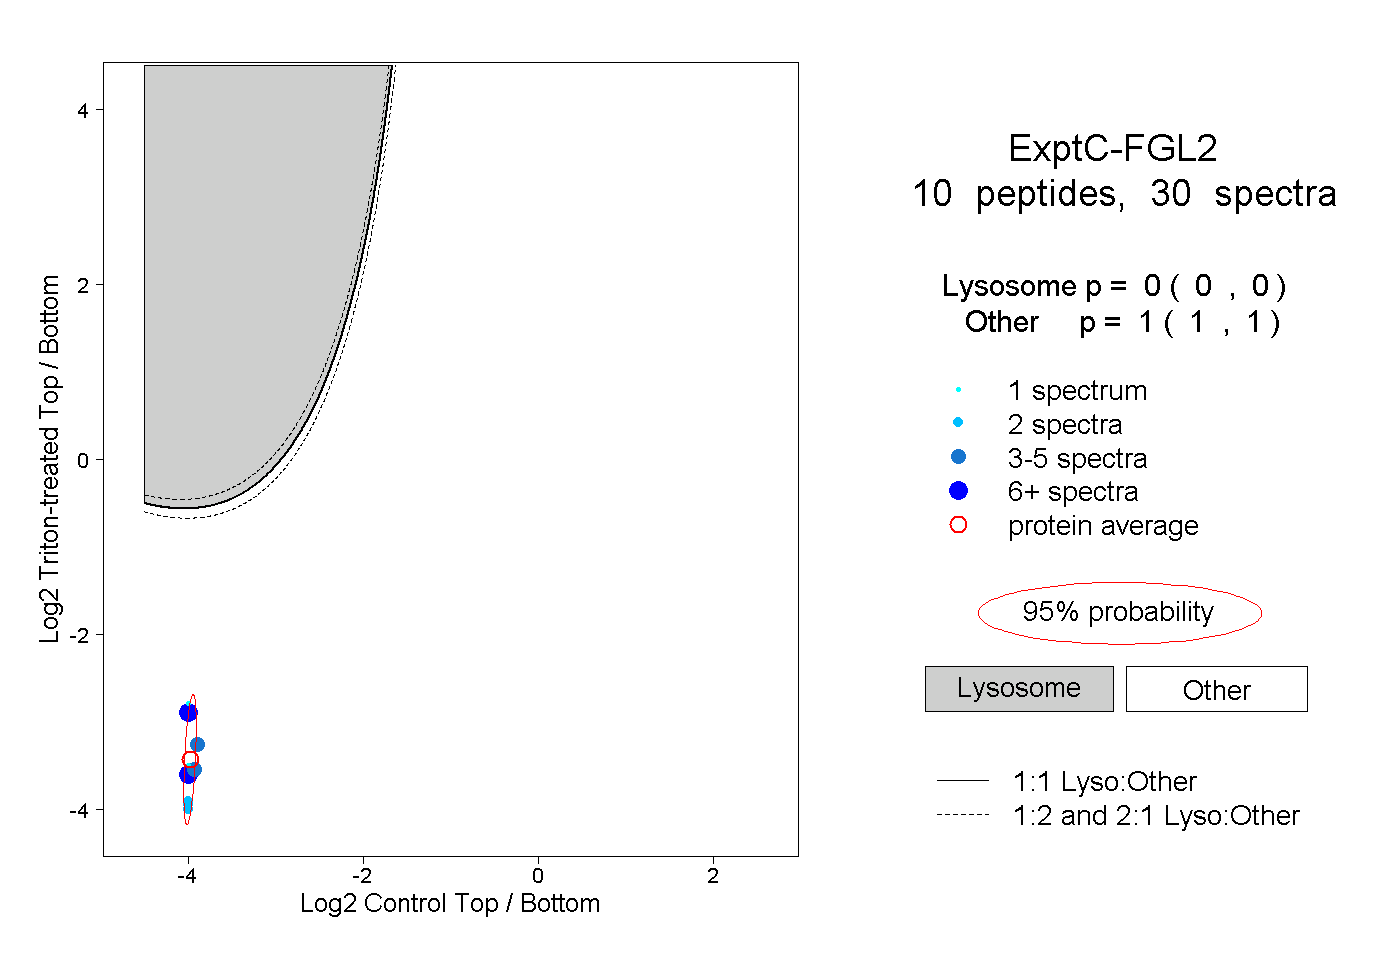
| Expt C |
10 peptides |
30 spectra |
|
0.000 0.000 | 0.000 |
1.000 1.000 | 1.000 |
| 1 spectrum, VQELESQVNK | 0.000 | 1.000 | ||||||||
| 1 spectrum, LEGSGR | 0.000 | 1.000 | ||||||||
| 6 spectra, EEIQGLQGR | 0.000 | 1.000 | ||||||||
| 3 spectra, SCQDCK | 0.000 | 1.000 | ||||||||
| 2 spectra, FFTTPDR | 0.000 | 1.000 | ||||||||
| 3 spectra, EFWLGNDK | 0.000 | 1.000 | ||||||||
| 2 spectra, DCSDYYVLGK | 0.000 | 1.000 | ||||||||
| 2 spectra, LSSELK | 0.000 | 1.000 | ||||||||
| 8 spectra, AGFGNLER | 0.000 | 1.000 | ||||||||
| 2 spectra, VTPDHR | 0.000 | 1.000 |
| Plot | Lyso | Other | |||||||||||
| Expt D |
1 peptide |
1 spectrum |
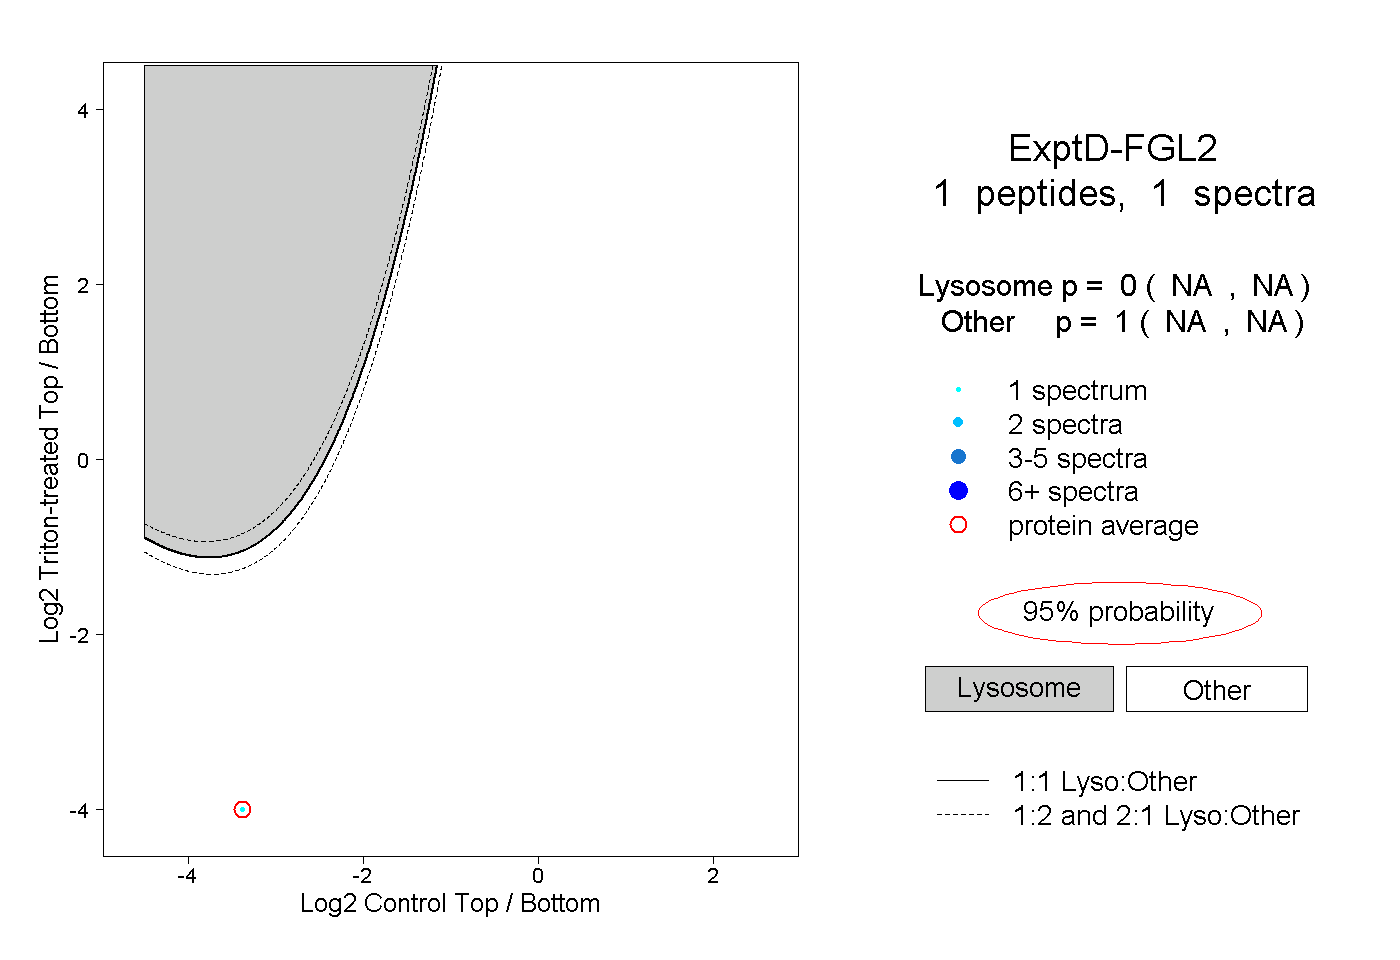 |
0.000 NA | NA |
1.000 NA | NA |