 8
8peptides
spectra
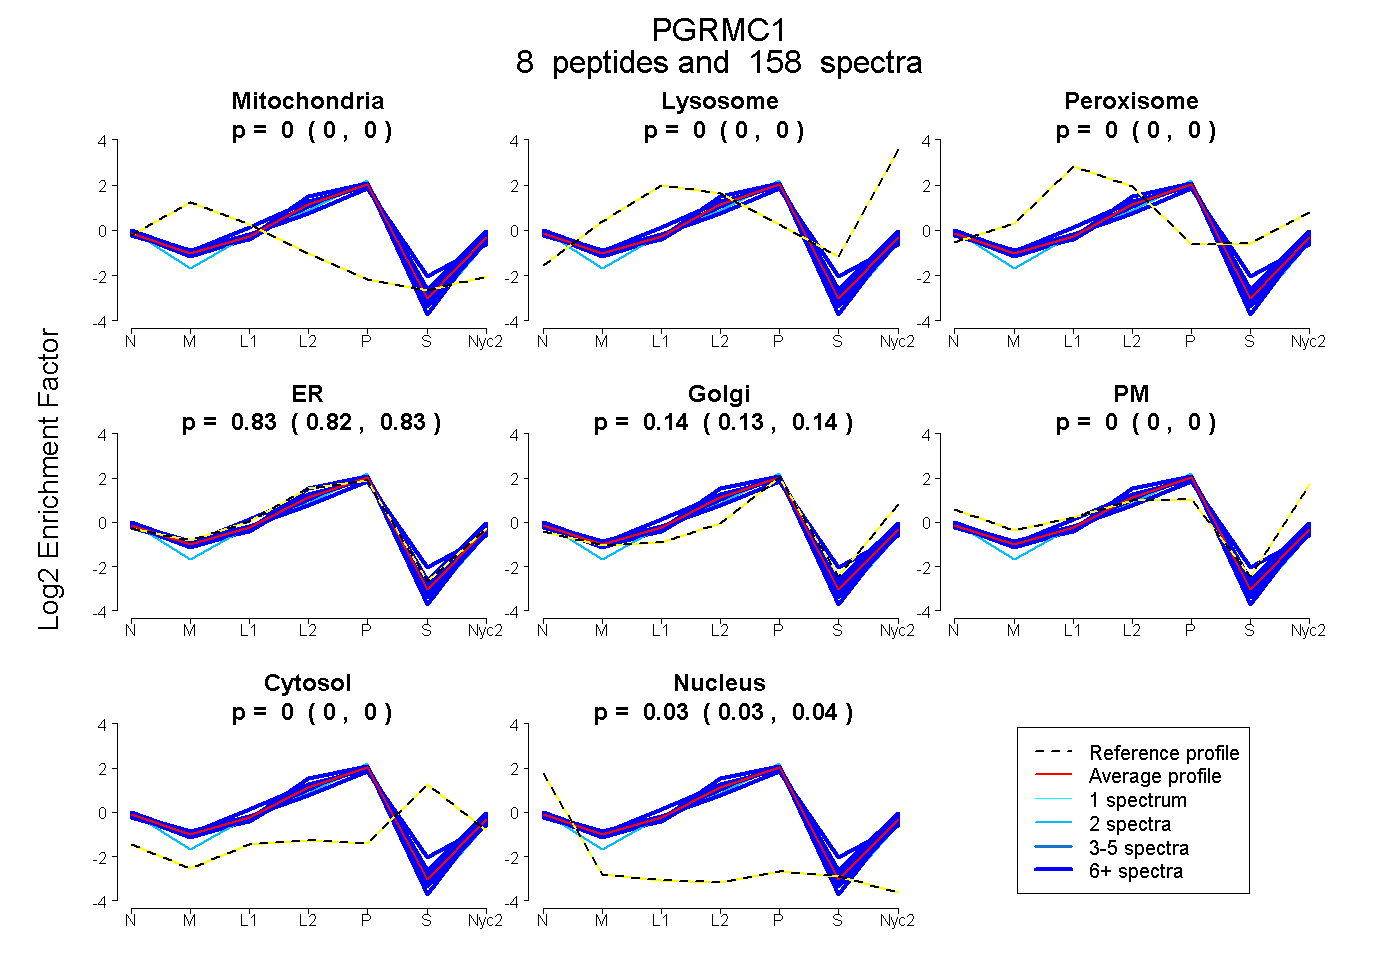
0.000 | 0.000
0.000 | 0.000
0.000 | 0.000
0.820 | 0.830
0.135 | 0.145
0.000 | 0.000
0.000 | 0.000
0.034 | 0.036
8peptides
spectra
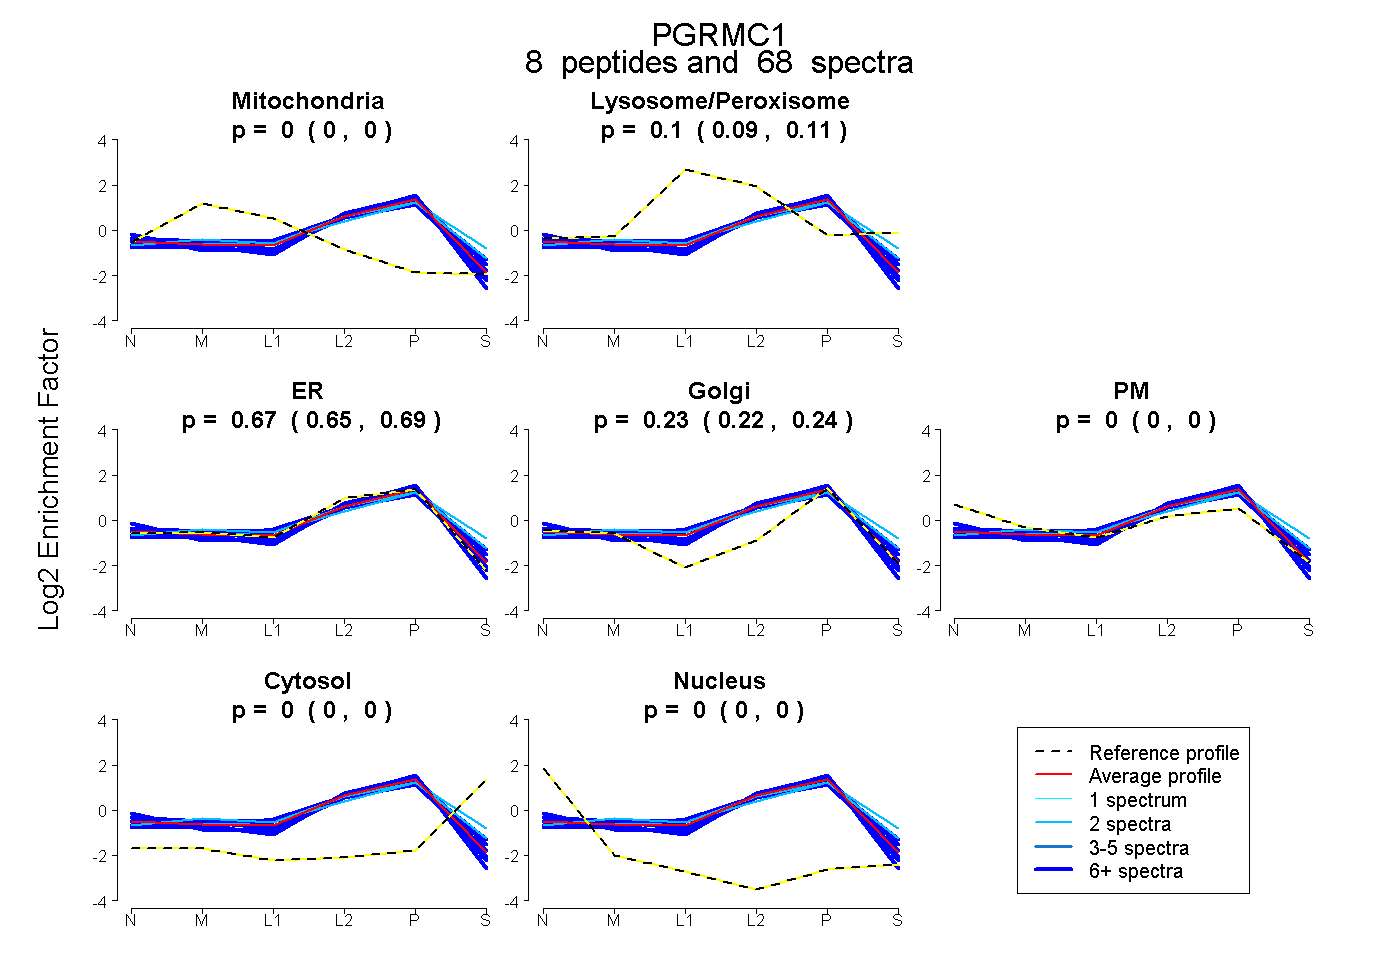
0.000 | 0.000
0.090 | 0.106
0.648 | 0.686
0.219 | 0.242
0.000 | 0.000
0.000 | 0.000
0.000 | 0.000
4peptides
spectra
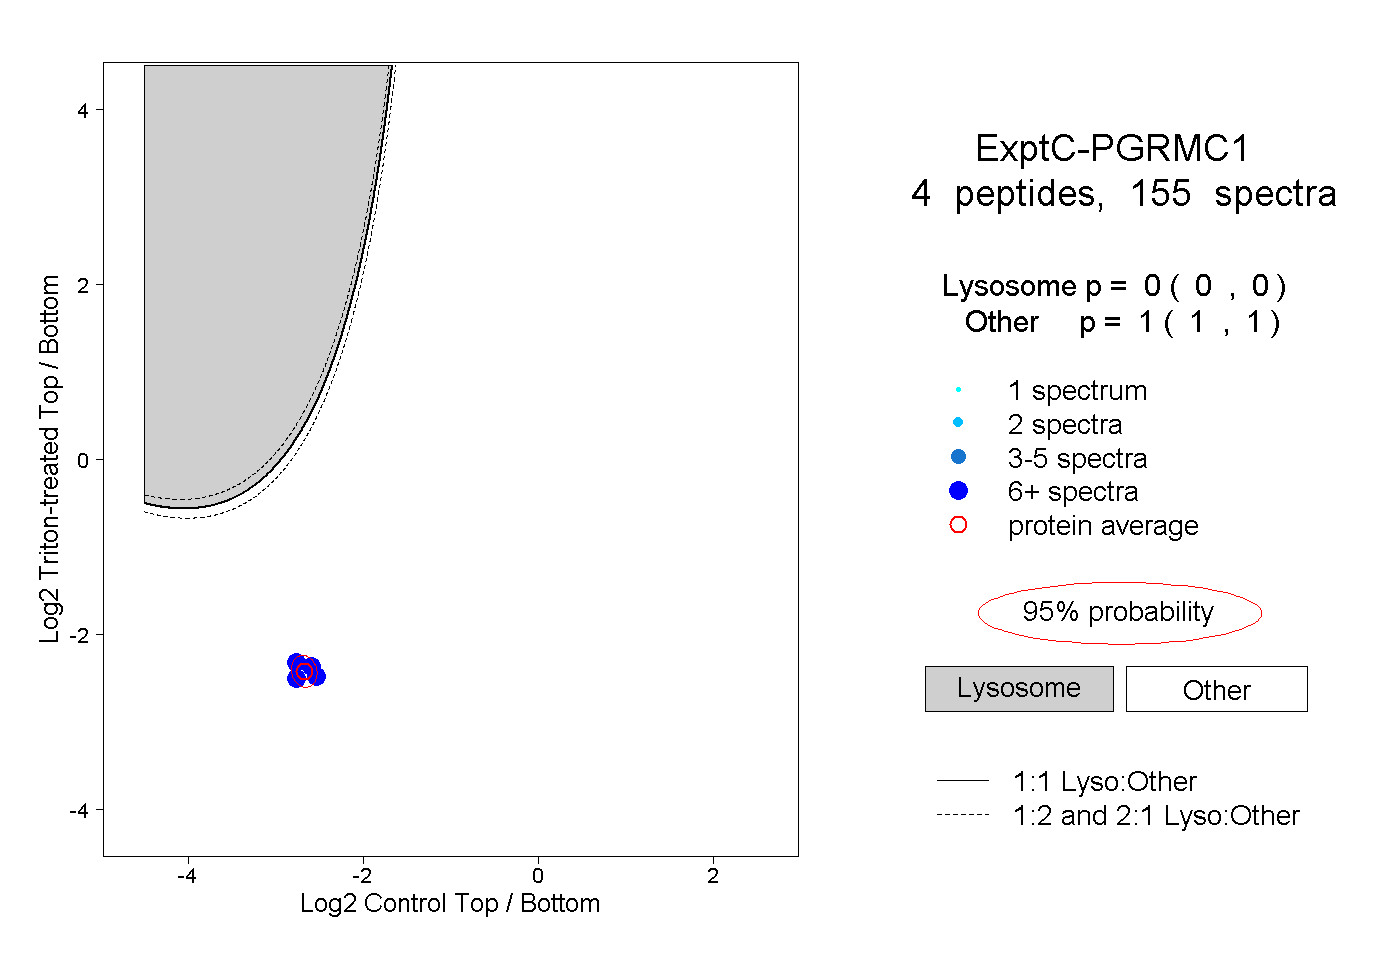
0.000 | 0.000
1.000 | 1.000
5peptides
spectra
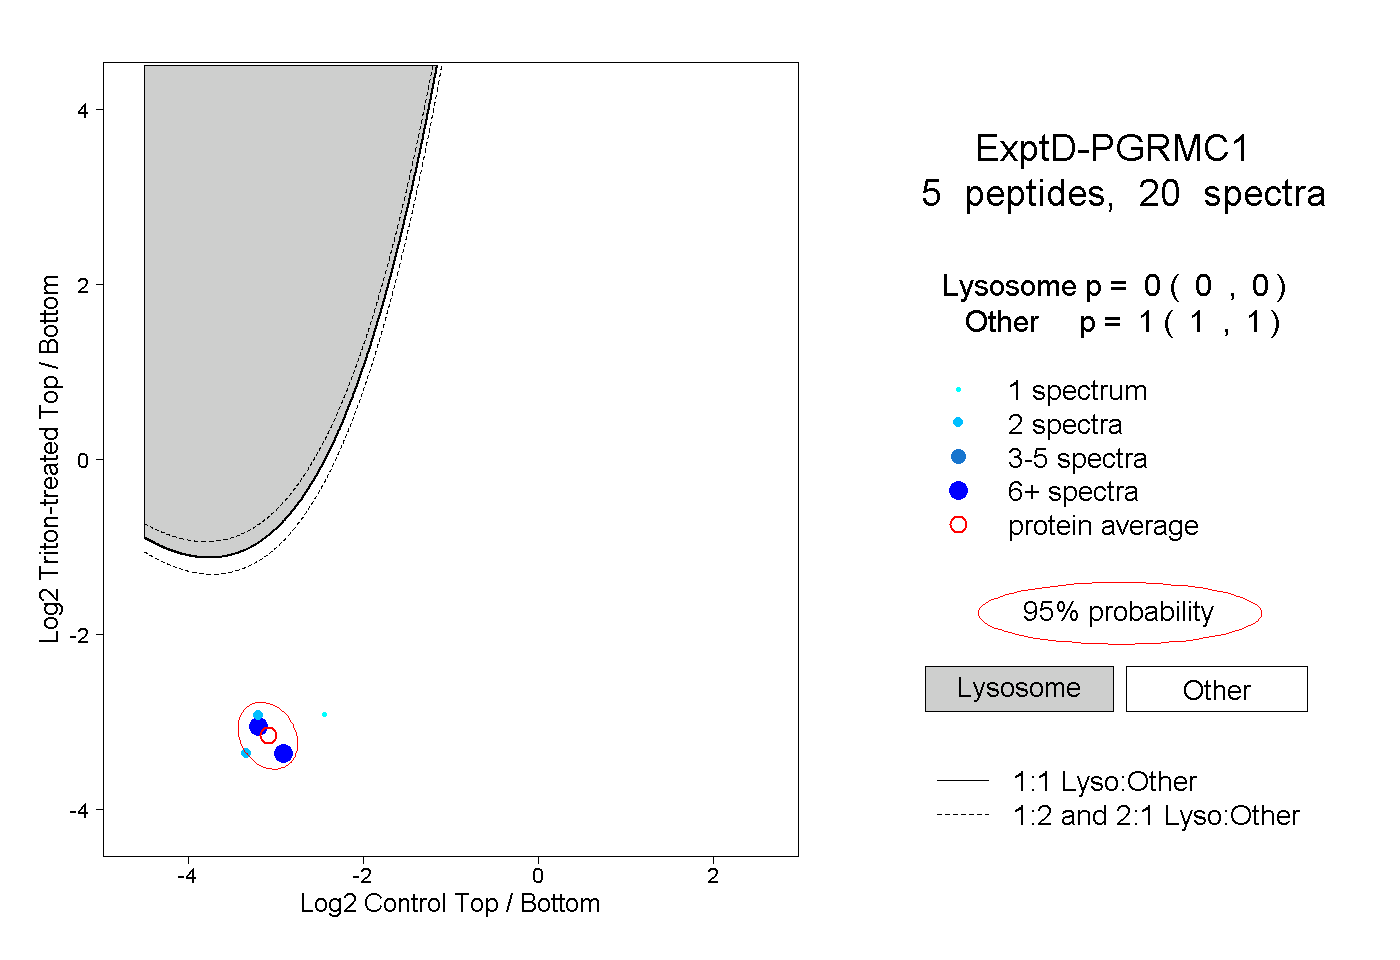
0.000 | 0.000
1.000 | 1.000