 8
8peptides
spectra
0.000 | 0.000
0.000 | 0.000
0.000 | 0.000
0.820 | 0.830
0.135 | 0.145
0.000 | 0.000
0.000 | 0.000
0.034 | 0.036
| Plot | Mito | Lyso | Perox | ER | Golgi | PM | Cytosol | Nucleus | |||||
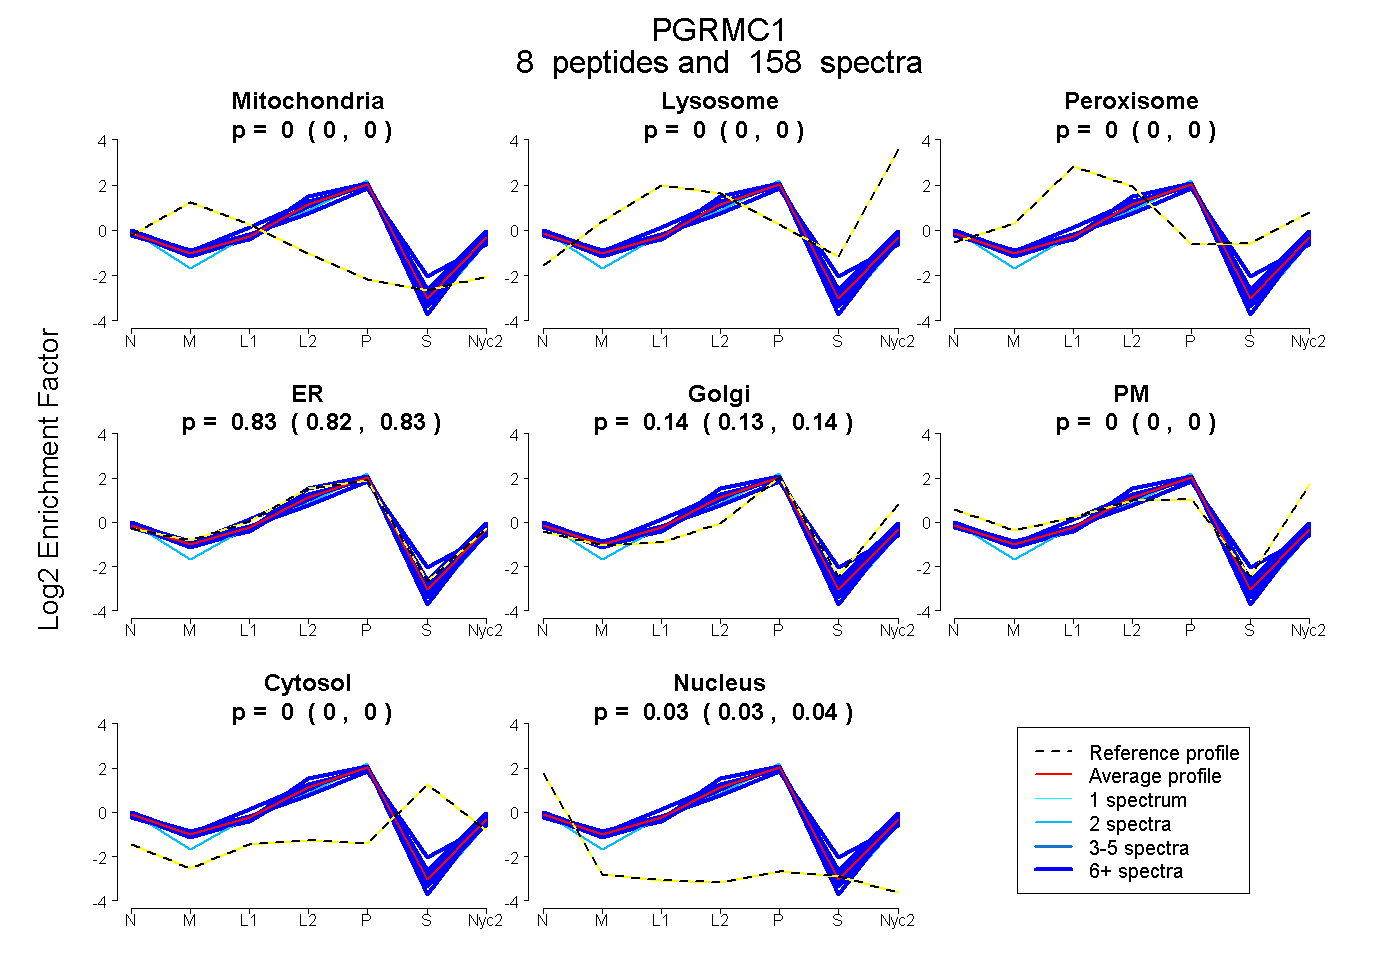
| Expt A |
8 peptides |
158 spectra |
|
0.000 0.000 | 0.000 |
0.000 0.000 | 0.000 |
0.000 0.000 | 0.000 |
0.825 0.820 | 0.830 |
0.140 0.135 | 0.145 |
0.000 0.000 | 0.000 |
0.000 0.000 | 0.000 |
0.035 0.034 | 0.036 |
| 14 spectra, FYGPEGPYGVFAGR | 0.000 | 0.000 | 0.000 | 0.774 | 0.197 | 0.000 | 0.000 | 0.029 | ||
| 28 spectra, YDGVQDPR | 0.000 | 0.000 | 0.000 | 0.897 | 0.052 | 0.000 | 0.000 | 0.051 | ||
| 41 spectra, DFTPAELR | 0.000 | 0.000 | 0.000 | 0.793 | 0.162 | 0.000 | 0.000 | 0.045 | ||
| 9 spectra, GLATFCLDK | 0.001 | 0.000 | 0.000 | 0.776 | 0.104 | 0.000 | 0.088 | 0.032 | ||
| 20 spectra, ILMAINGK | 0.000 | 0.000 | 0.000 | 0.947 | 0.038 | 0.000 | 0.000 | 0.015 | ||
| 2 spectra, GDQPGASGDNDDDEPPPLPR | 0.000 | 0.000 | 0.000 | 0.819 | 0.105 | 0.000 | 0.000 | 0.076 | ||
| 18 spectra, VFDVTK | 0.000 | 0.000 | 0.000 | 0.720 | 0.269 | 0.000 | 0.000 | 0.011 | ||
| 26 spectra, YHHVGK | 0.000 | 0.000 | 0.000 | 0.884 | 0.029 | 0.068 | 0.000 | 0.019 |
| Plot | Mito | Lyso or Perox | ER | Golgi | PM | Cytosol | Nucleus | ||||||
| Expt B |
8 peptides |
68 spectra |
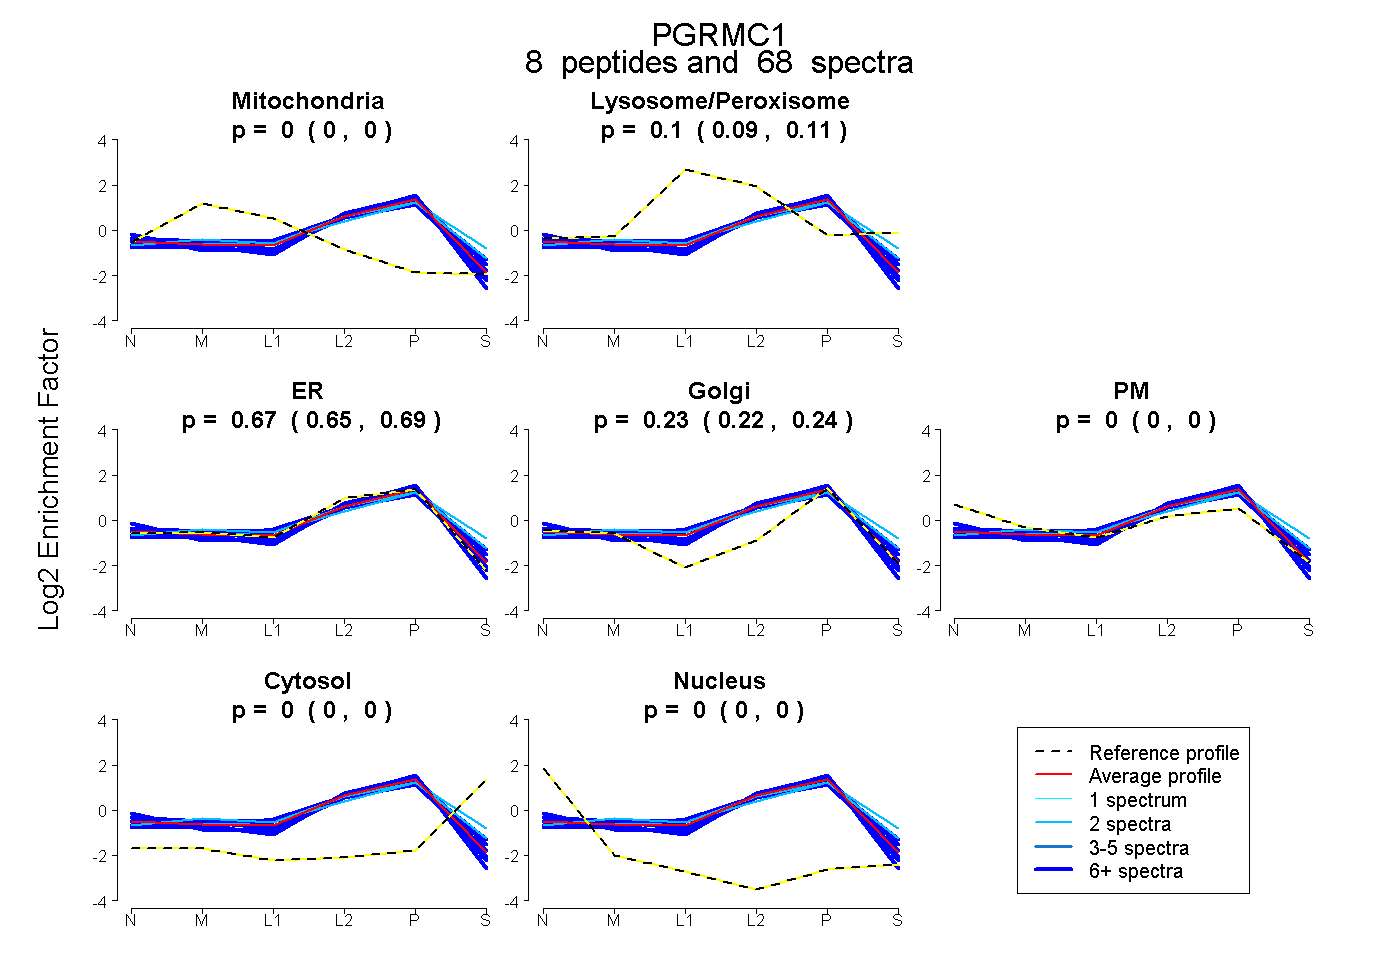 |
0.000 0.000 | 0.000 |
0.099 0.090 | 0.106 |
0.670 0.648 | 0.686 |
0.231 0.219 | 0.242 |
0.000 0.000 | 0.000 |
0.000 0.000 | 0.000 |
0.000 0.000 | 0.000 |
|||
| Plot | Lyso | Other | |||||||||||
| Expt C |
4 peptides |
155 spectra |
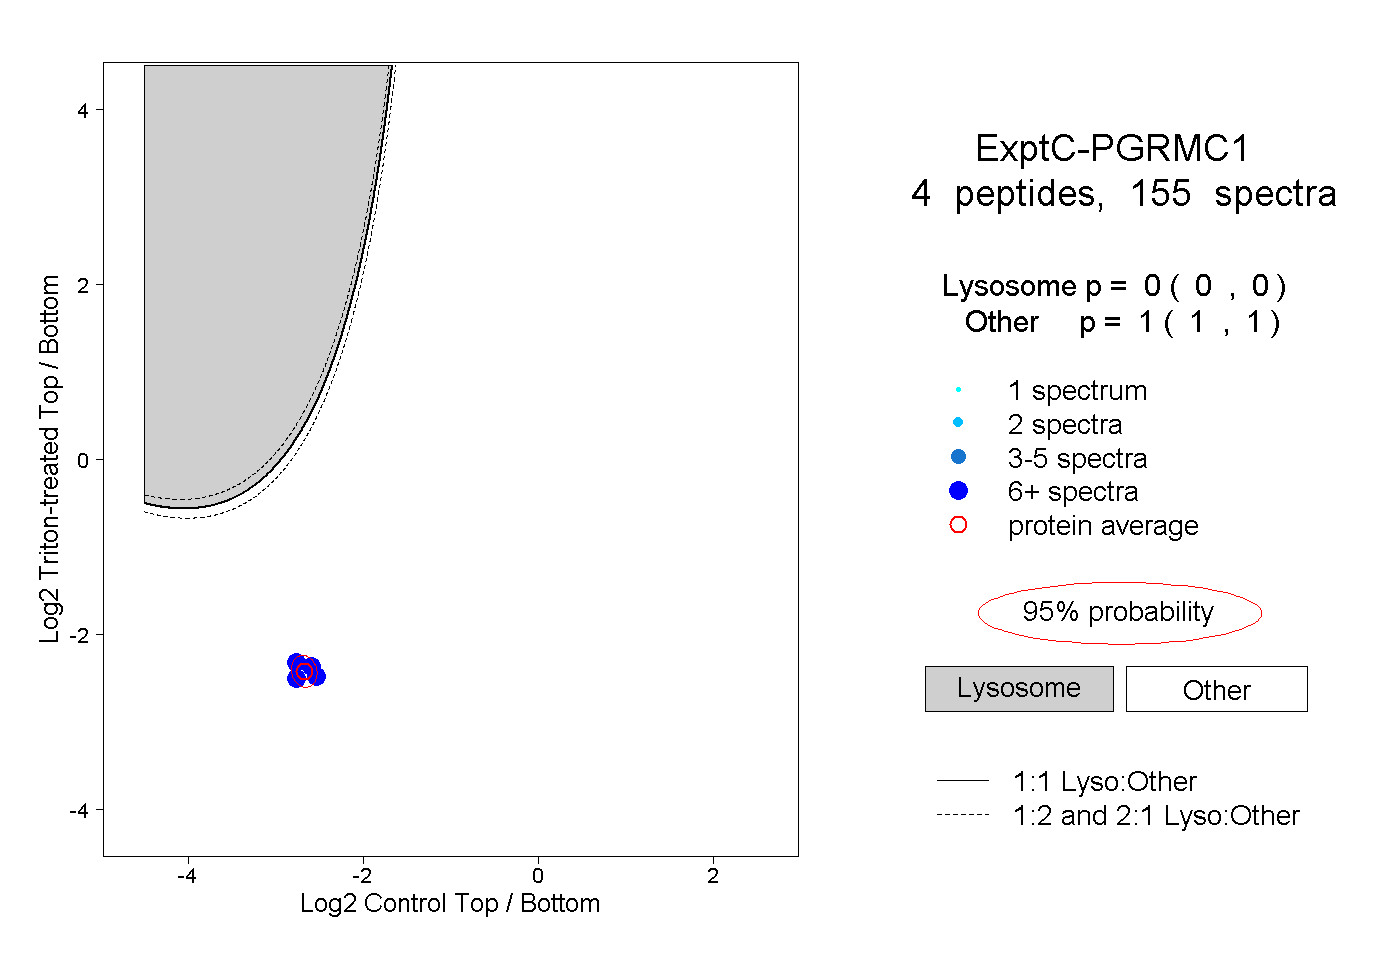 |
0.000 0.000 | 0.000 |
1.000 1.000 | 1.000 |
||||||||
| Plot | Lyso | Other | |||||||||||
| Expt D |
5 peptides |
20 spectra |
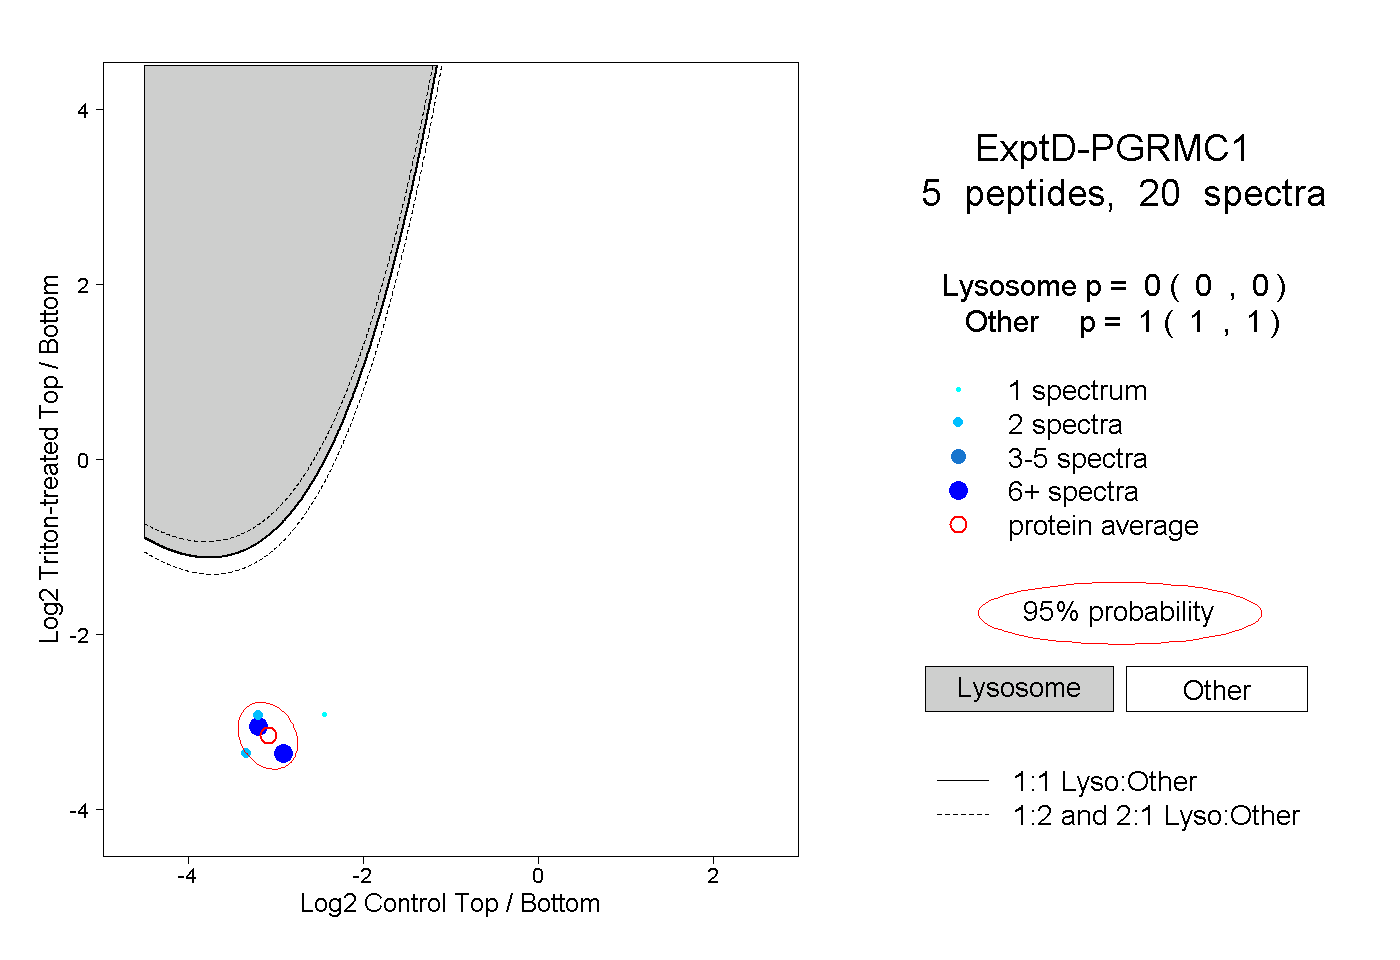 |
0.000 0.000 | 0.000 |
1.000 1.000 | 1.000 |