 12
12peptides
spectra
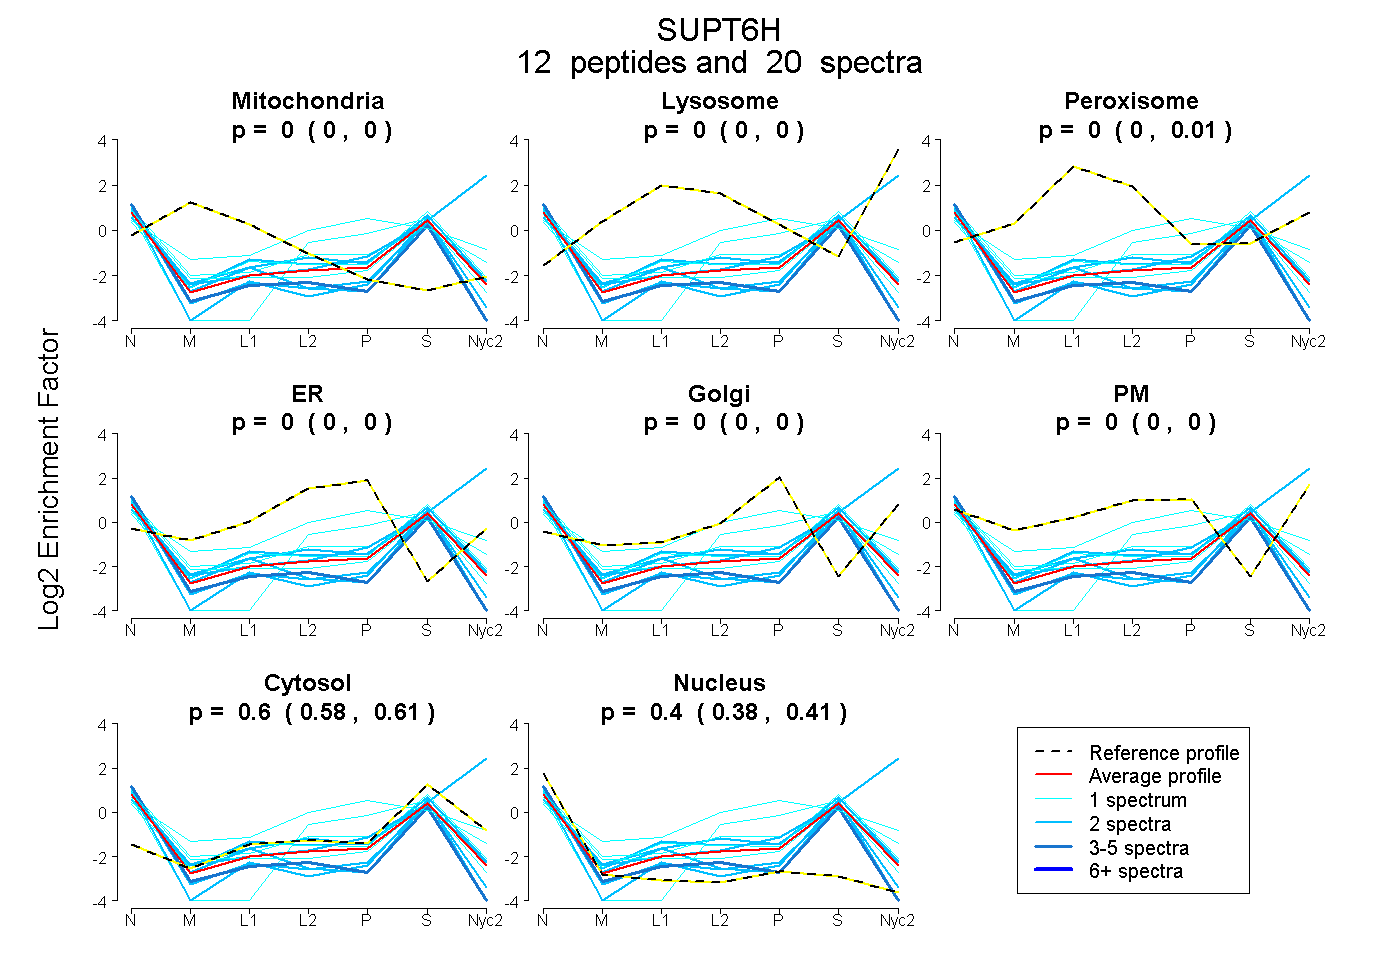
0.000 | 0.000
0.000 | 0.000
0.000 | 0.007
0.000 | 0.000
0.000 | 0.000
0.000 | 0.000
0.584 | 0.613
0.383 | 0.413
2peptides
spectra
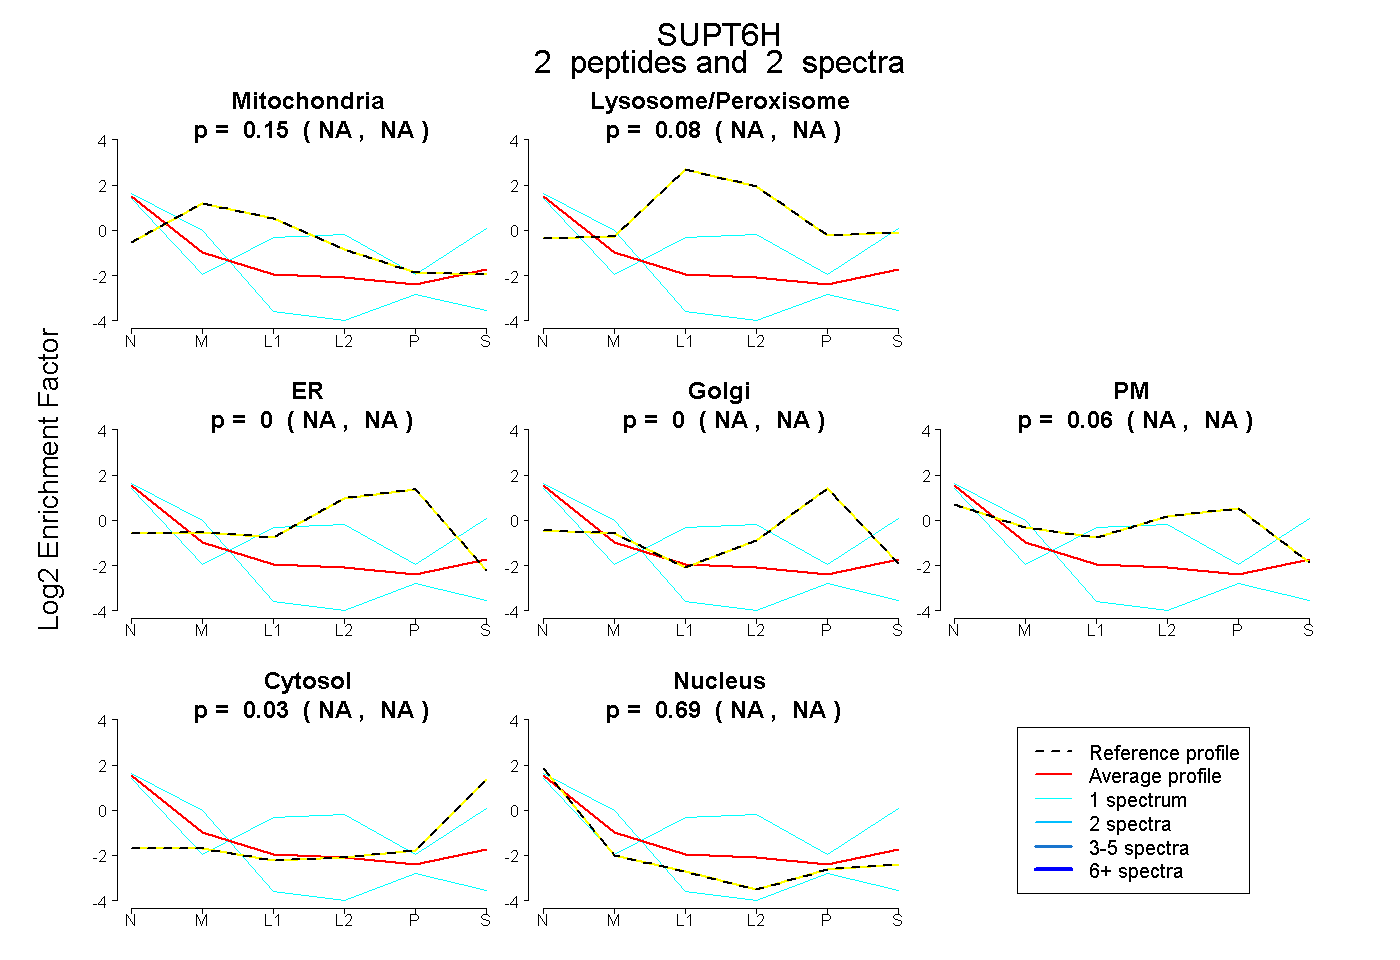
NA | NA
NA | NA
NA | NA
NA | NA
NA | NA
NA | NA
NA | NA
5peptides
spectra
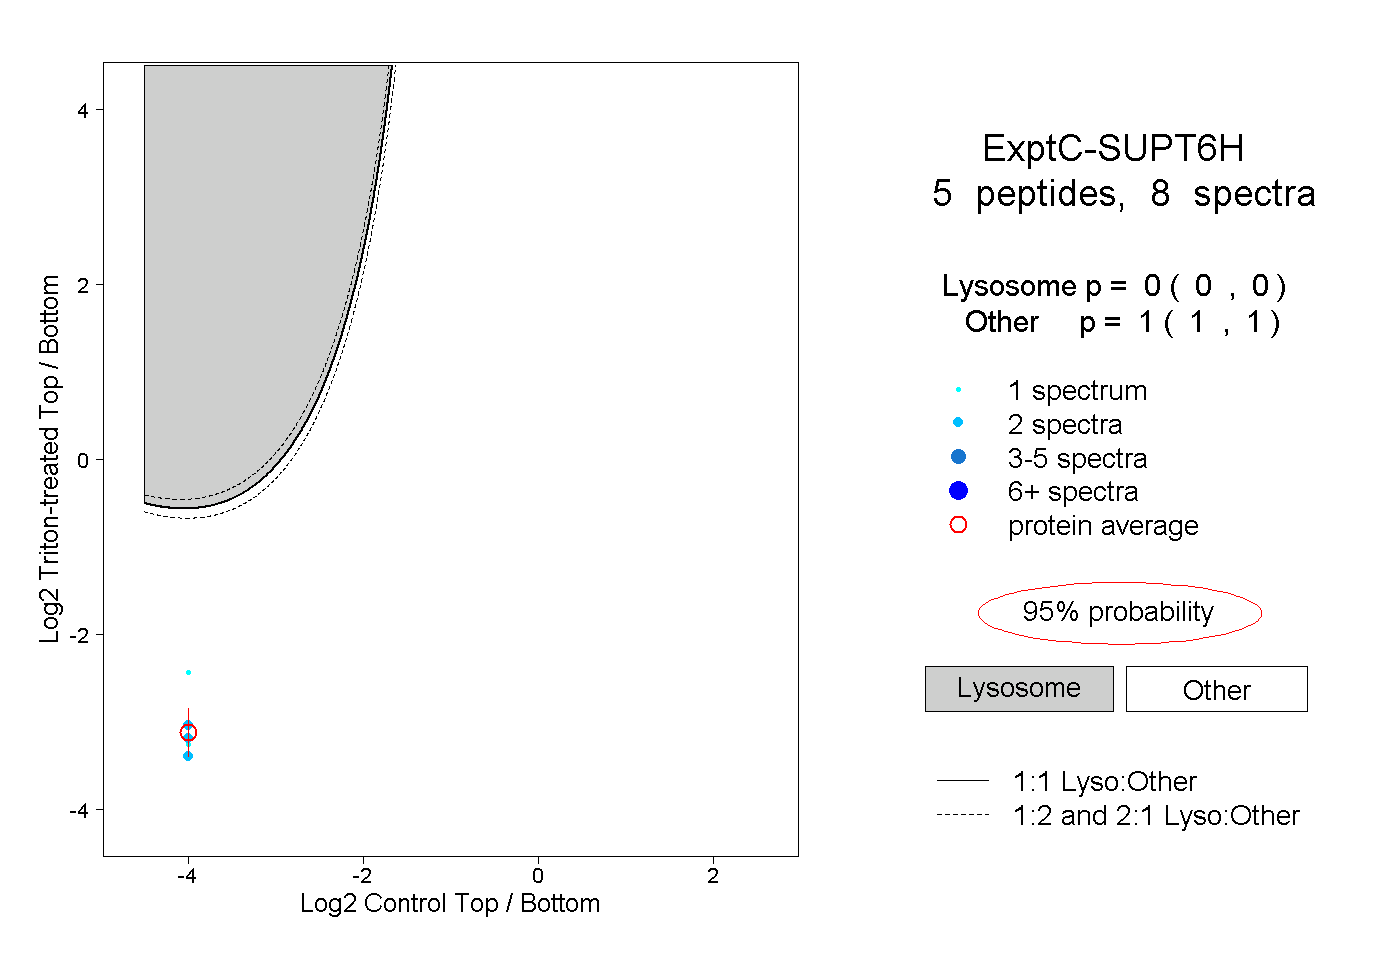
0.000 | 0.000
1.000 | 1.000