SUPT6H
[ENSRNOP00000016759]
Main page
| | | Plot |
Mito |
Lyso |
|
Perox |
ER |
Golgi |
PM |
Cytosol |
Nucleus |
|
| Expt A |
 12
12
peptides |
20
spectra |
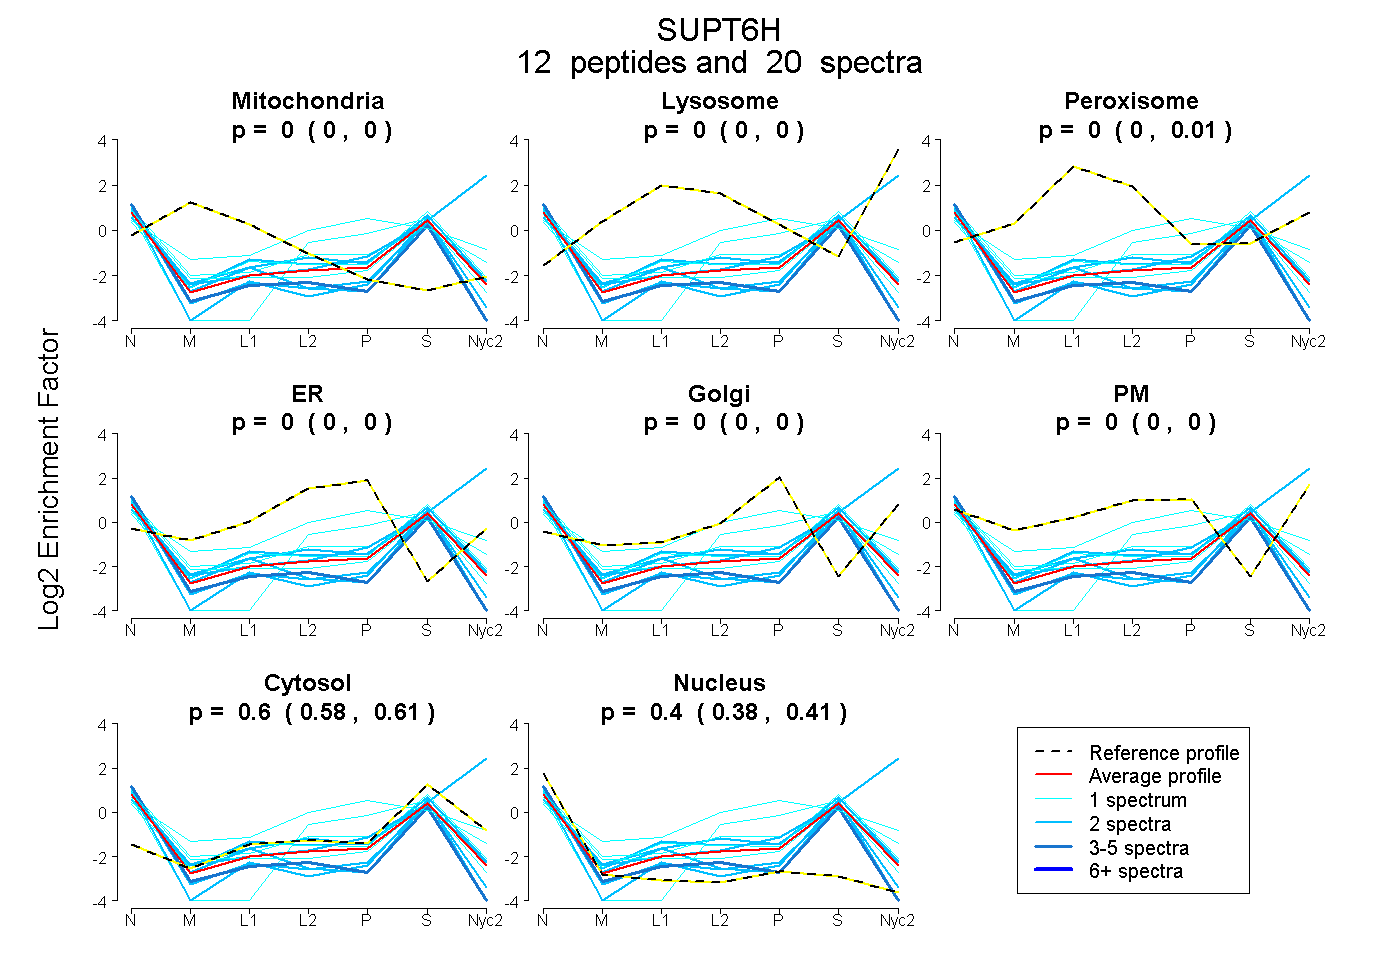 |
0.000
0.000 | 0.000 |
0.000
0.000 | 0.000 |
|
0.000
0.000 | 0.007 |
0.000
0.000 | 0.000 |
0.000
0.000 | 0.000 |
0.000
0.000 | 0.000 |
0.602
0.584 | 0.613 |
0.398
0.383 | 0.413 |
|
| | | Plot |
Mito |
|
Lyso or Perox |
|
ER |
Golgi |
PM |
Cytosol |
Nucleus |
|
| Expt B |
2
peptides |
2
spectra |
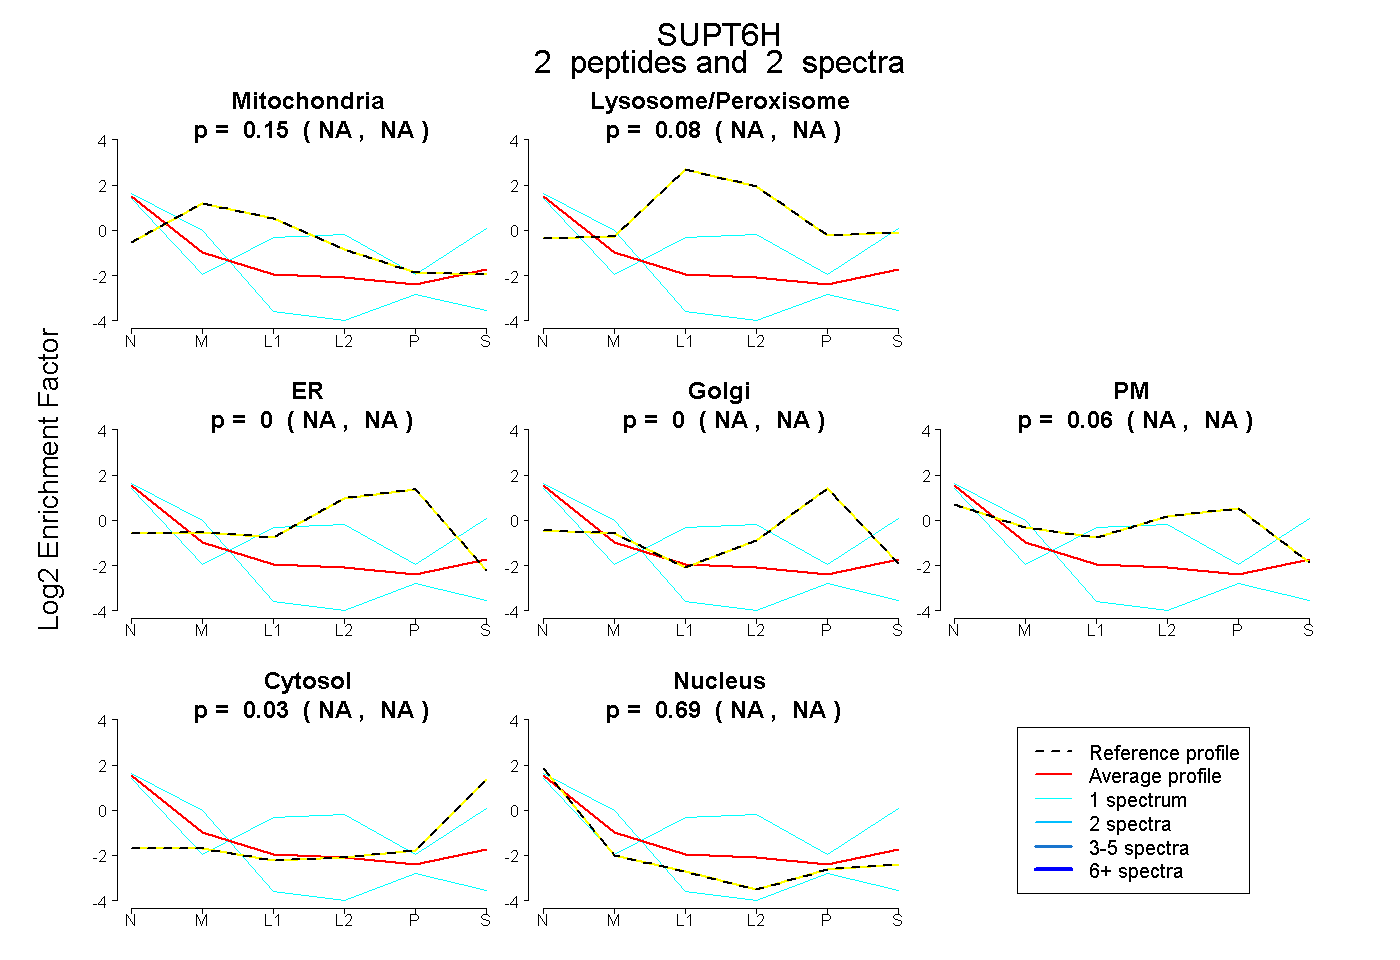 |
0.148
NA | NA |
|
0.075
NA | NA |
|
0.000
NA | NA |
0.000
NA | NA |
0.063
NA | NA |
0.025
NA | NA |
0.688
NA | NA |
|
| | | Plot |
|
Lyso |
|
|
|
|
|
|
|
Other |
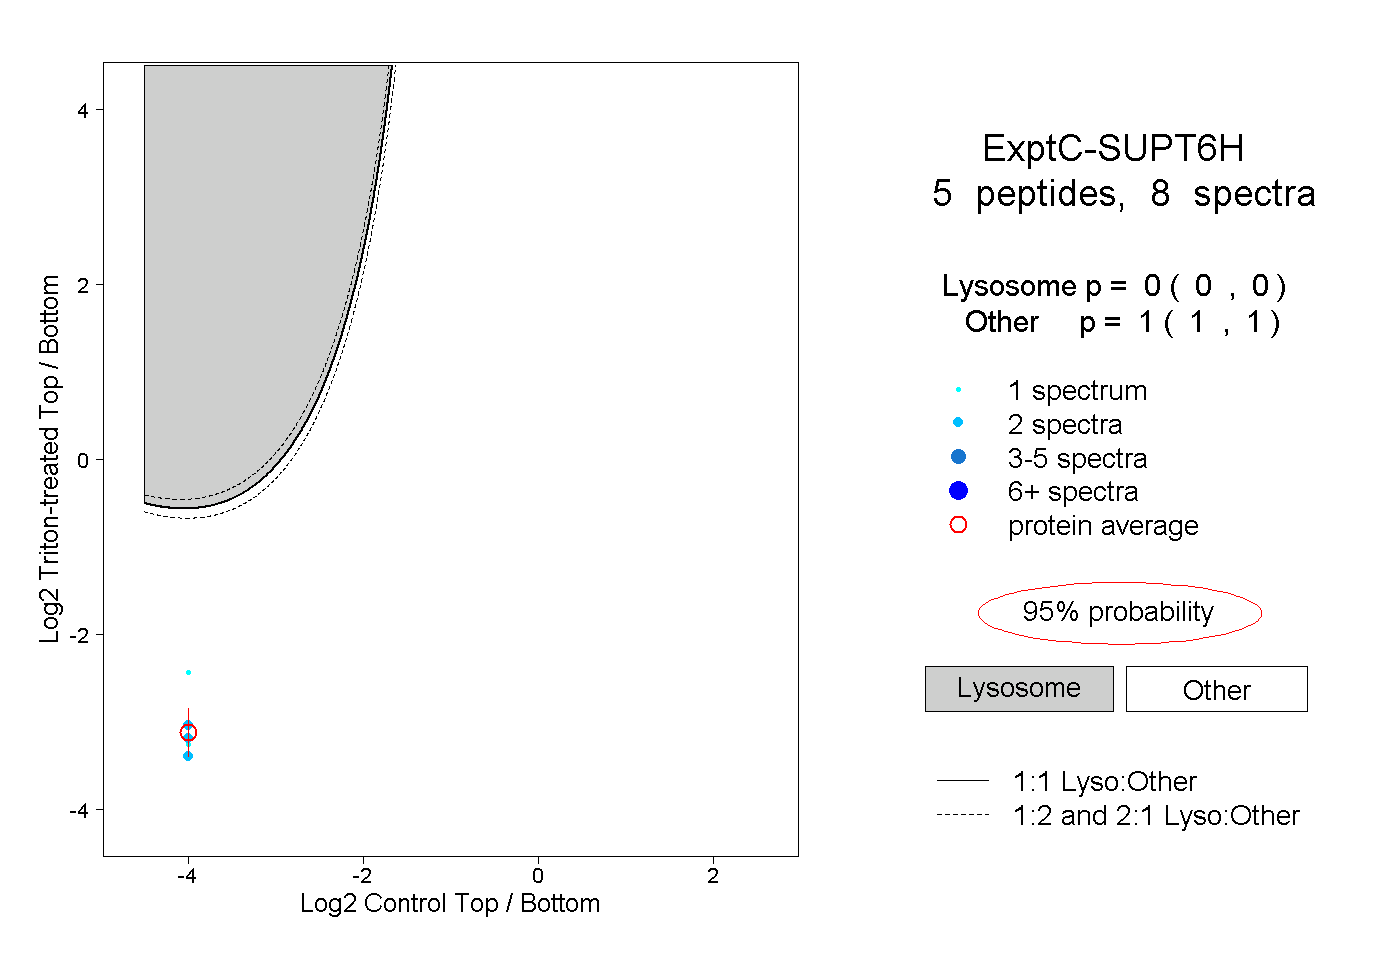
| Expt C |
5
peptides |
8
spectra |
 |
|
0.000
0.000 | 0.000 |
|
|
|
|
|
|
|
1.000
1.000 | 1.000 |
| 1 spectrum, MQNAAK |
|
0.000 |
|
|
|
|
|
|
|
1.000 |
| 1 spectrum, GQPTSSFSR |
|
0.000 |
|
|
|
|
|
|
|
1.000 |
| 2 spectra, ALDTTDMER |
|
0.000 |
|
|
|
|
|
|
|
1.000 |
| 2 spectra, RPQGESYDQAIR |
|
0.000 |
|
|
|
|
|
|
|
1.000 |
| 2 spectra, ATDLPER |
|
0.000 |
|
|
|
|
|
|
|
1.000 |