 14
14peptides
spectra
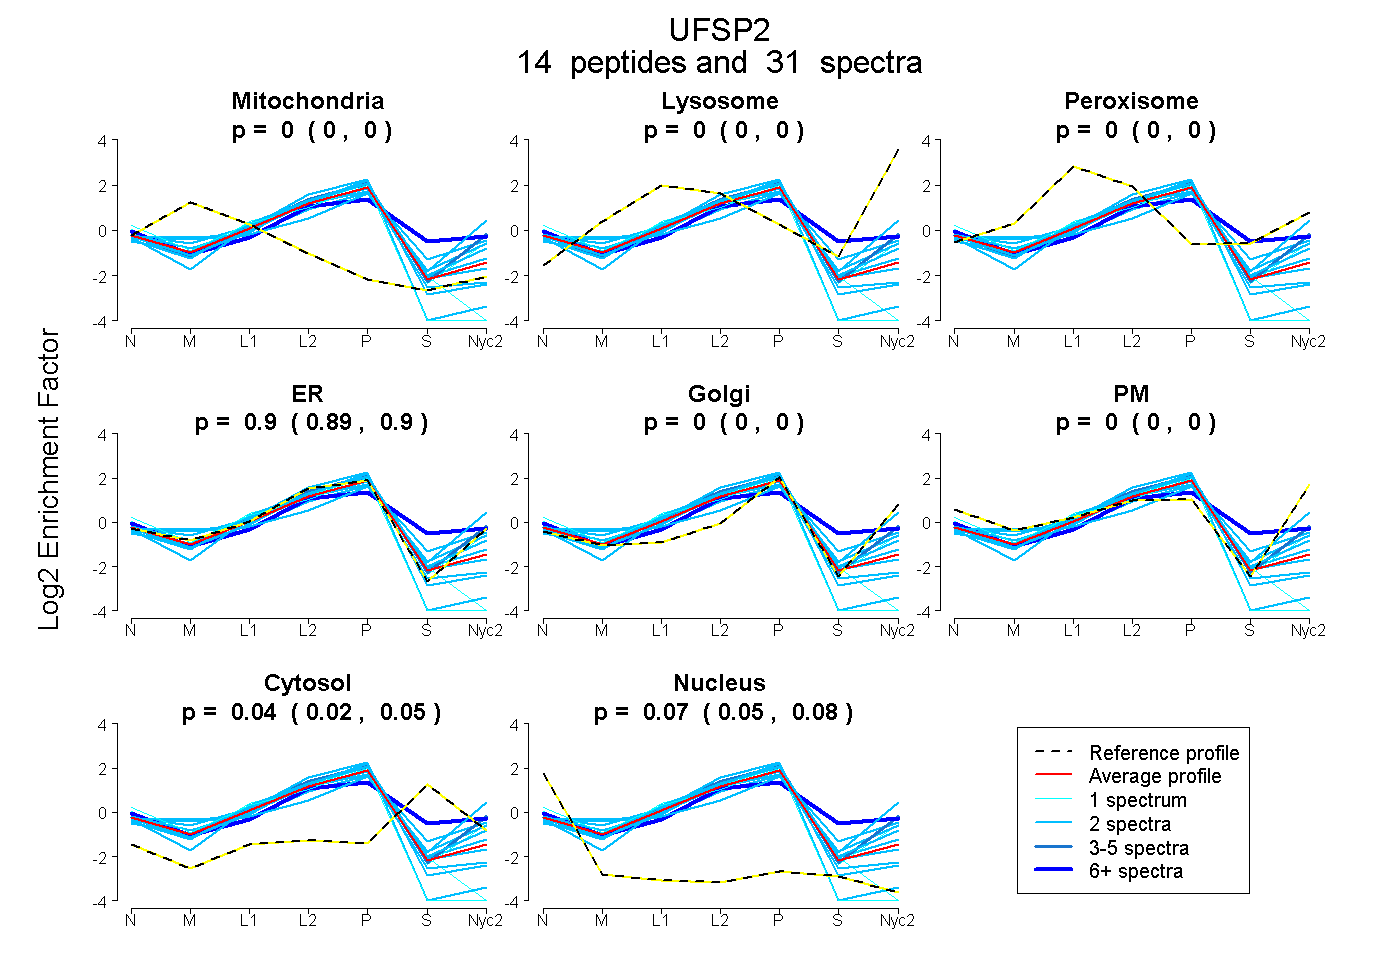
0.000 | 0.001
0.000 | 0.000
0.000 | 0.000
0.888 | 0.905
0.000 | 0.000
0.000 | 0.000
0.020 | 0.050
0.054 | 0.076
9peptides
spectra
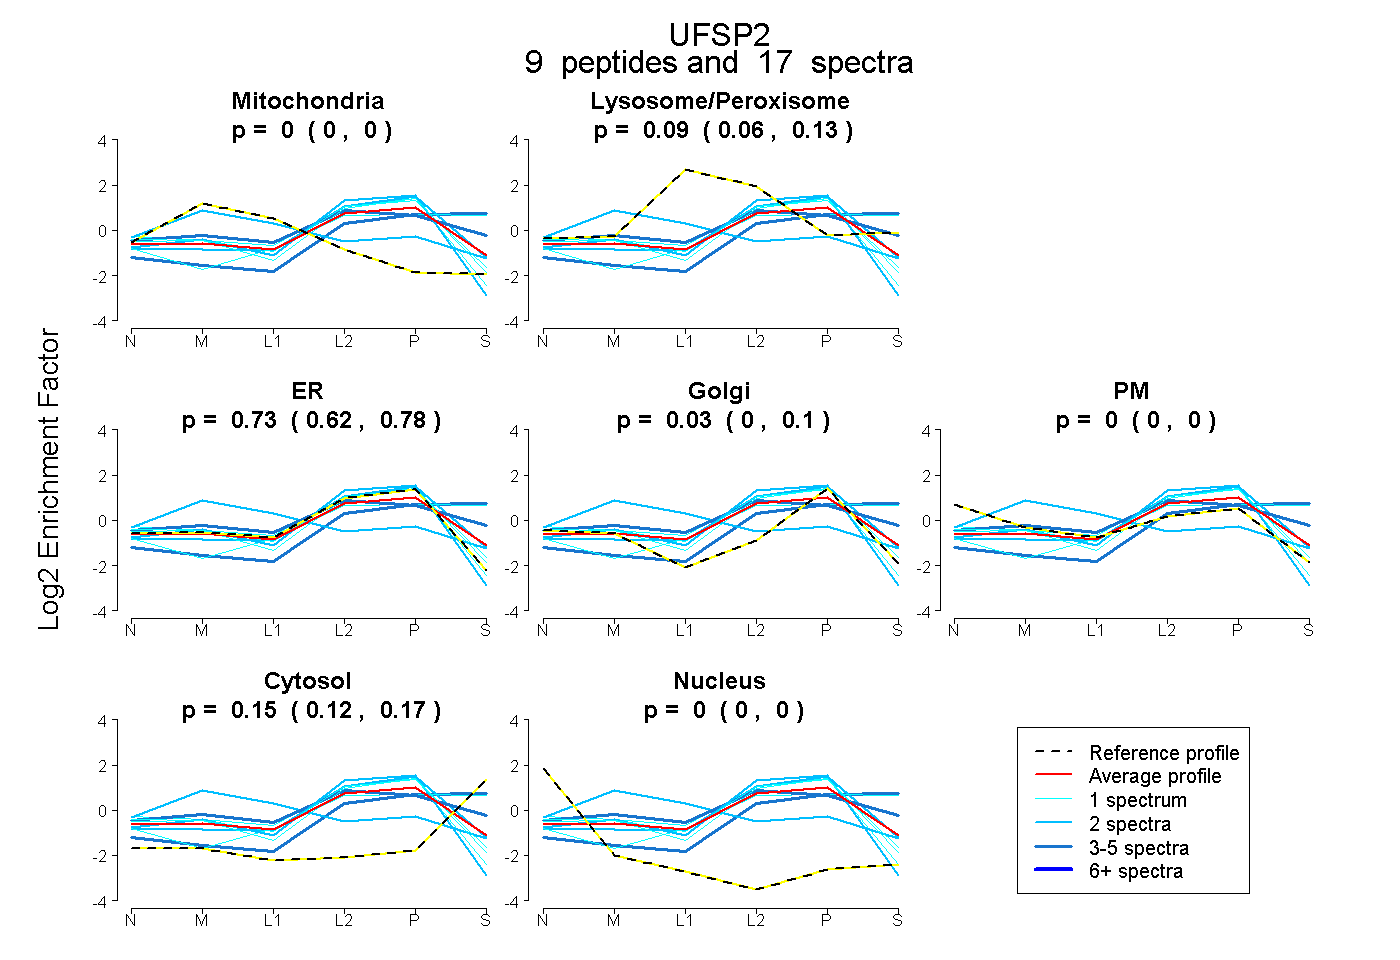
0.000 | 0.000
0.062 | 0.132
0.620 | 0.782
0.000 | 0.100
0.000 | 0.000
0.119 | 0.170
0.000 | 0.000
11peptides
spectra
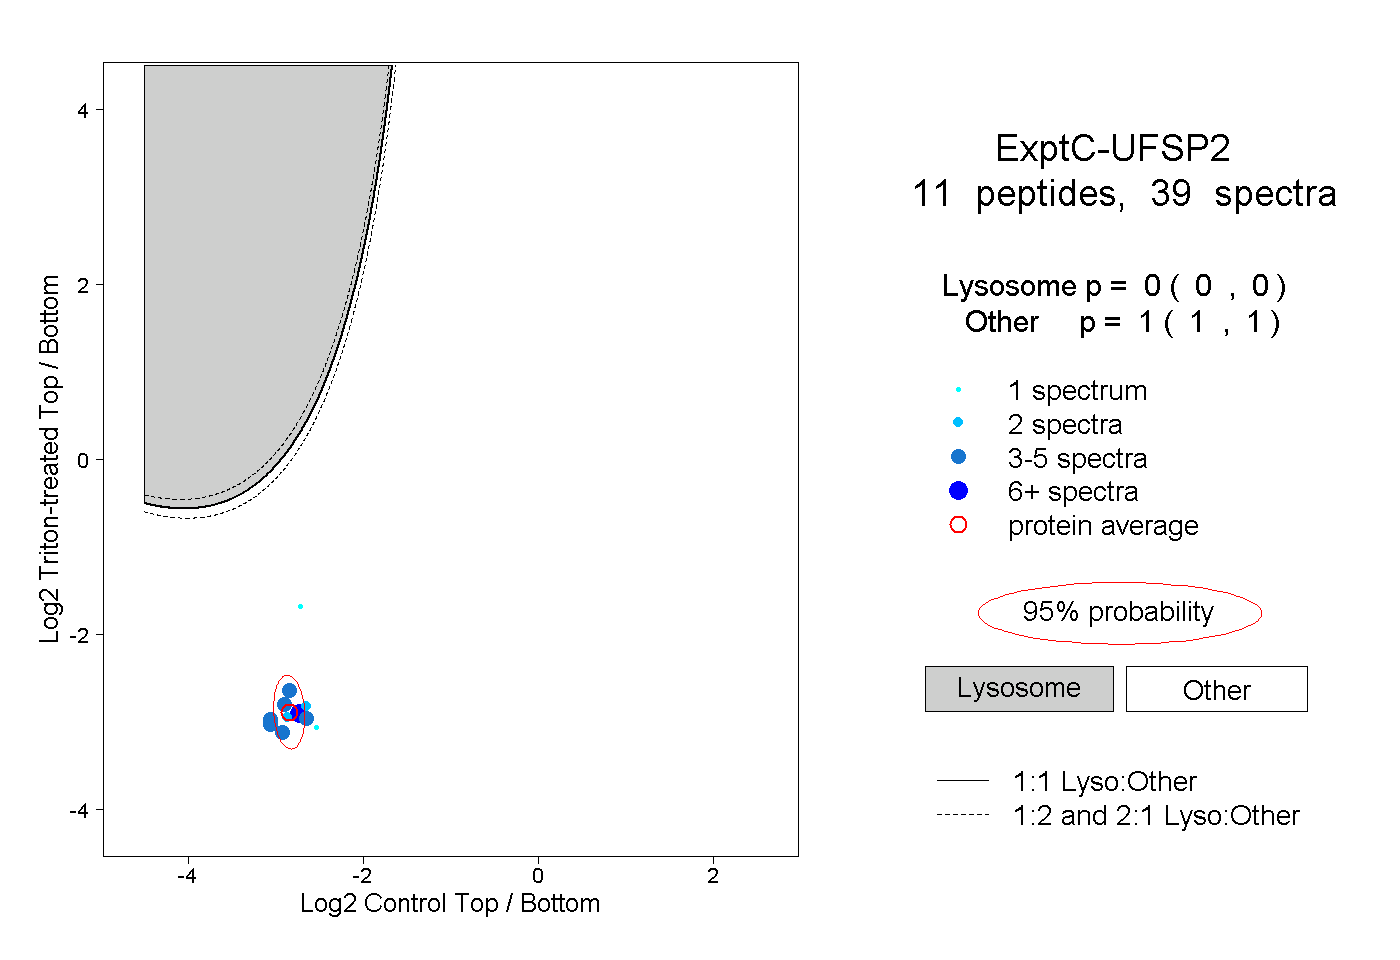
0.000 | 0.000
1.000 | 1.000
1peptide
spectra
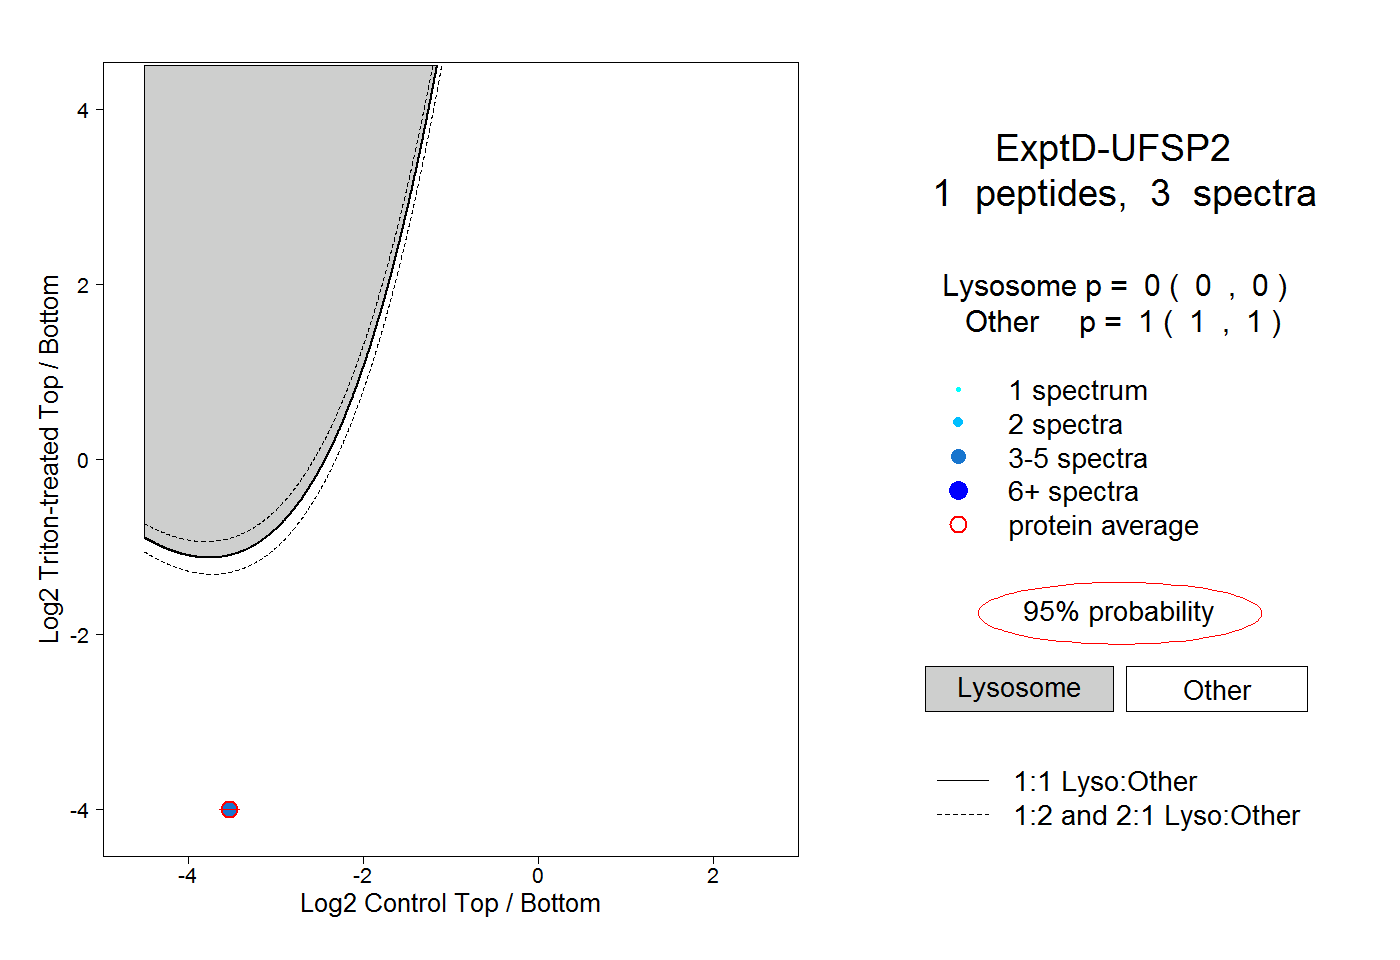
0.000 | 0.000
1.000 | 1.000