 14
14peptides
spectra
0.000 | 0.001
0.000 | 0.000
0.000 | 0.000
0.888 | 0.905
0.000 | 0.000
0.000 | 0.000
0.020 | 0.050
0.054 | 0.076
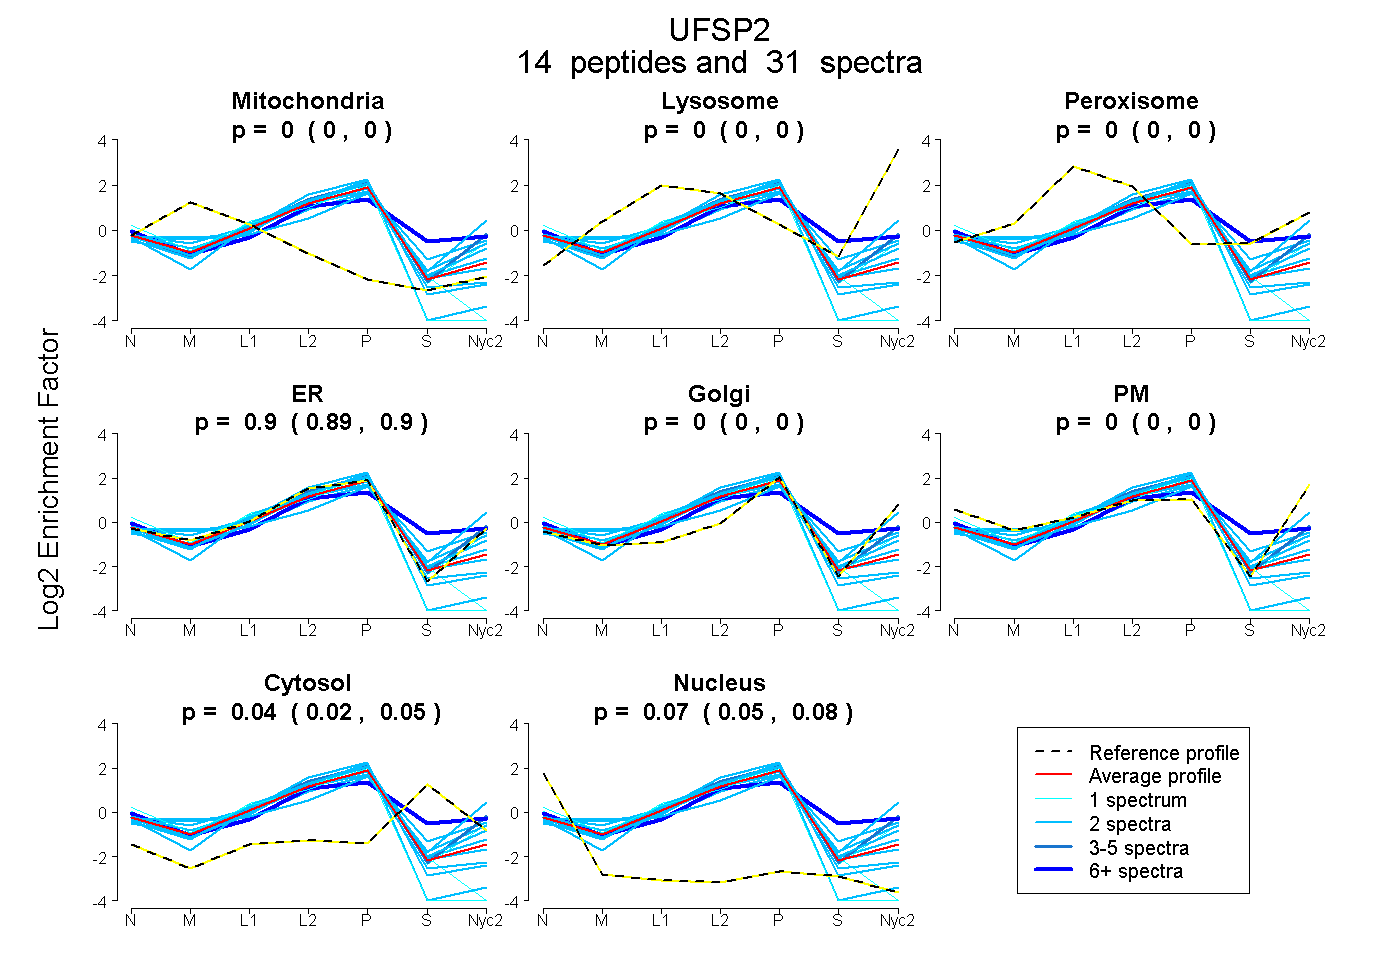
| Plot | Mito | Lyso | Perox | ER | Golgi | PM | Cytosol | Nucleus | |||||
| Expt A |
14 peptides |
31 spectra |
|
0.000 0.000 | 0.001 |
0.000 0.000 | 0.000 |
0.000 0.000 | 0.000 |
0.898 0.888 | 0.905 |
0.000 0.000 | 0.000 |
0.000 0.000 | 0.000 |
0.036 0.020 | 0.050 |
0.067 0.054 | 0.076 |
| 1 spectrum, SVVDLIQFDQEEDTK | 0.040 | 0.000 | 0.000 | 0.765 | 0.000 | 0.000 | 0.000 | 0.194 | ||
| 2 spectra, INAYHFPDELYK | 0.000 | 0.000 | 0.000 | 0.916 | 0.000 | 0.000 | 0.084 | 0.000 | ||
| 2 spectra, FLILDPHYTGAEDLQVILEK | 0.000 | 0.000 | 0.110 | 0.757 | 0.000 | 0.000 | 0.134 | 0.000 | ||
| 1 spectrum, DAYYNLCLPQRPNAL | 0.000 | 0.000 | 0.000 | 0.805 | 0.000 | 0.000 | 0.000 | 0.195 | ||
| 2 spectra, SLQTVCSWFR | 0.000 | 0.000 | 0.000 | 0.878 | 0.000 | 0.000 | 0.000 | 0.122 | ||
| 2 spectra, QVLNDLTTK | 0.032 | 0.000 | 0.180 | 0.160 | 0.628 | 0.000 | 0.001 | 0.000 | ||
| 2 spectra, LPHDRPYLK | 0.000 | 0.000 | 0.000 | 0.885 | 0.000 | 0.000 | 0.000 | 0.115 | ||
| 2 spectra, ELHDLFK | 0.000 | 0.000 | 0.000 | 0.904 | 0.000 | 0.000 | 0.065 | 0.031 | ||
| 6 spectra, HQGYTER | 0.000 | 0.000 | 0.076 | 0.597 | 0.000 | 0.046 | 0.281 | 0.000 | ||
| 4 spectra, GWCGWK | 0.000 | 0.000 | 0.012 | 0.899 | 0.054 | 0.000 | 0.034 | 0.000 | ||
| 1 spectrum, GGFDLAFQLAPPK | 0.000 | 0.000 | 0.020 | 0.922 | 0.003 | 0.000 | 0.019 | 0.037 | ||
| 2 spectra, VDDNGWGCAYR | 0.000 | 0.000 | 0.000 | 0.897 | 0.000 | 0.000 | 0.032 | 0.070 | ||
| 2 spectra, ILFVNQGSEMASQGR | 0.042 | 0.000 | 0.000 | 0.852 | 0.000 | 0.000 | 0.000 | 0.106 | ||
| 2 spectra, GPDFWNK | 0.059 | 0.000 | 0.000 | 0.785 | 0.045 | 0.000 | 0.110 | 0.000 |
| Plot | Mito | Lyso or Perox | ER | Golgi | PM | Cytosol | Nucleus | ||||||
| Expt B |
9 peptides |
17 spectra |
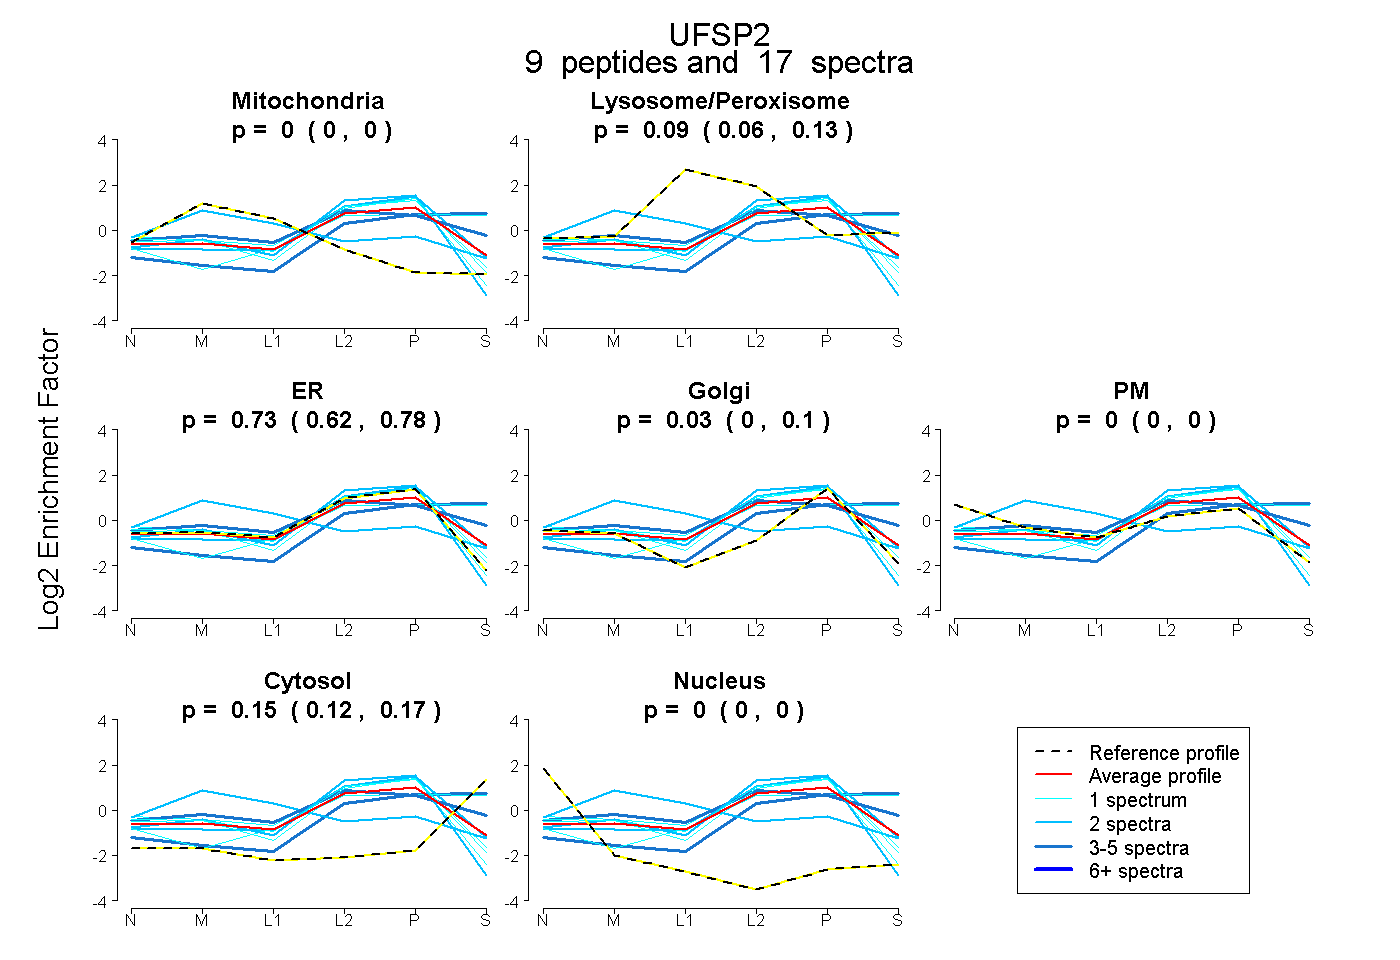 |
0.000 0.000 | 0.000 |
0.095 0.062 | 0.132 |
0.727 0.620 | 0.782 |
0.030 0.000 | 0.100 |
0.000 0.000 | 0.000 |
0.149 0.119 | 0.170 |
0.000 0.000 | 0.000 |
|||
| Plot | Lyso | Other | |||||||||||
| Expt C |
11 peptides |
39 spectra |
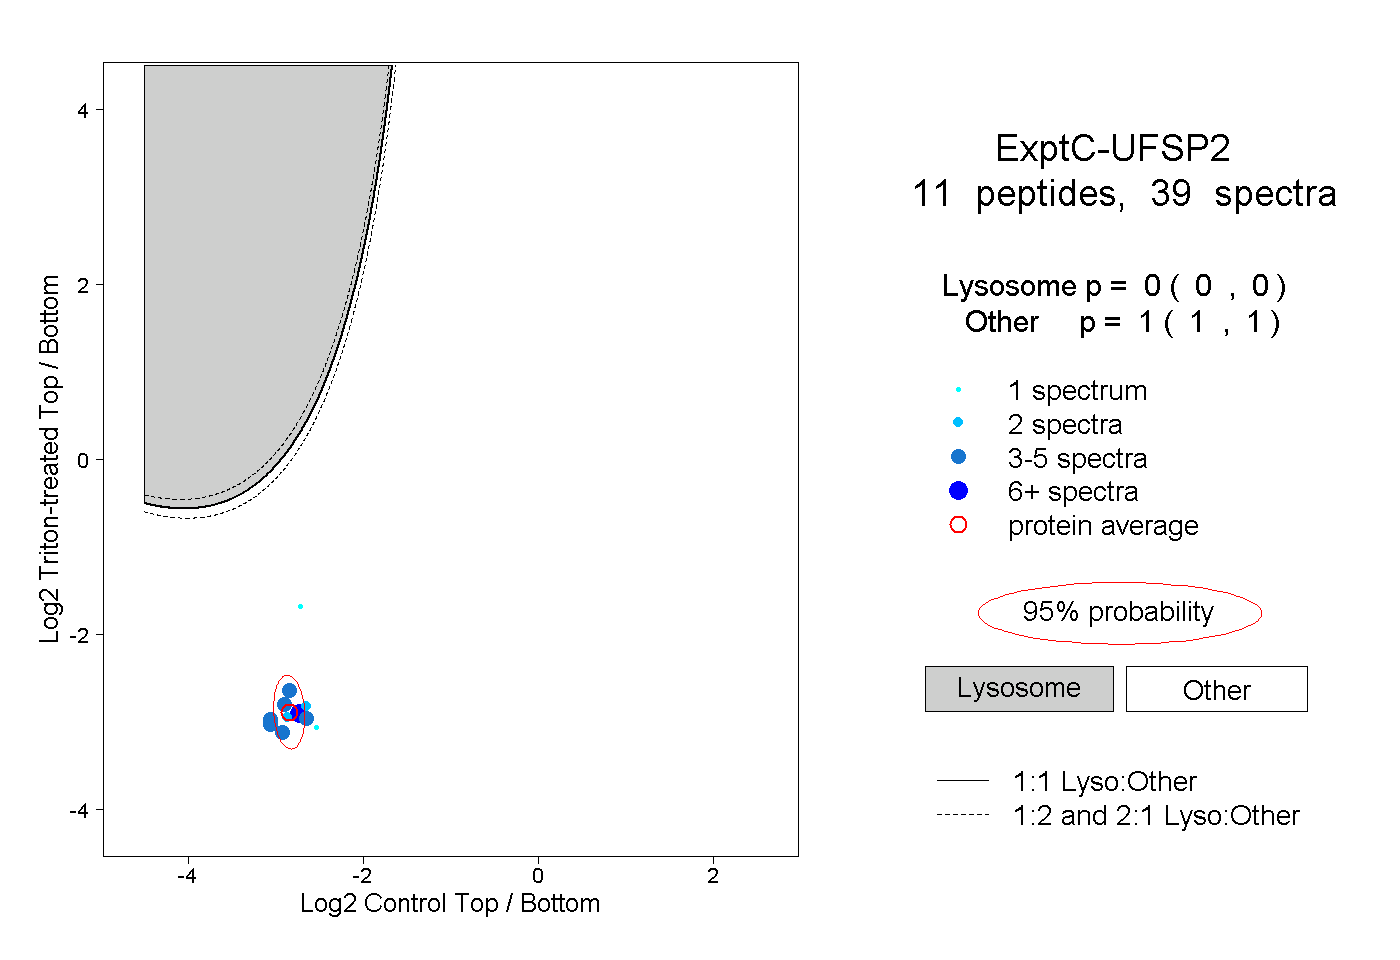 |
0.000 0.000 | 0.000 |
1.000 1.000 | 1.000 |
||||||||
| Plot | Lyso | Other | |||||||||||
| Expt D |
1 peptide |
3 spectra |
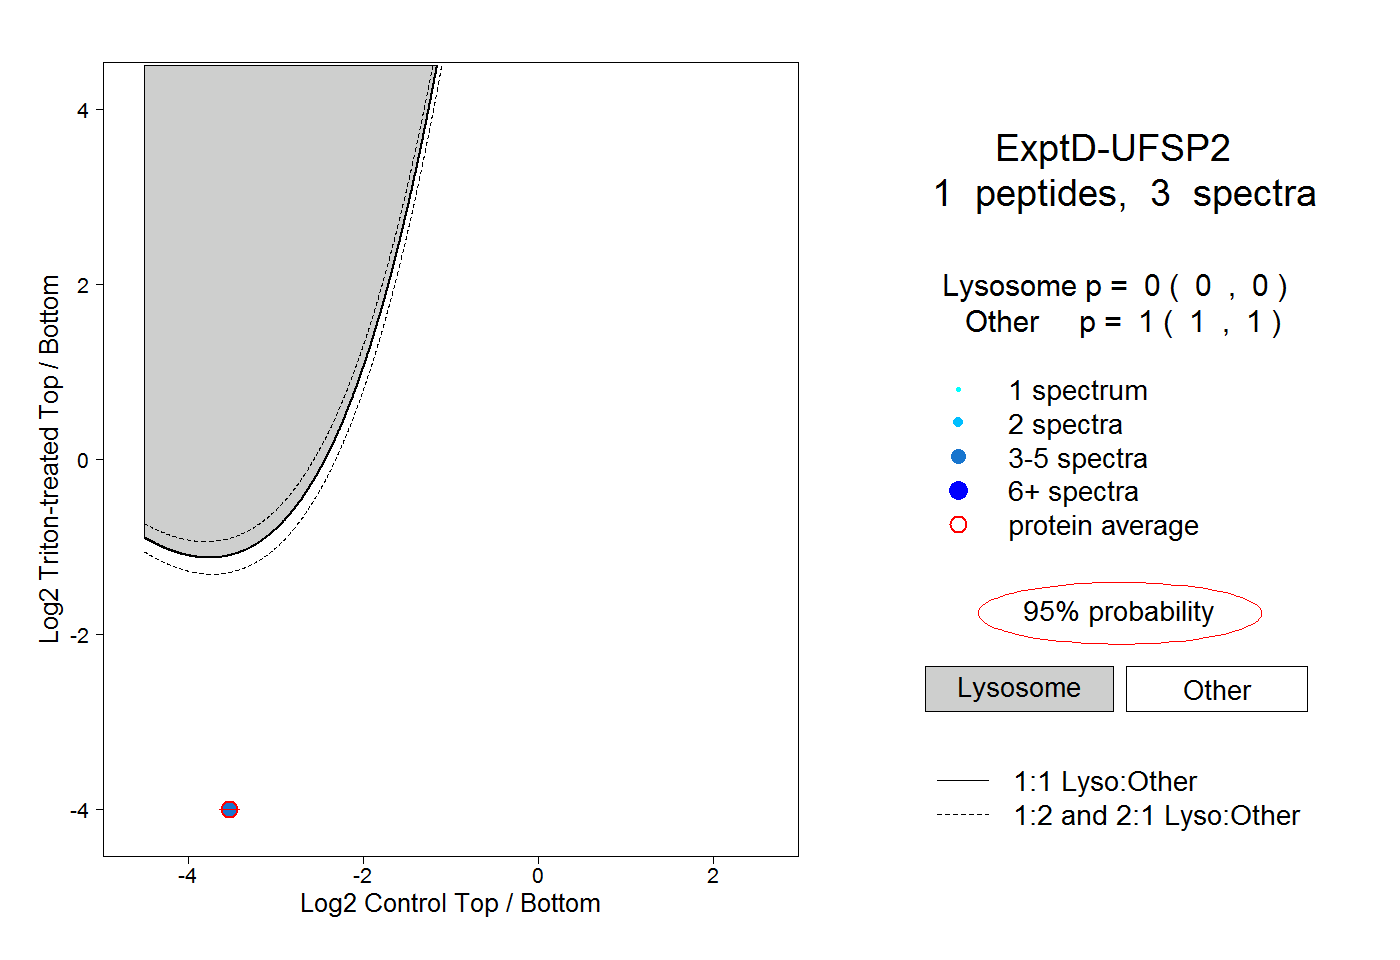 |
0.000 0.000 | 0.000 |
1.000 1.000 | 1.000 |