 51
51peptides
spectra
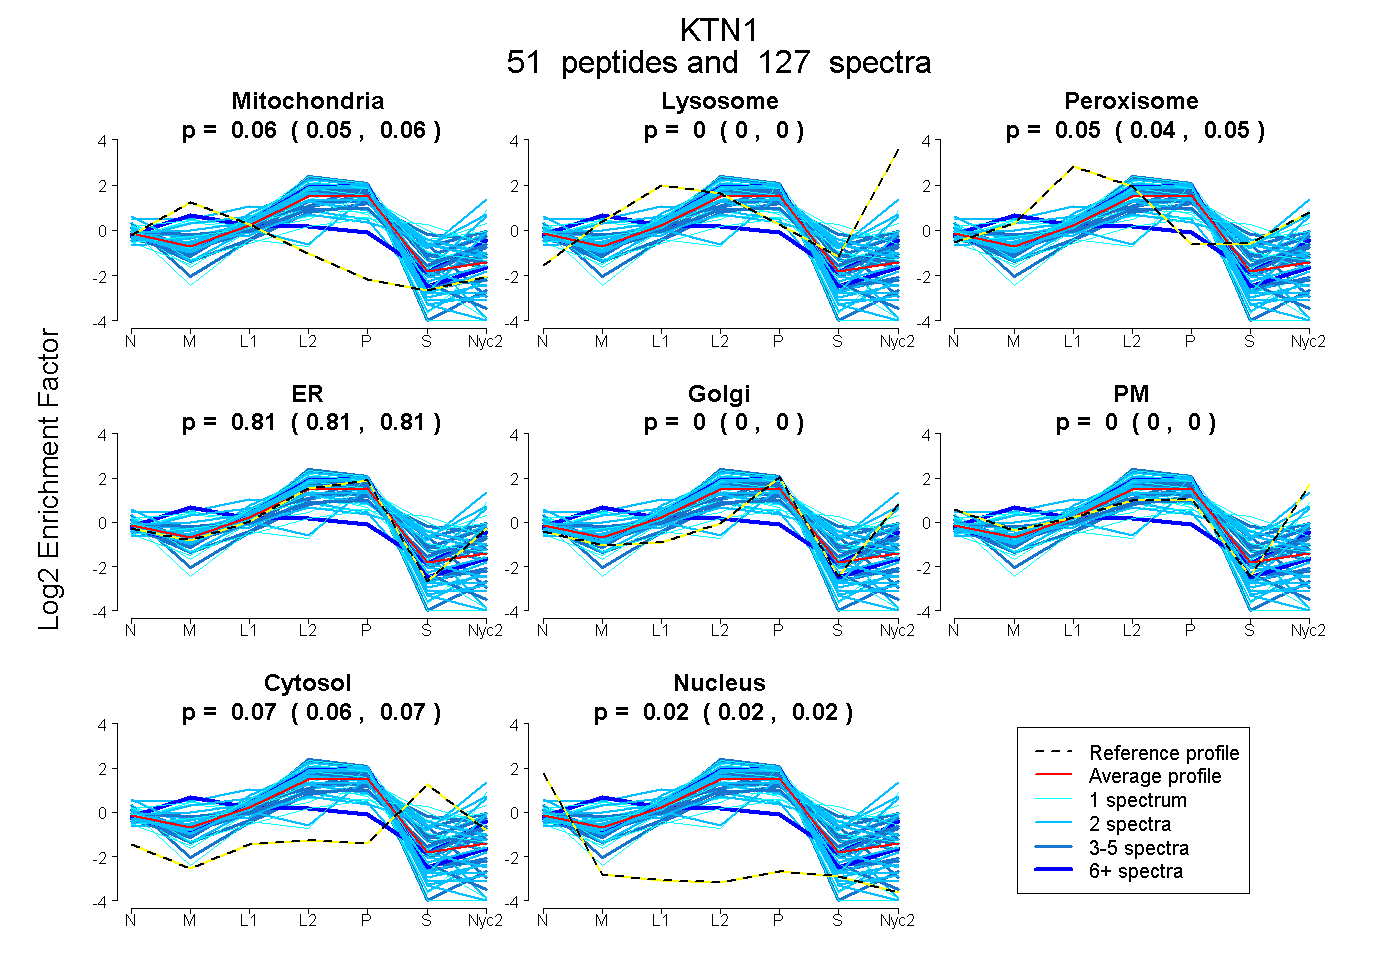
0.051 | 0.060
0.000 | 0.000
0.041 | 0.050
0.808 | 0.815
0.000 | 0.000
0.000 | 0.000
0.063 | 0.071
0.015 | 0.022
10peptides
spectra
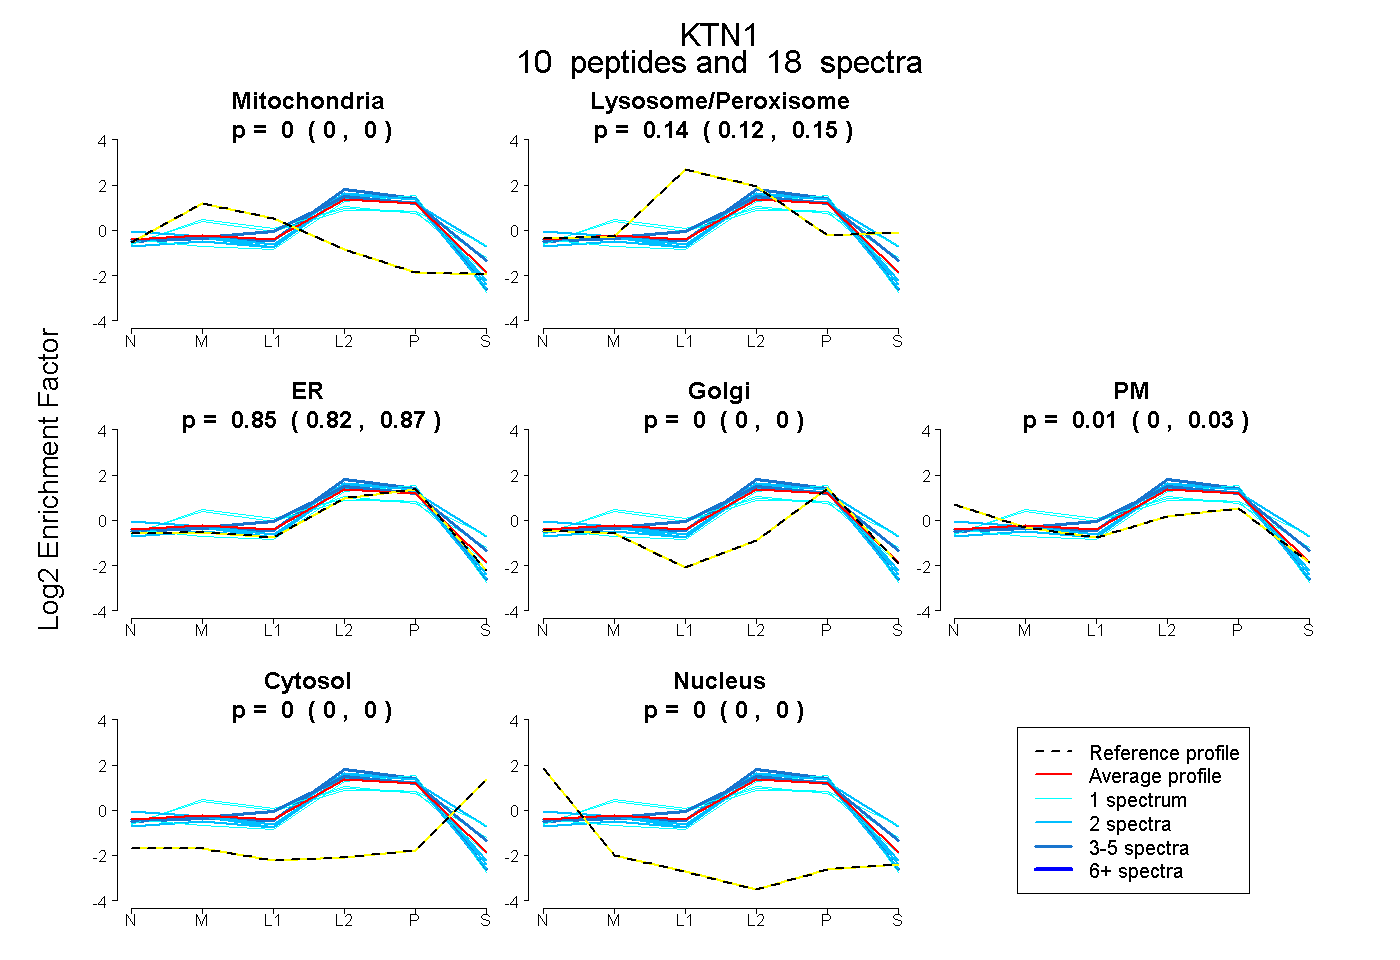
0.000 | 0.000
0.124 | 0.153
0.824 | 0.870
0.000 | 0.000
0.000 | 0.025
0.000 | 0.000
0.000 | 0.000
44peptides
spectra
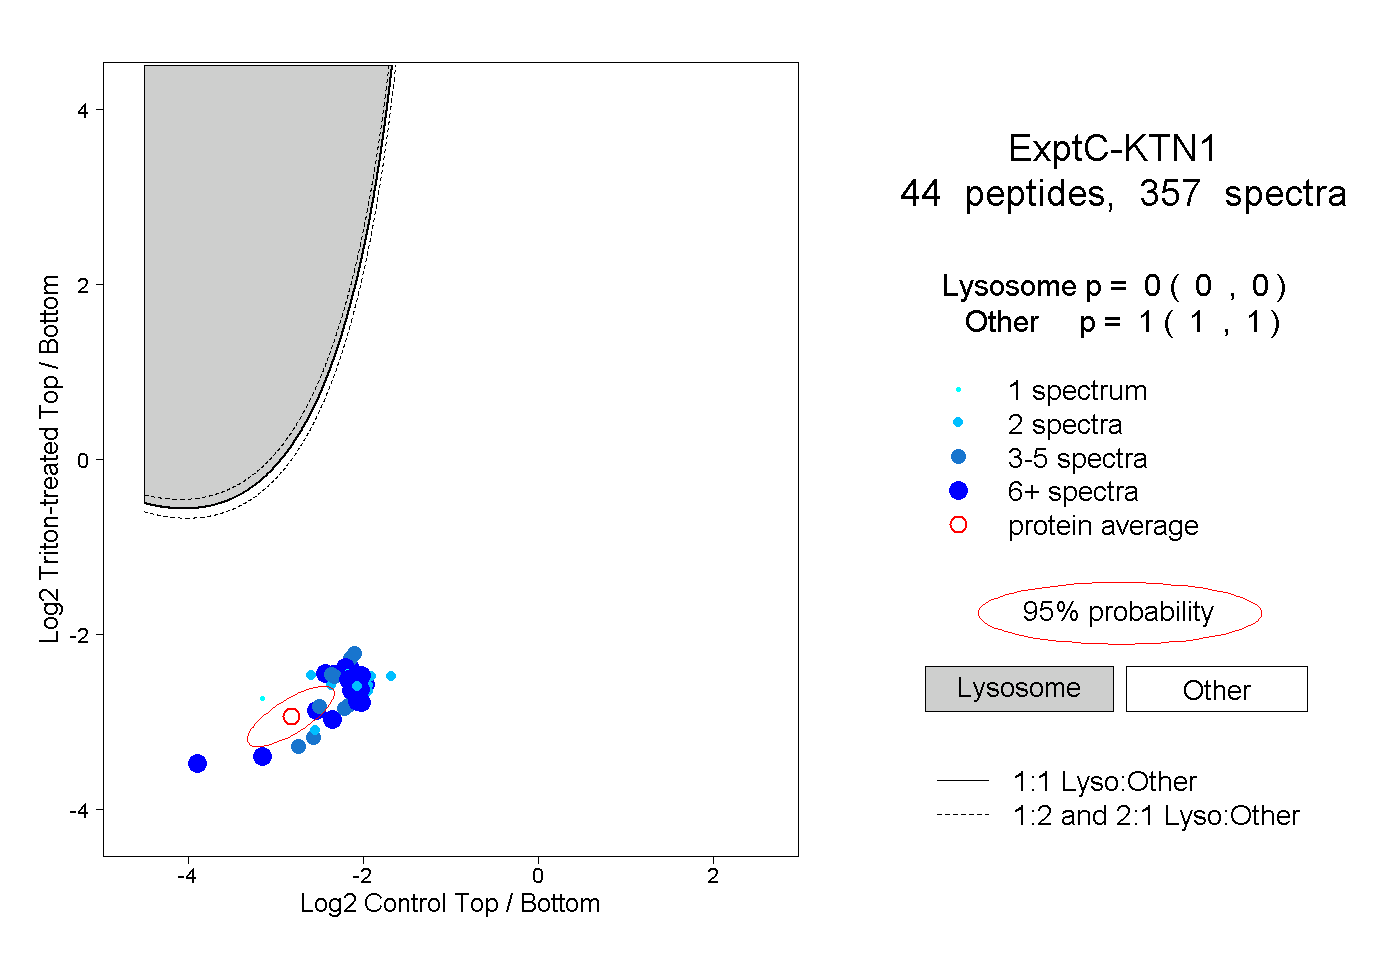
0.000 | 0.000
1.000 | 1.000
19peptides
spectra
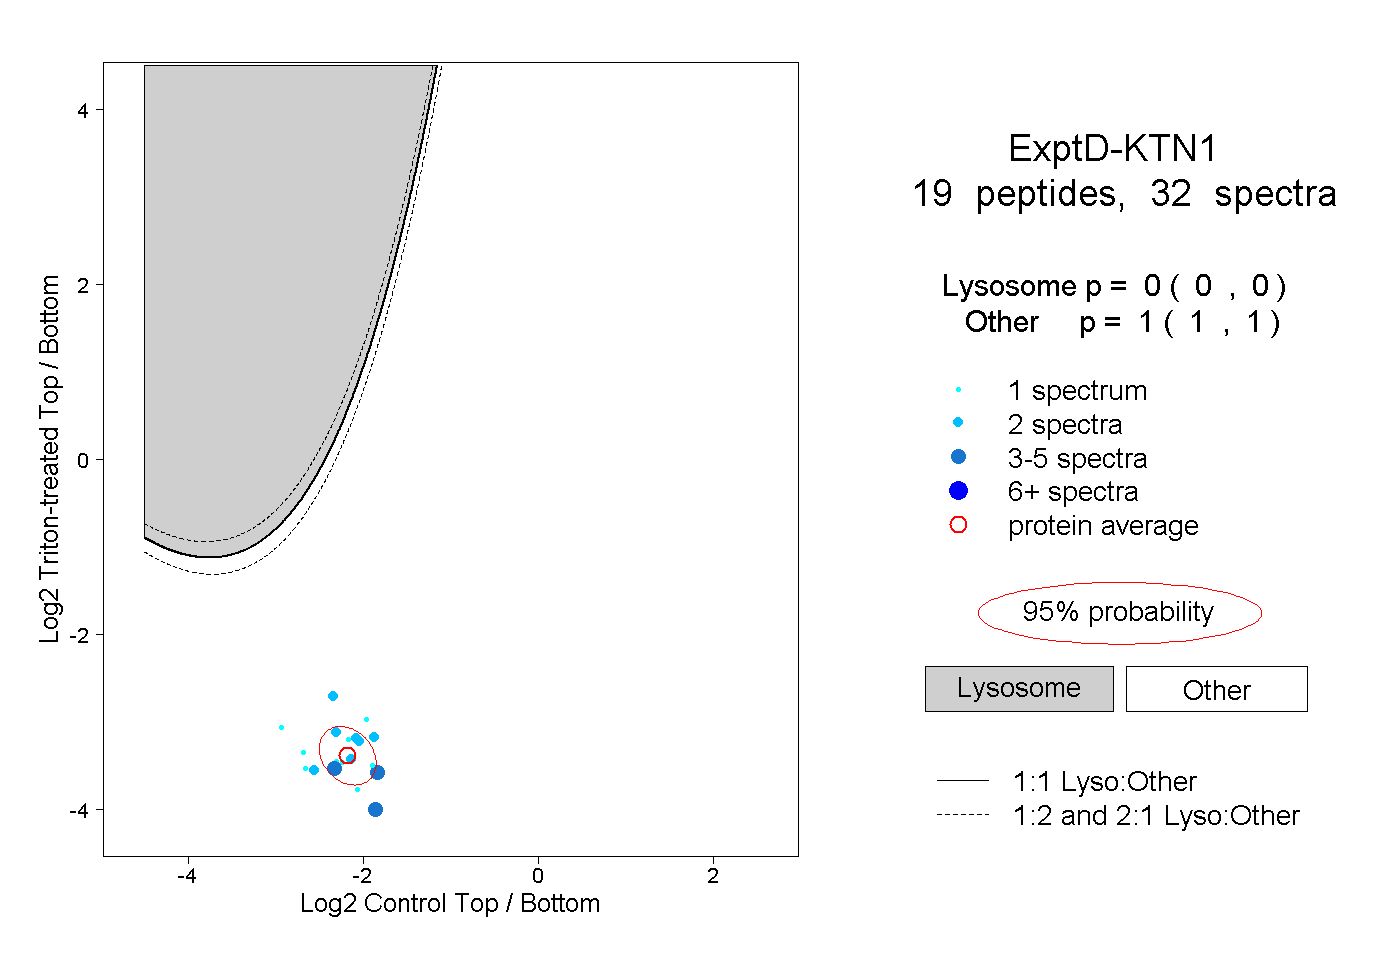
0.000 | 0.000
1.000 | 1.000