KTN1
[ENSRNOP00000016449]
Main page
| | | Plot |
Mito |
Lyso |
|
Perox |
ER |
Golgi |
PM |
Cytosol |
Nucleus |
|
| Expt A |
 51
51
peptides |
127
spectra |
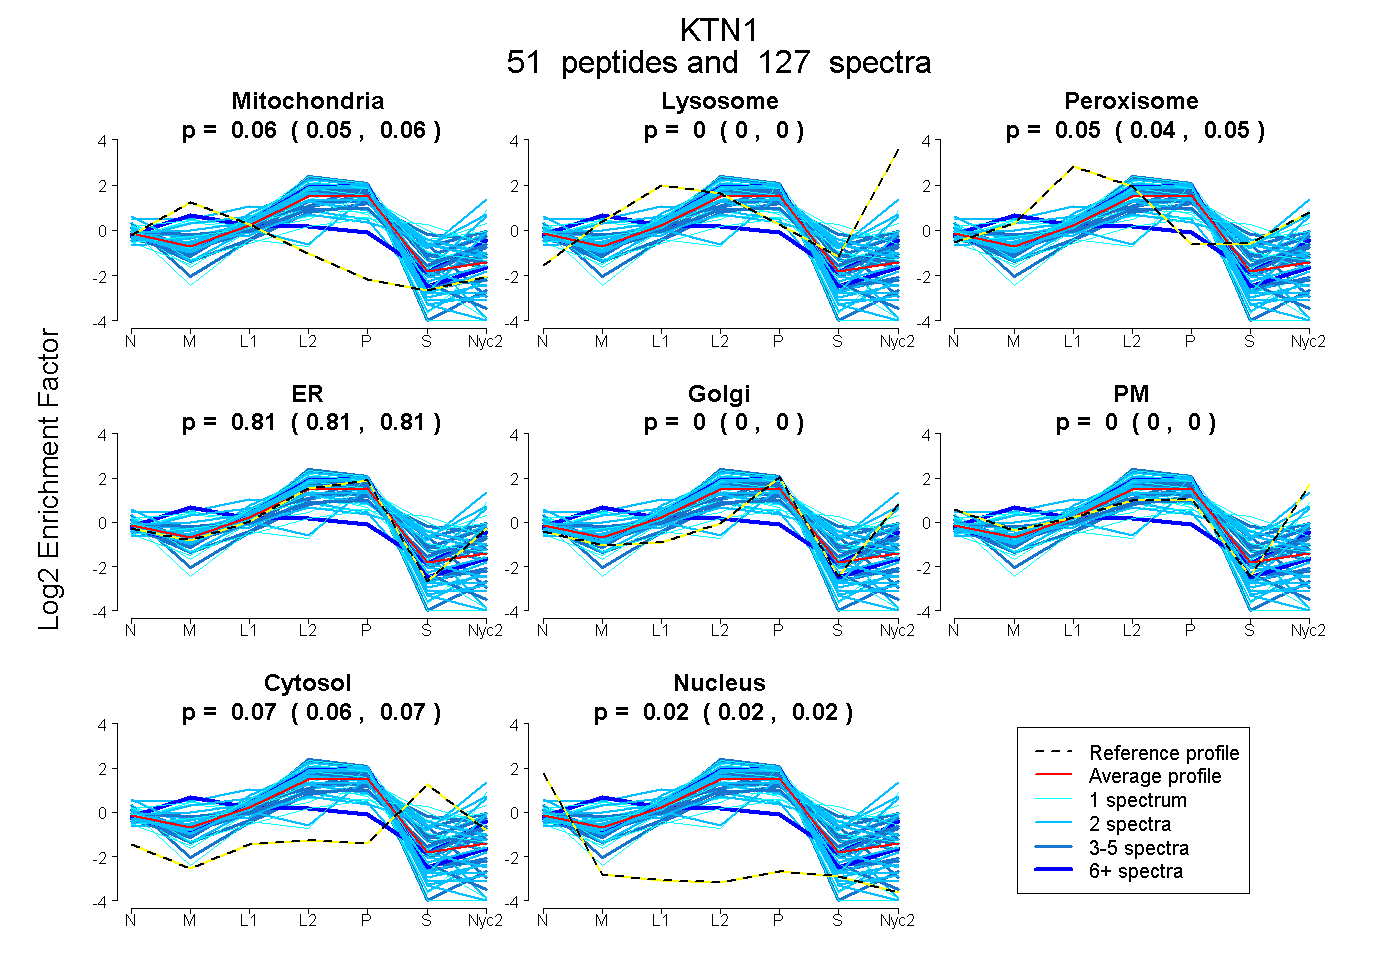 |
0.056
0.051 | 0.060 |
0.000
0.000 | 0.000 |
|
0.046
0.041 | 0.050 |
0.812
0.808 | 0.815 |
0.000
0.000 | 0.000 |
0.000
0.000 | 0.000 |
0.067
0.063 | 0.071 |
0.019
0.015 | 0.022 |
|
| | | Plot |
Mito |
|
Lyso or Perox |
|
ER |
Golgi |
PM |
Cytosol |
Nucleus |
|
| Expt B |
10
peptides |
18
spectra |
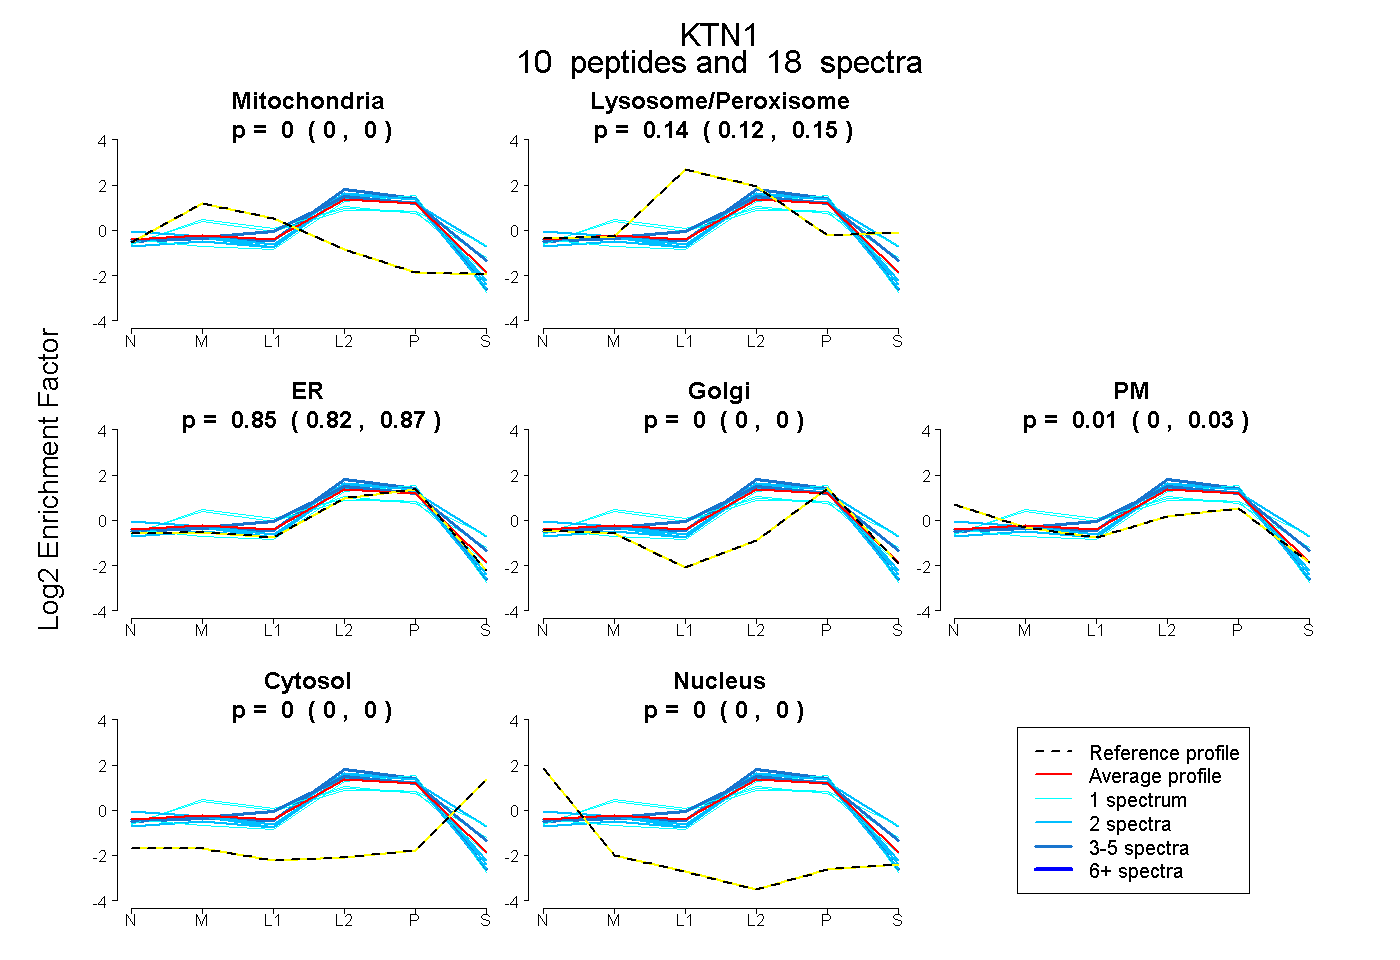 |
0.000
0.000 | 0.000 |
|
0.140
0.124 | 0.153 |
|
0.853
0.824 | 0.870 |
0.000
0.000 | 0.000 |
0.007
0.000 | 0.025 |
0.000
0.000 | 0.000 |
0.000
0.000 | 0.000 |
|
| 2 spectra, EEELNAIR |
0.000 |
|
0.174 |
|
0.727 |
0.000 |
0.000 |
0.099 |
0.000 |
|
| 2 spectra, AALEDLTGR |
0.000 |
|
0.068 |
|
0.932 |
0.000 |
0.000 |
0.000 |
0.000 |
|
| 2 spectra, VADDLHK |
0.000 |
|
0.023 |
|
0.873 |
0.000 |
0.103 |
0.000 |
0.000 |
|
| 1 spectrum, TQLNETHSK |
0.180 |
|
0.150 |
|
0.670 |
0.000 |
0.000 |
0.000 |
0.000 |
|
| 3 spectra, FEELENVLK |
0.000 |
|
0.054 |
|
0.946 |
0.000 |
0.000 |
0.000 |
0.000 |
|
| 2 spectra, SVLAETEGILQK |
0.000 |
|
0.039 |
|
0.961 |
0.000 |
0.000 |
0.000 |
0.000 |
|
| 1 spectrum, AQQSLNFIHSK |
0.110 |
|
0.283 |
|
0.490 |
0.117 |
0.000 |
0.000 |
0.000 |
|
| 1 spectrum, LQNEQTER |
0.000 |
|
0.000 |
|
1.000 |
0.000 |
0.000 |
0.000 |
0.000 |
|
| 3 spectra, VQLQEAER |
0.000 |
|
0.256 |
|
0.744 |
0.000 |
0.000 |
0.000 |
0.000 |
|
| 1 spectrum, ILNDQNK |
0.000 |
|
0.423 |
|
0.081 |
0.351 |
0.138 |
0.007 |
0.000 |
|
| | | Plot |
|
Lyso |
|
|
|
|
|
|
|
Other |
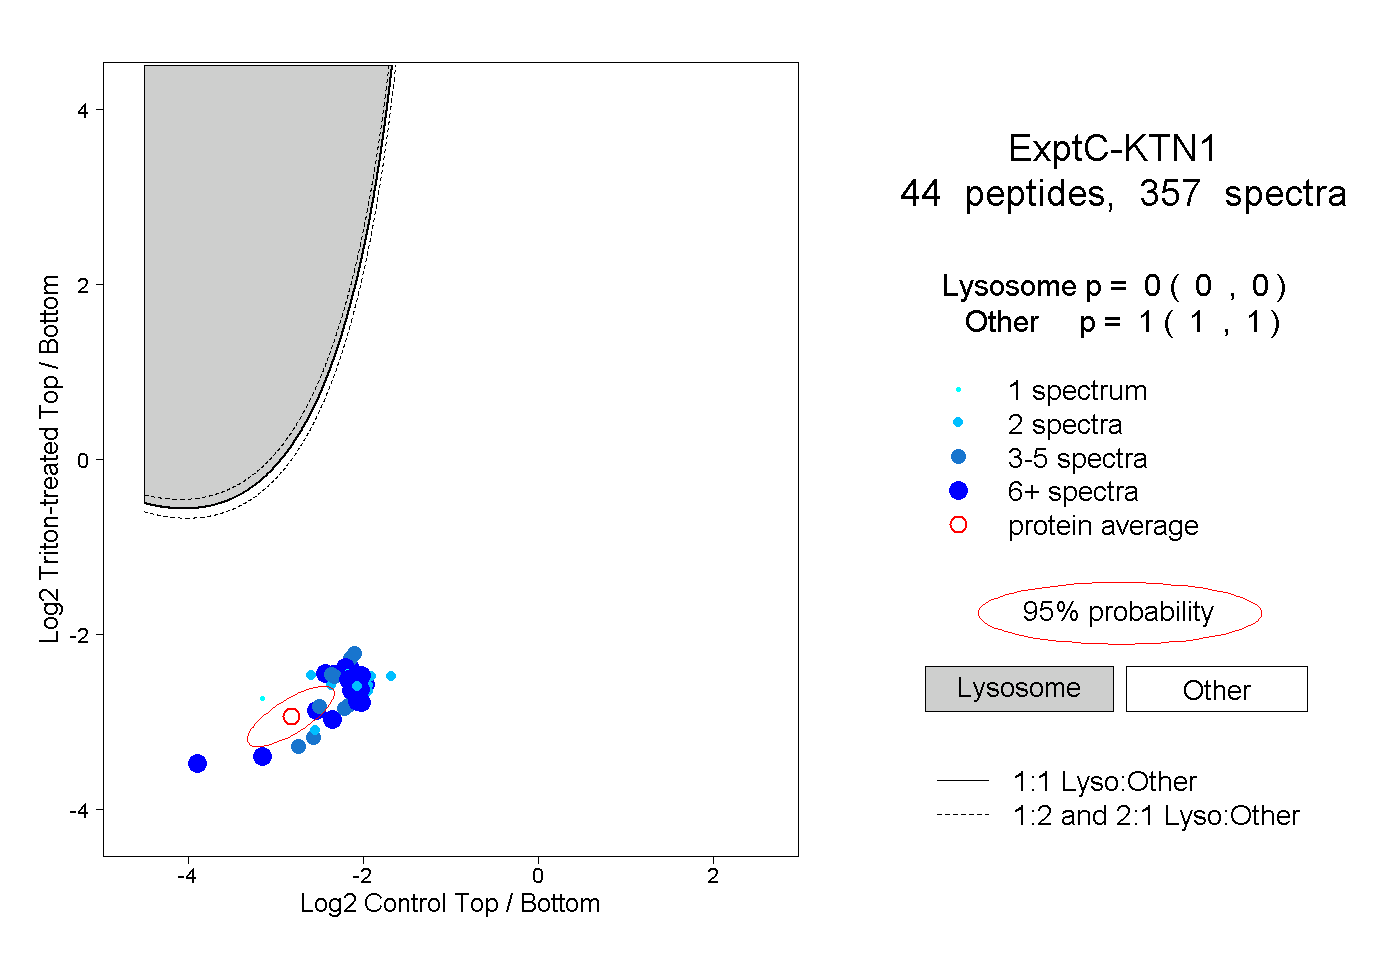
| Expt C |
44
peptides |
357
spectra |
 |
|
0.000
0.000 | 0.000 |
|
|
|
|
|
|
|
1.000
1.000 | 1.000 |
| | | Plot |
|
Lyso |
|
|
|
|
|
|
|
Other |
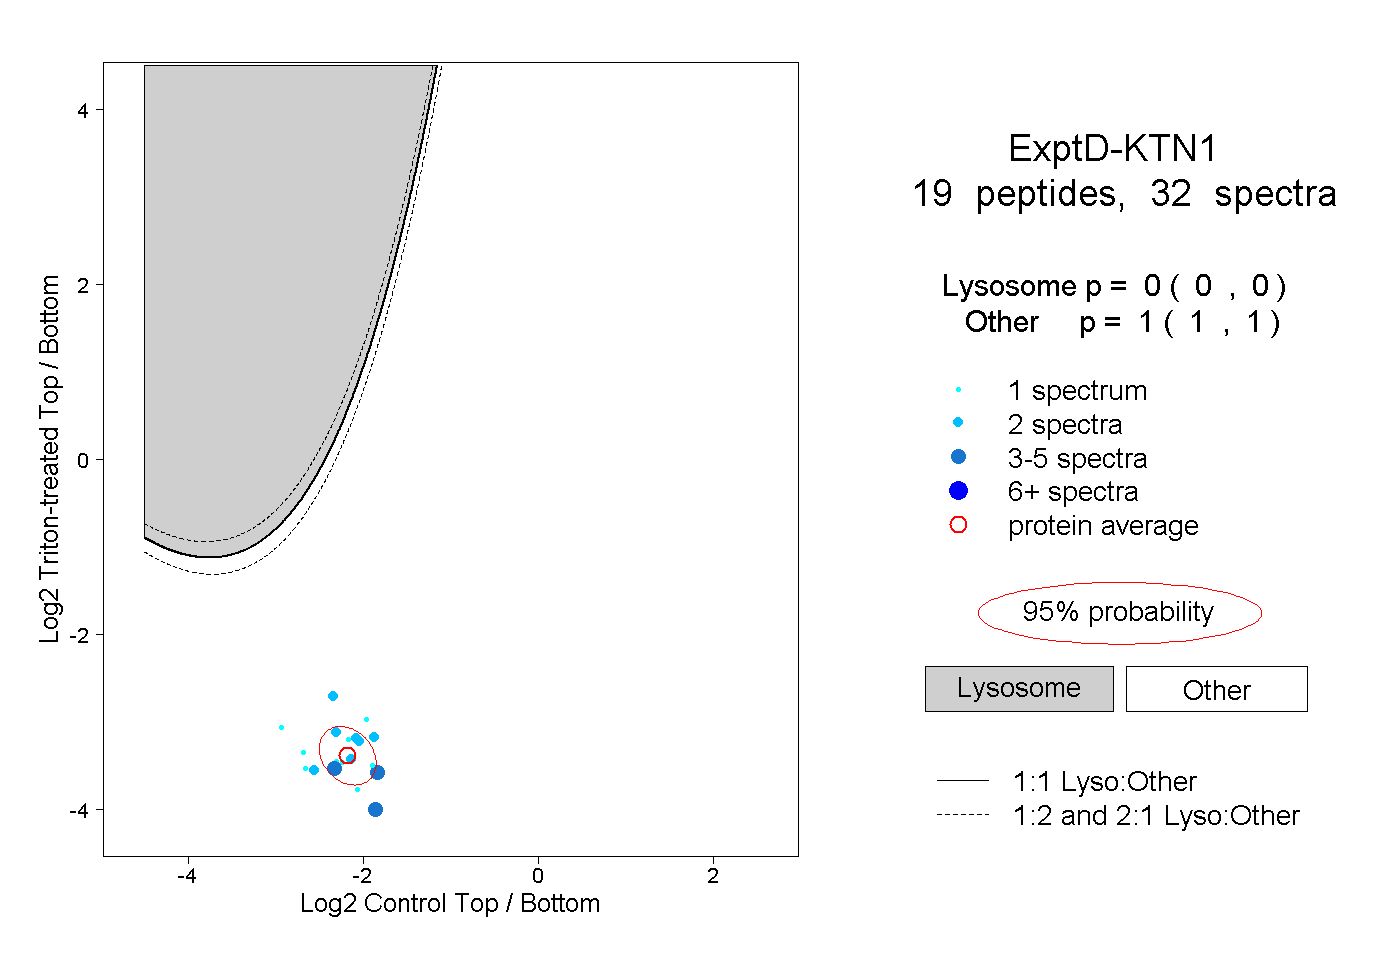
| Expt D |
19
peptides |
32
spectra |
 |
|
0.000
0.000 | 0.000 |
|
|
|
|
|
|
|
1.000
1.000 | 1.000 |