 38
38peptides
spectra
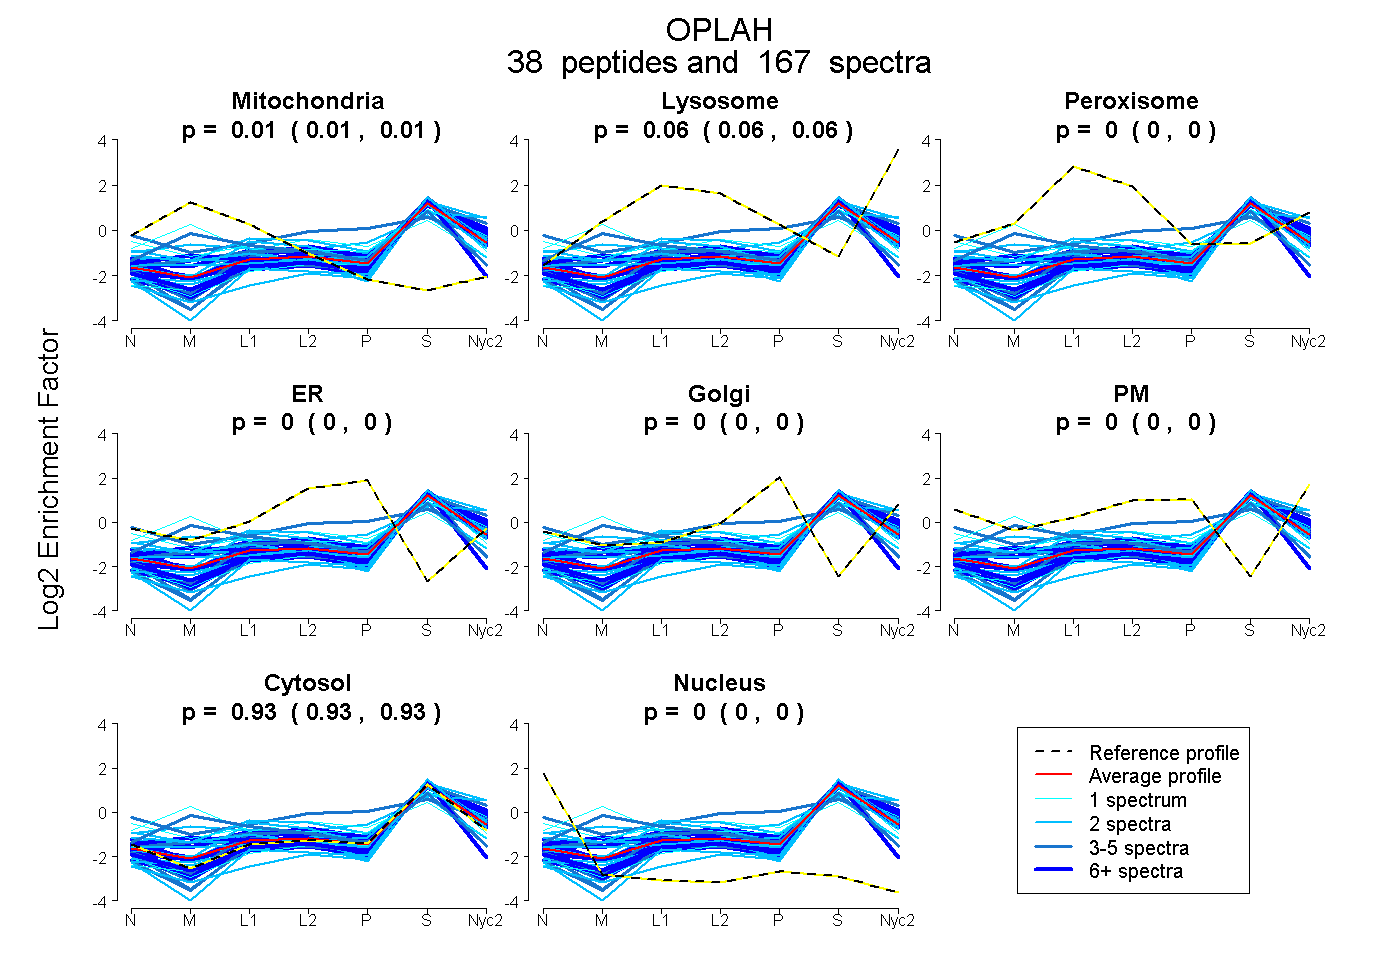
0.010 | 0.015
0.055 | 0.059
0.000 | 0.000
0.000 | 0.000
0.000 | 0.000
0.000 | 0.000
0.928 | 0.933
0.000 | 0.000
25peptides
spectra
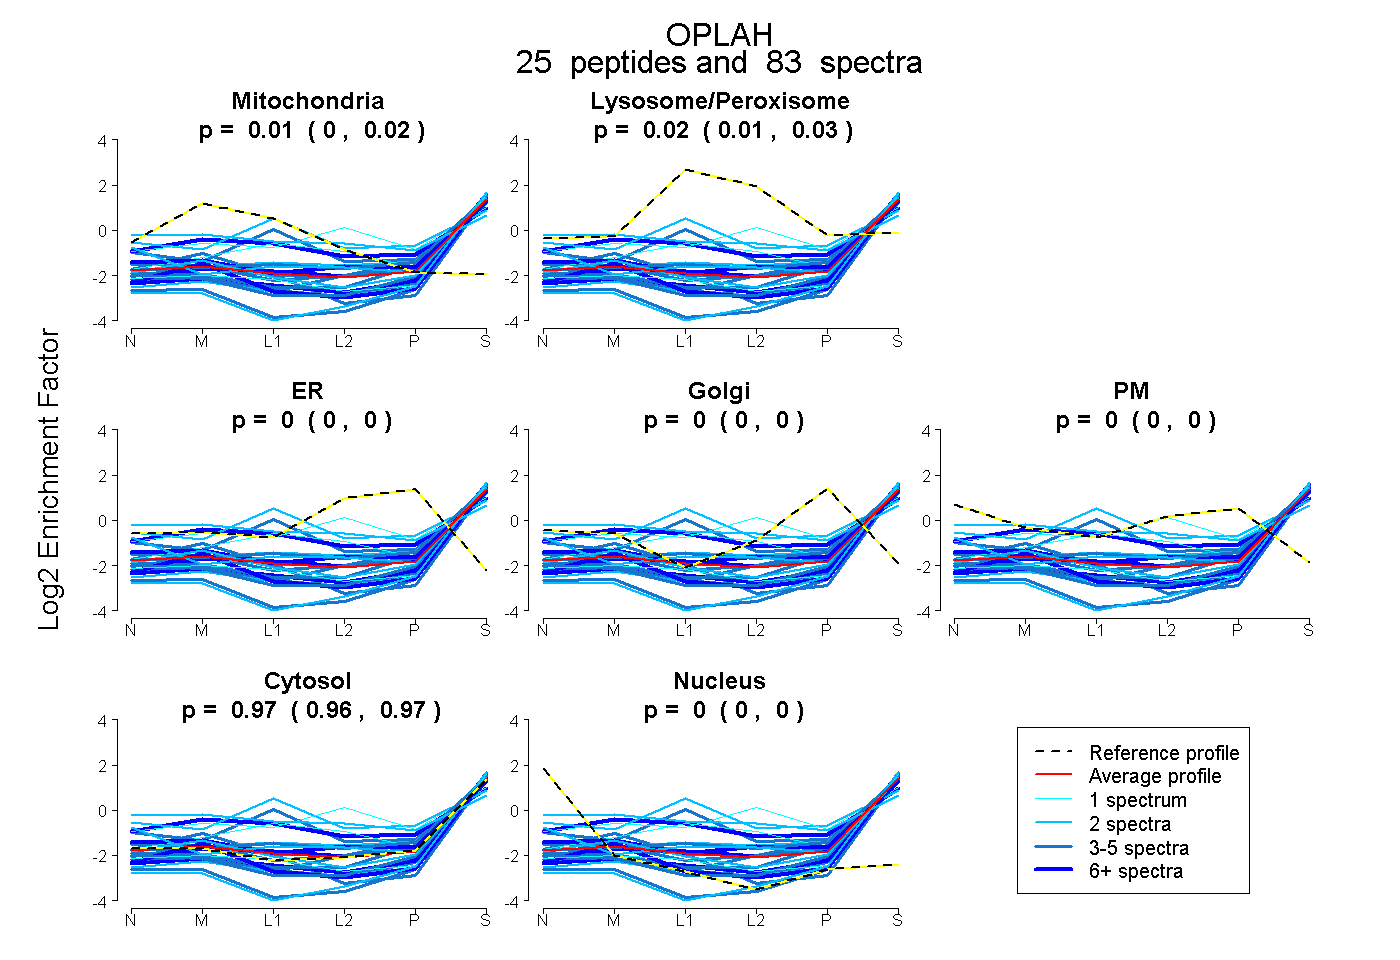
0.005 | 0.017
0.014 | 0.029
0.000 | 0.000
0.000 | 0.000
0.000 | 0.000
0.960 | 0.971
0.000 | 0.000
41peptides
spectra
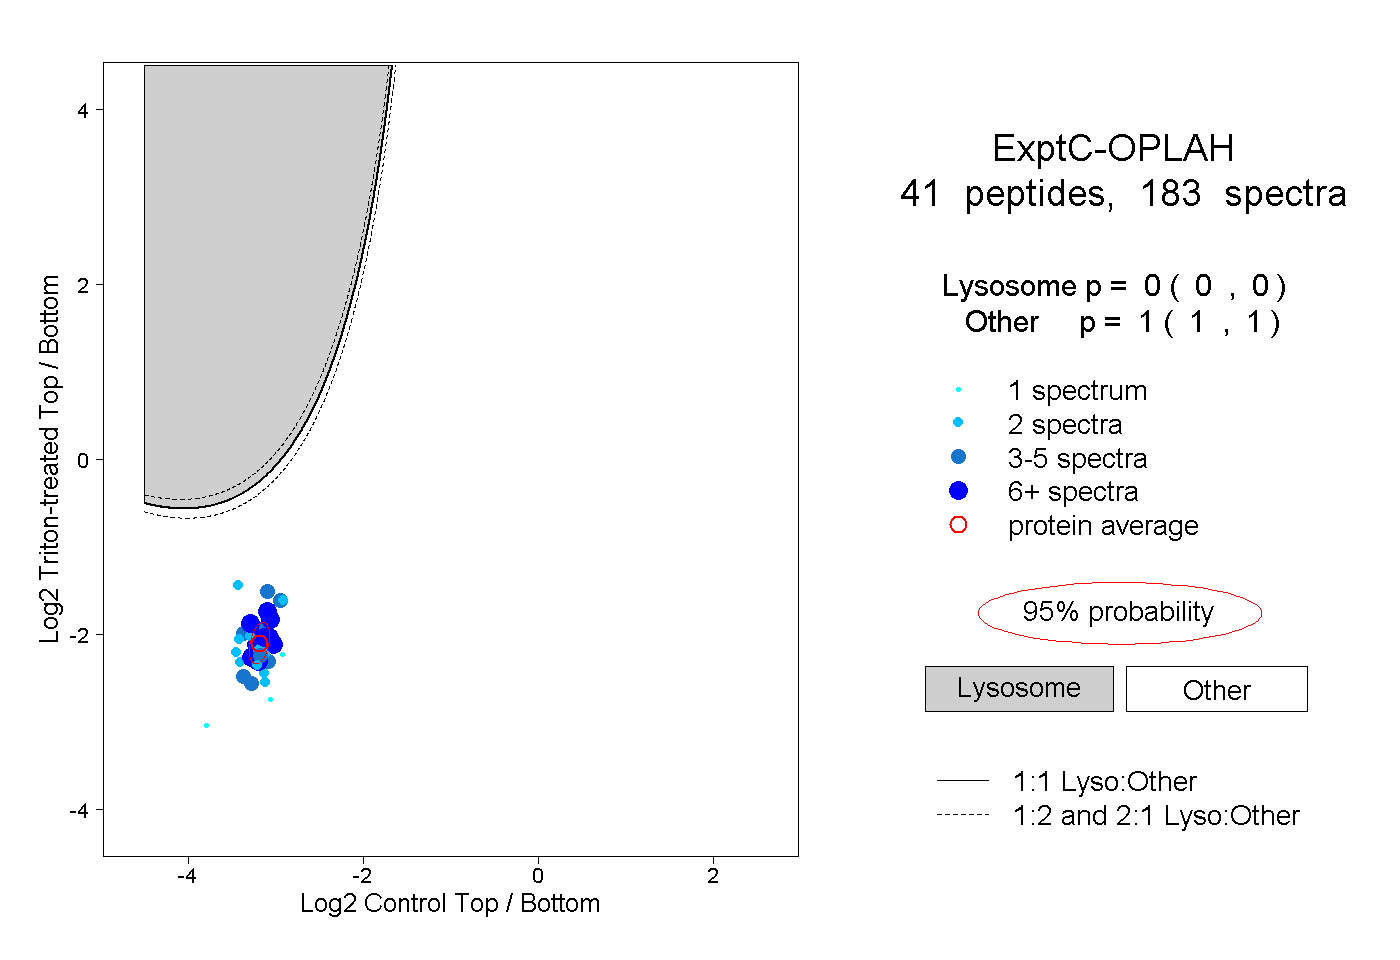
0.000 | 0.000
1.000 | 1.000
5peptides
spectra
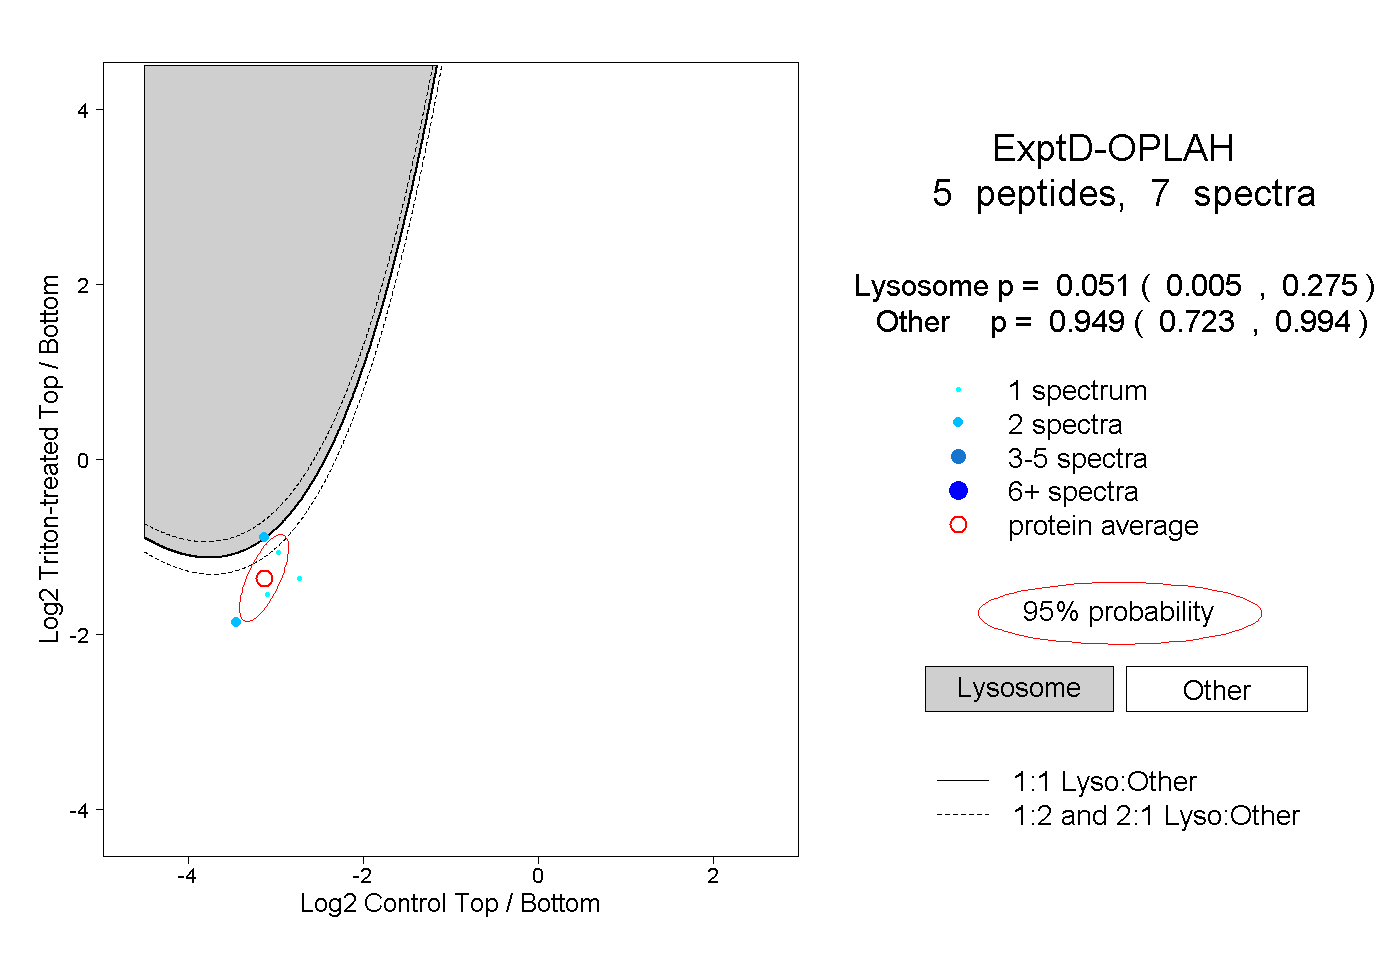
0.005 | 0.275
0.723 | 0.994