 29
29peptides
spectra
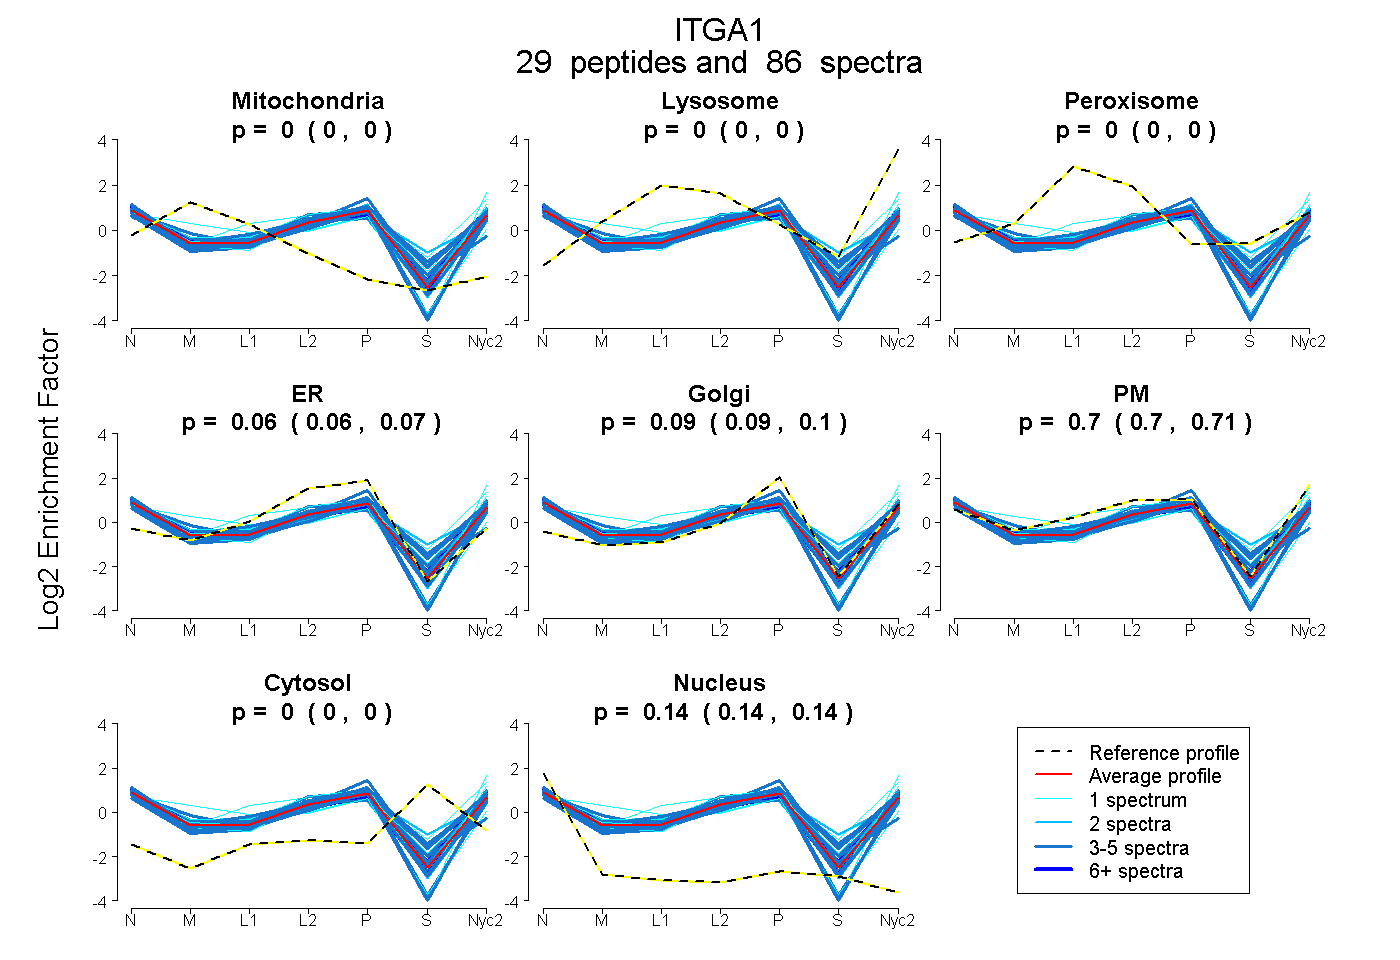
0.000 | 0.000
0.000 | 0.000
0.000 | 0.000
0.055 | 0.066
0.088 | 0.096
0.699 | 0.707
0.000 | 0.000
0.142 | 0.144
10peptides
spectra
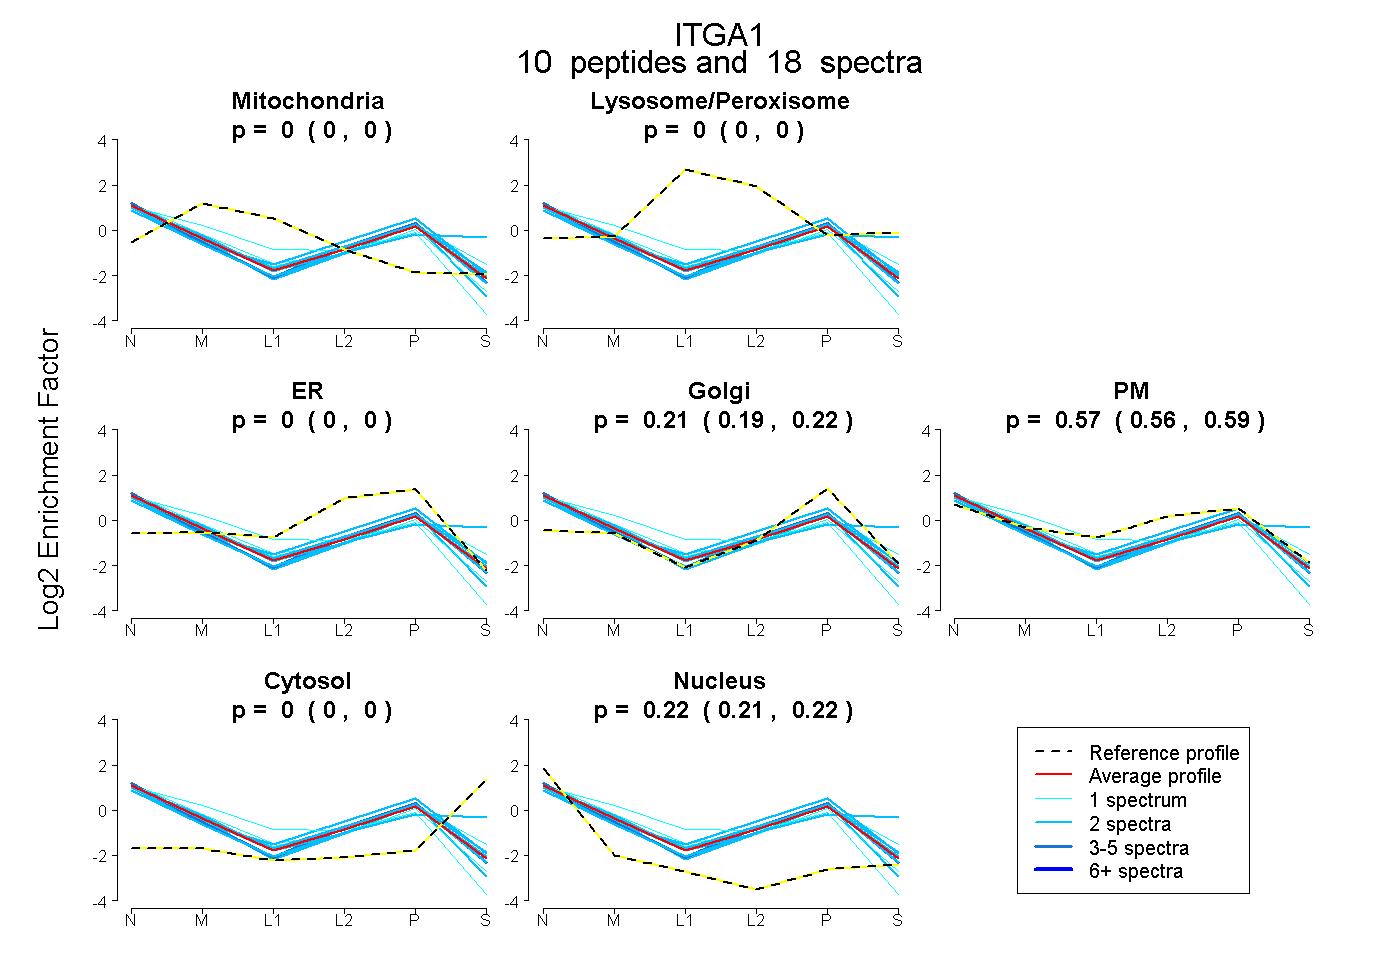
0.000 | 0.000
0.000 | 0.000
0.000 | 0.000
0.193 | 0.220
0.559 | 0.588
0.000 | 0.000
0.212 | 0.223
24peptides
spectra
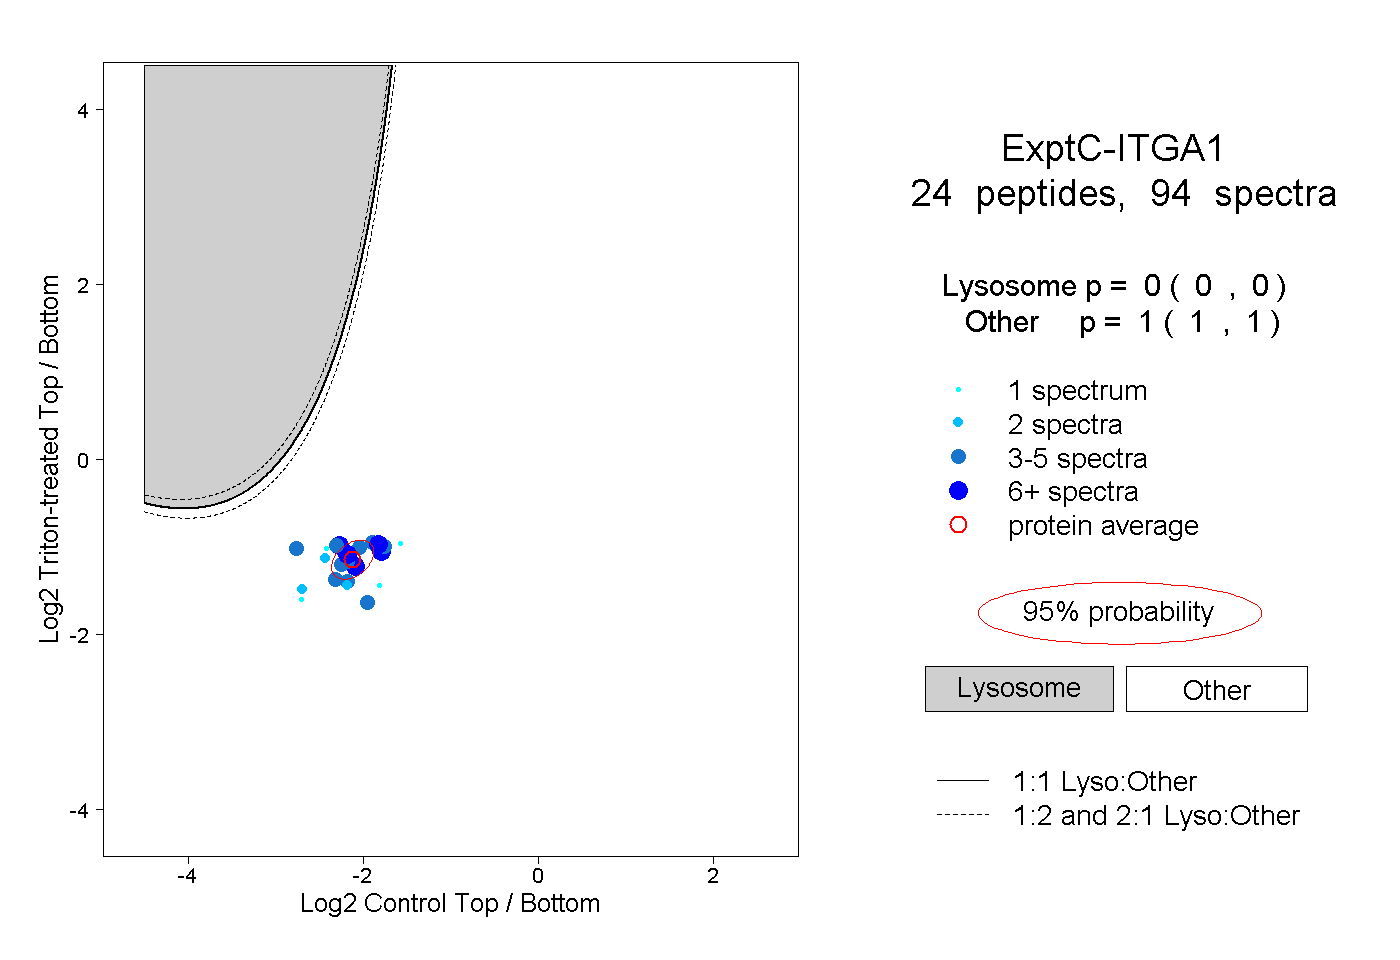
0.000 | 0.000
1.000 | 1.000
8peptides
spectra
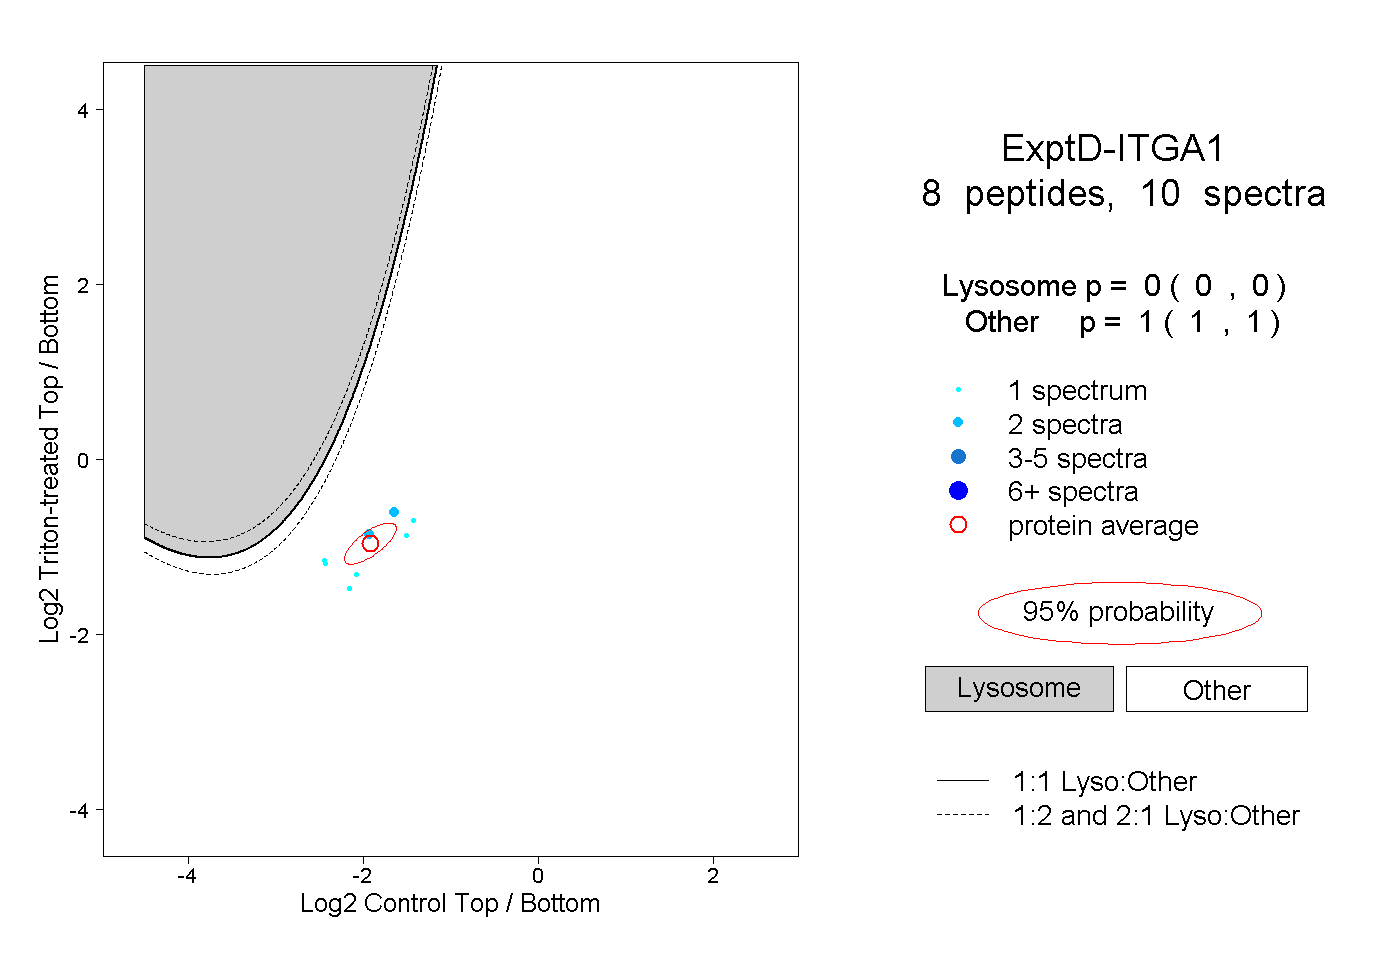
0.000 | 0.000
1.000 | 1.000