ITGA1
[ENSRNOP00000016353]
Main page
| | | Plot |
Mito |
Lyso |
|
Perox |
ER |
Golgi |
PM |
Cytosol |
Nucleus |
|
| Expt A |
 29
29
peptides |
86
spectra |
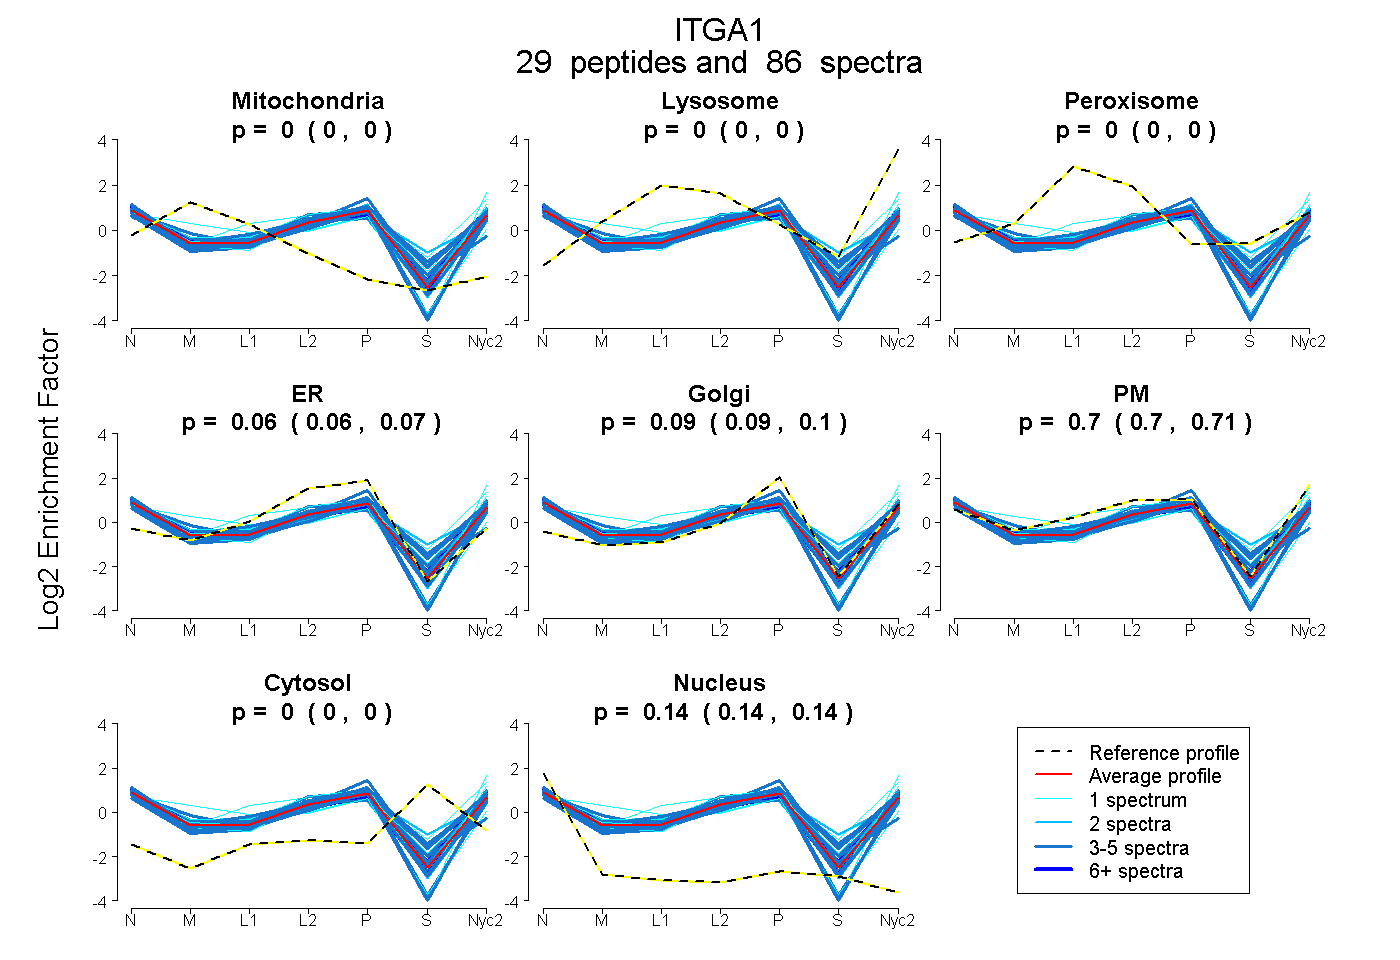 |
0.000
0.000 | 0.000 |
0.000
0.000 | 0.000 |
|
0.000
0.000 | 0.000 |
0.061
0.055 | 0.066 |
0.092
0.088 | 0.096 |
0.703
0.699 | 0.707 |
0.000
0.000 | 0.000 |
0.143
0.142 | 0.144 |
|
| | | Plot |
Mito |
|
Lyso or Perox |
|
ER |
Golgi |
PM |
Cytosol |
Nucleus |
|
| Expt B |
10
peptides |
18
spectra |
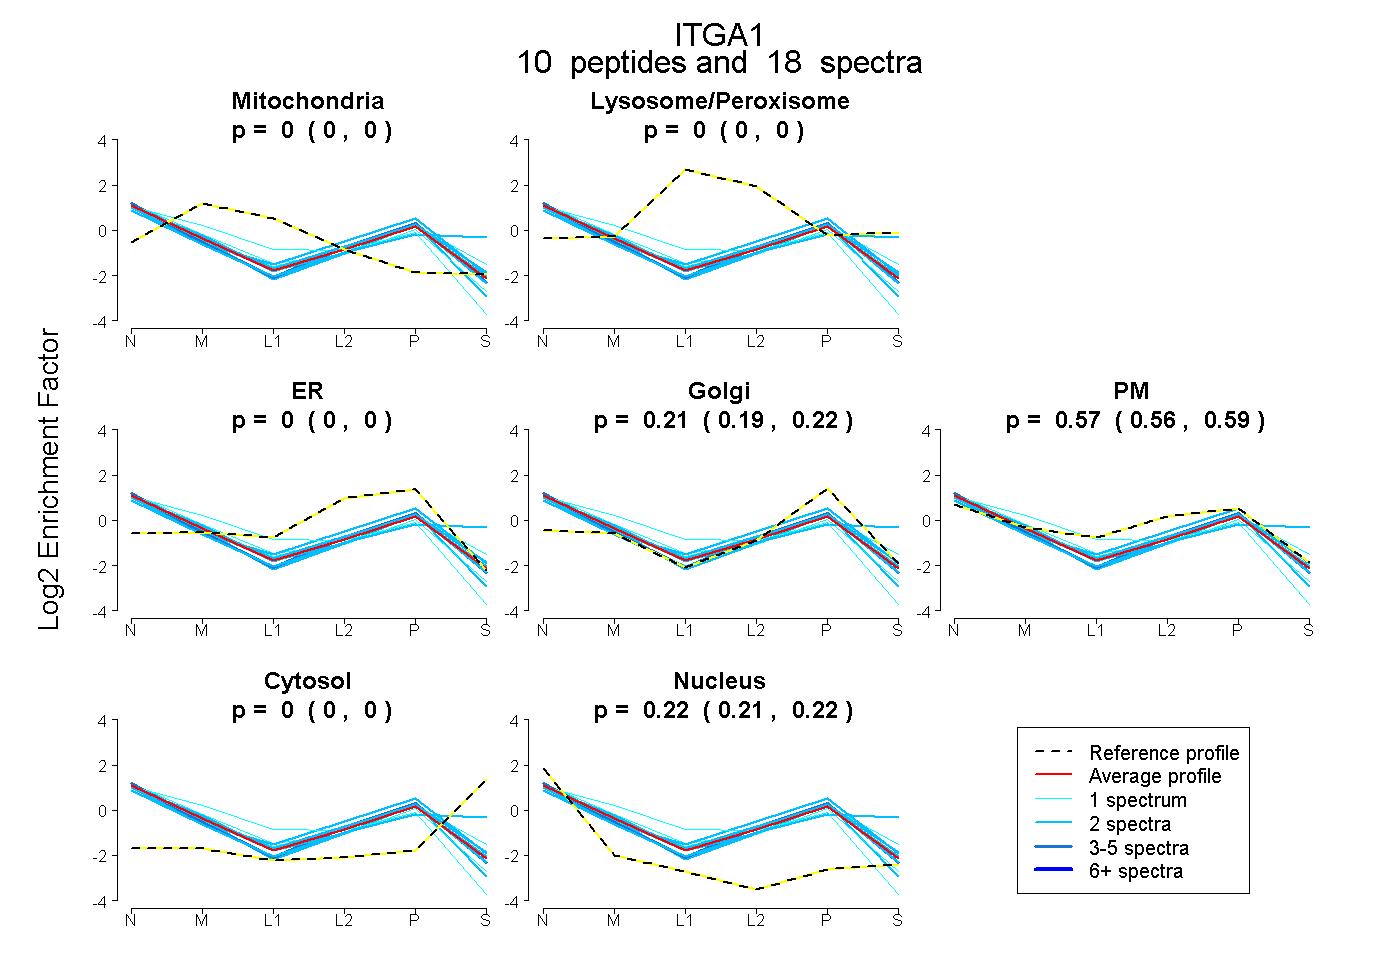 |
0.000
0.000 | 0.000 |
|
0.000
0.000 | 0.000 |
|
0.000
0.000 | 0.000 |
0.207
0.193 | 0.220 |
0.575
0.559 | 0.588 |
0.000
0.000 | 0.000 |
0.218
0.212 | 0.223 |
|
| 1 spectrum, FGTAIAAVK |
0.009 |
|
0.000 |
|
0.000 |
0.111 |
0.636 |
0.000 |
0.245 |
|
| 2 spectra, FSIAILGHYNR |
0.000 |
|
0.000 |
|
0.000 |
0.193 |
0.675 |
0.000 |
0.132 |
|
| 2 spectra, SIASEPTEK |
0.000 |
|
0.000 |
|
0.000 |
0.037 |
0.545 |
0.287 |
0.131 |
|
| 2 spectra, EAFTEAR |
0.000 |
|
0.000 |
|
0.000 |
0.318 |
0.422 |
0.000 |
0.260 |
|
| 1 spectrum, ESECLR |
0.000 |
|
0.000 |
|
0.000 |
0.158 |
0.619 |
0.027 |
0.196 |
|
| 2 spectra, VTLDSLR |
0.000 |
|
0.000 |
|
0.000 |
0.149 |
0.651 |
0.000 |
0.199 |
|
| 3 spectra, FVEEIK |
0.000 |
|
0.000 |
|
0.000 |
0.271 |
0.503 |
0.000 |
0.226 |
|
| 1 spectrum, VGYPFLR |
0.176 |
|
0.000 |
|
0.045 |
0.000 |
0.593 |
0.000 |
0.186 |
|
| 2 spectra, SFFSGTQER |
0.000 |
|
0.000 |
|
0.000 |
0.236 |
0.578 |
0.000 |
0.185 |
|
| 2 spectra, QVIQDCEDENIQR |
0.000 |
|
0.000 |
|
0.000 |
0.248 |
0.518 |
0.000 |
0.234 |
|
| | | Plot |
|
Lyso |
|
|
|
|
|
|
|
Other |
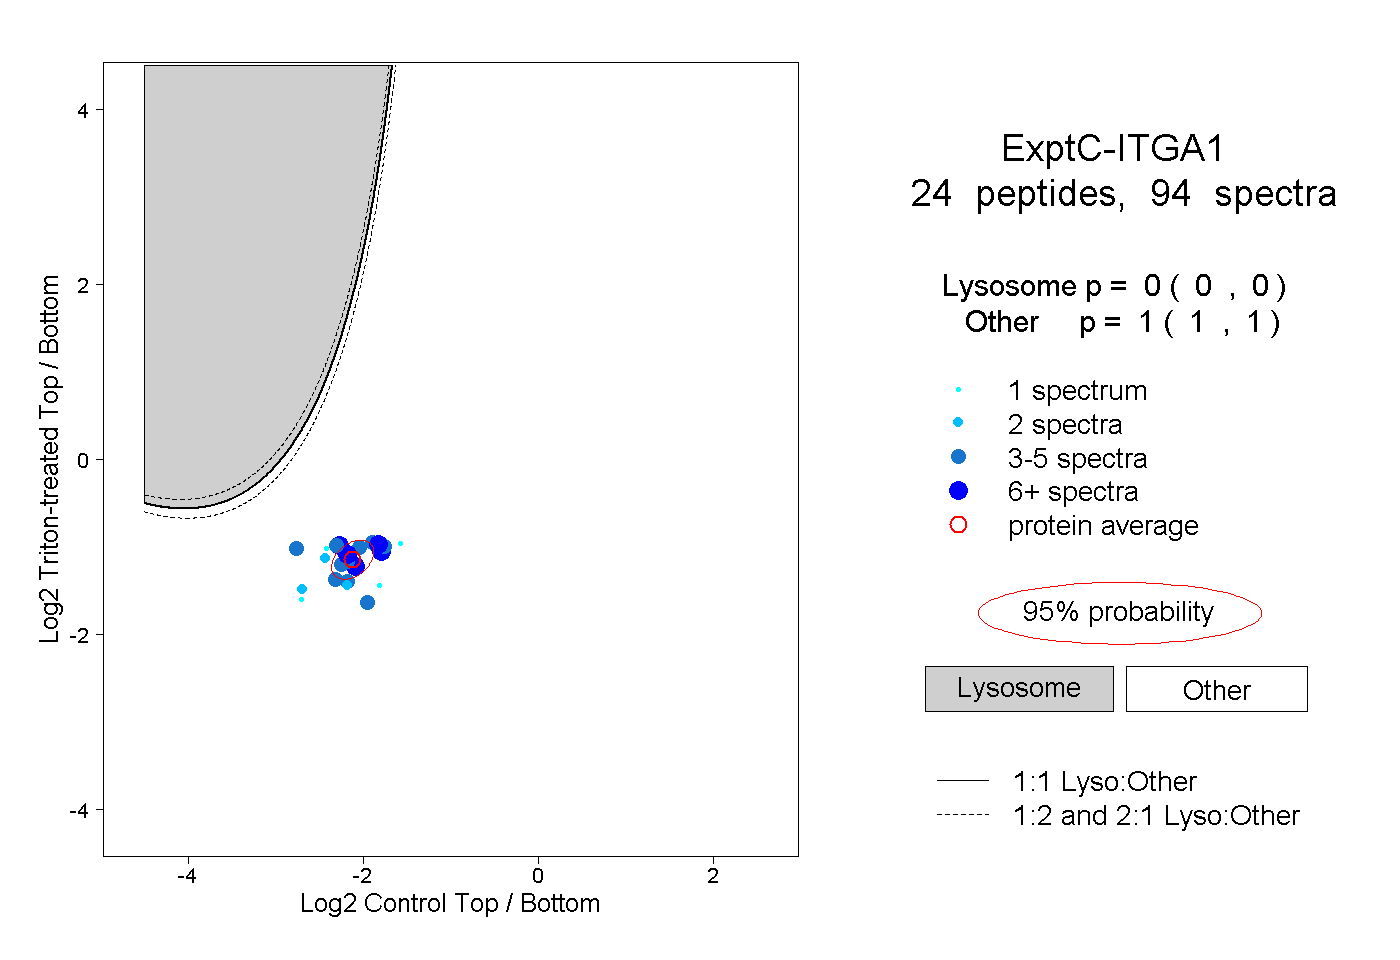
| Expt C |
24
peptides |
94
spectra |
 |
|
0.000
0.000 | 0.000 |
|
|
|
|
|
|
|
1.000
1.000 | 1.000 |
| | | Plot |
|
Lyso |
|
|
|
|
|
|
|
Other |
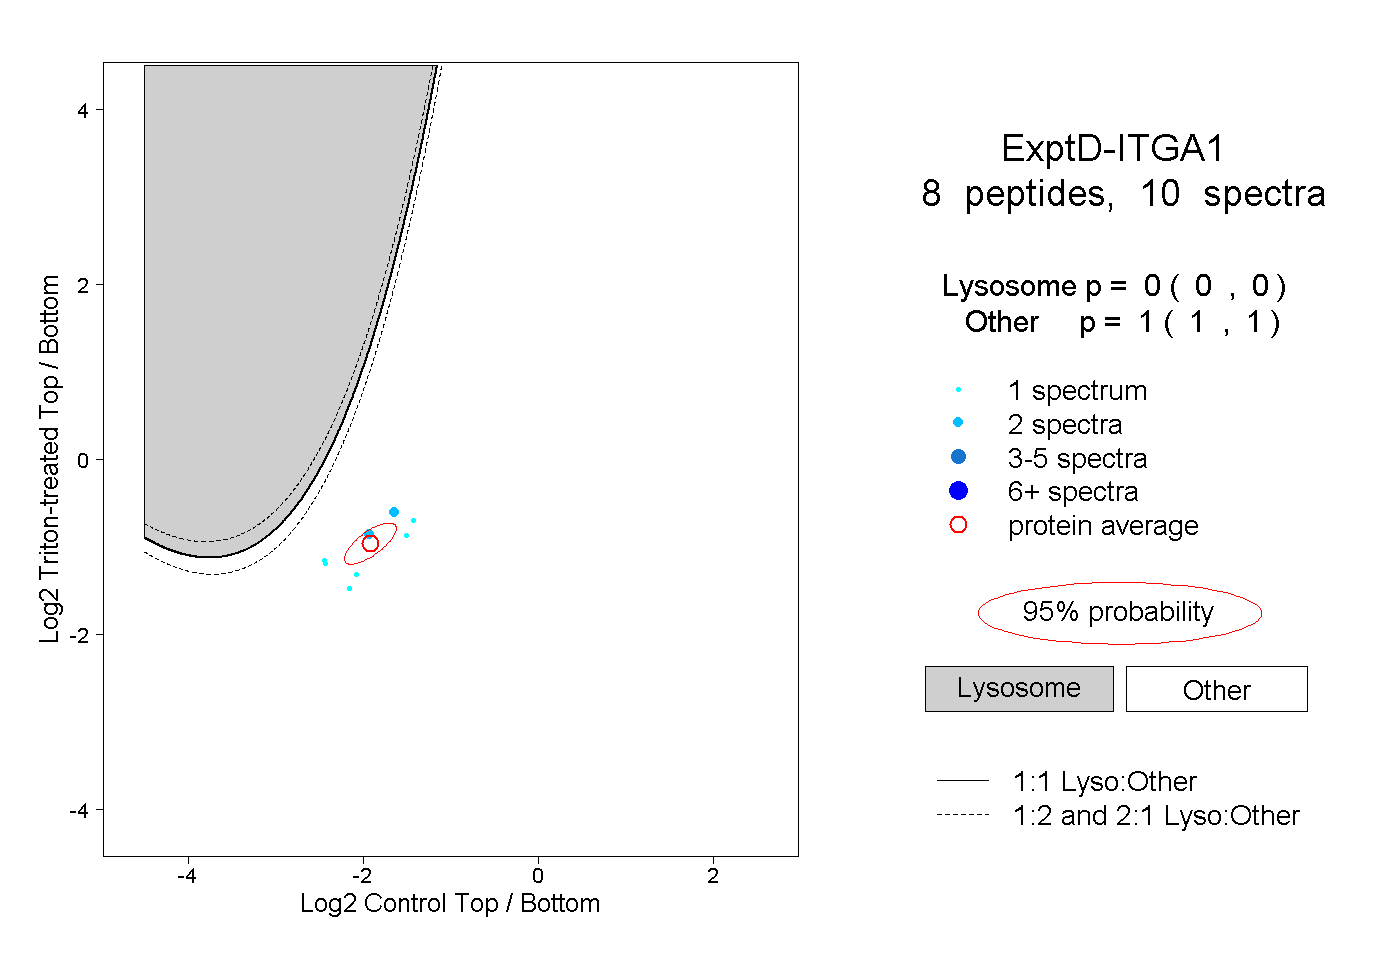
| Expt D |
8
peptides |
10
spectra |
 |
|
0.000
0.000 | 0.000 |
|
|
|
|
|
|
|
1.000
1.000 | 1.000 |