 31
31peptides
spectra
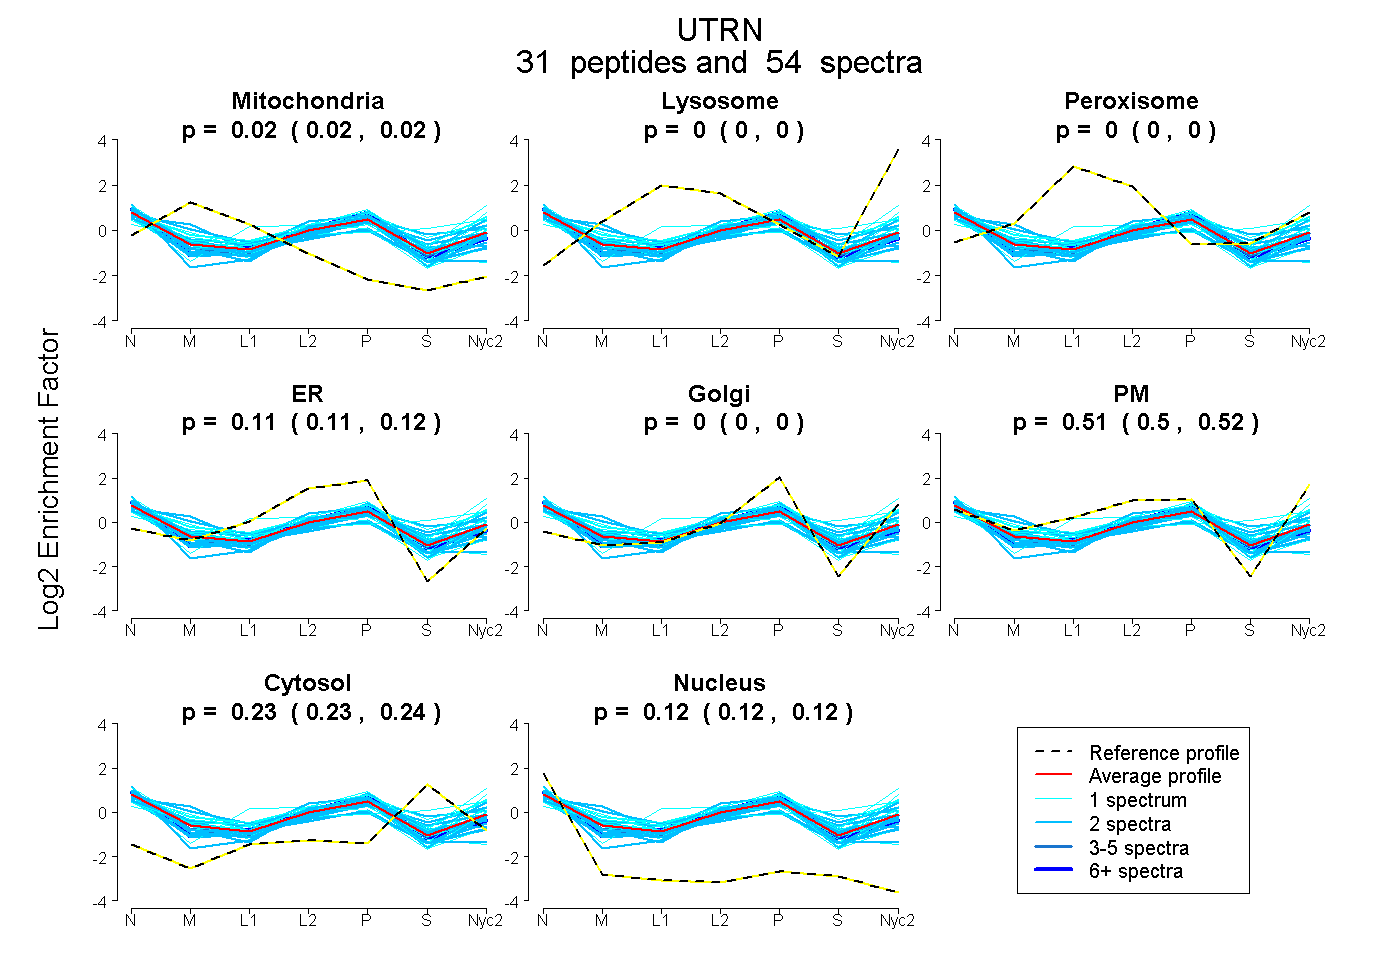
0.016 | 0.024
0.000 | 0.000
0.000 | 0.000
0.105 | 0.121
0.000 | 0.000
0.504 | 0.522
0.228 | 0.235
0.117 | 0.122
2peptides
spectra
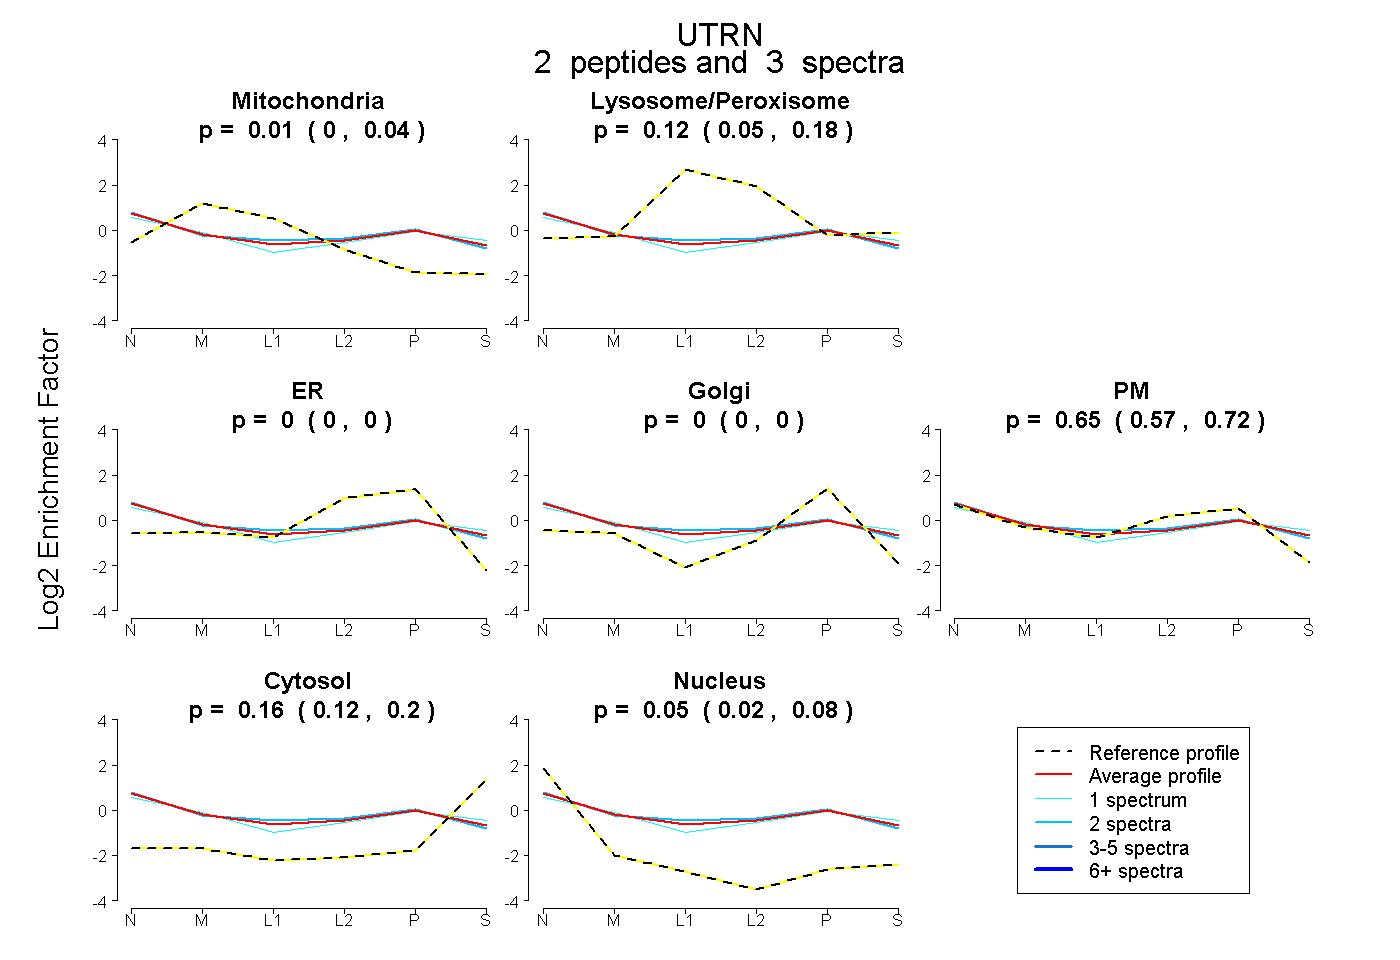
0.000 | 0.037
0.047 | 0.183
0.000 | 0.000
0.000 | 0.000
0.574 | 0.716
0.119 | 0.197
0.017 | 0.084
22peptides
spectra
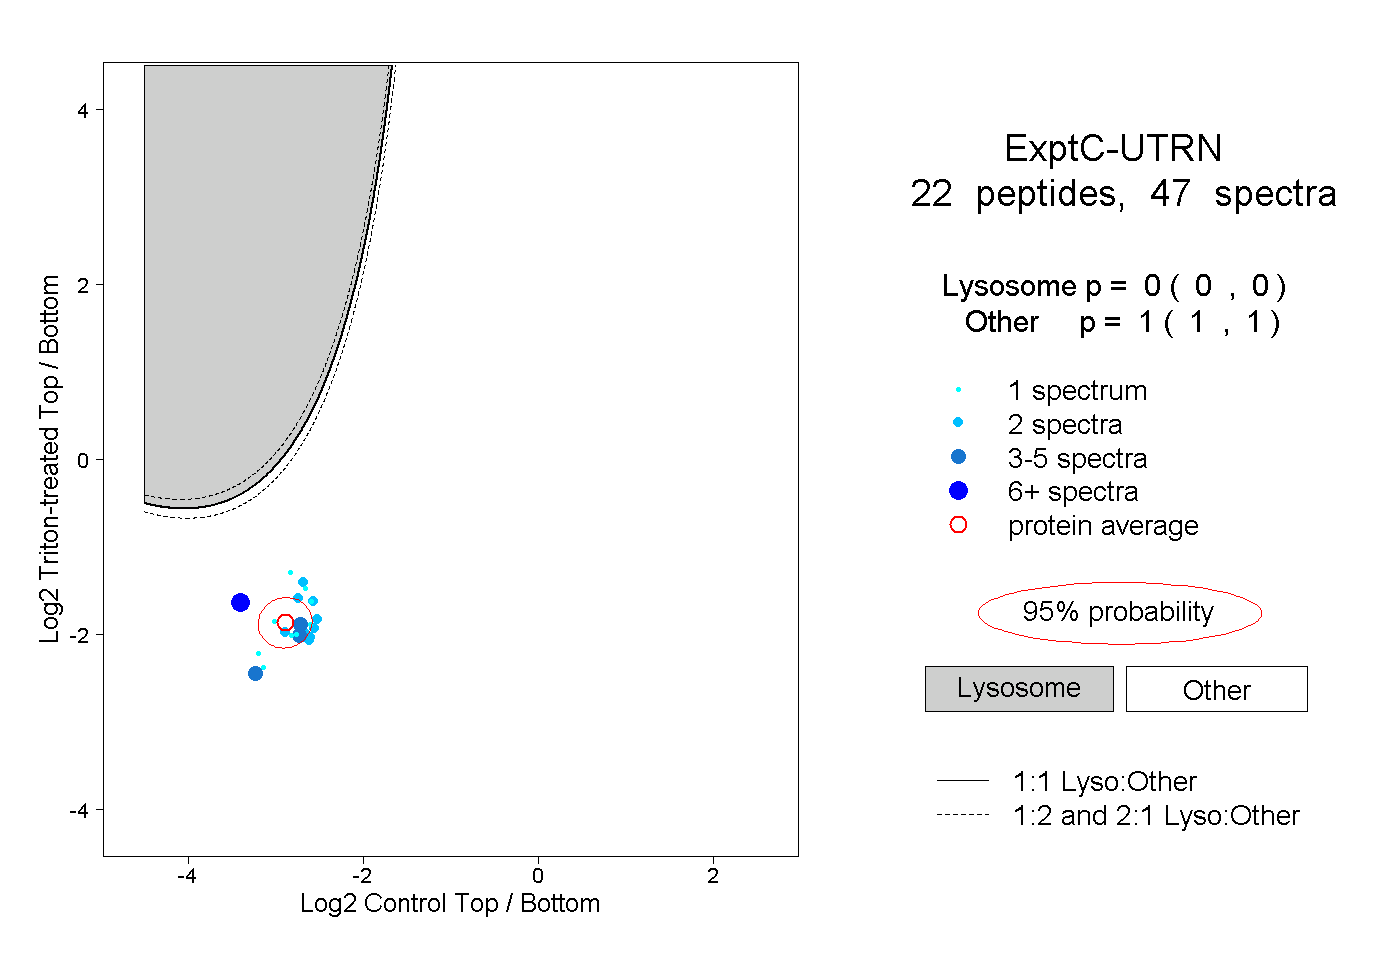
0.000 | 0.000
1.000 | 1.000
1peptide
spectrum
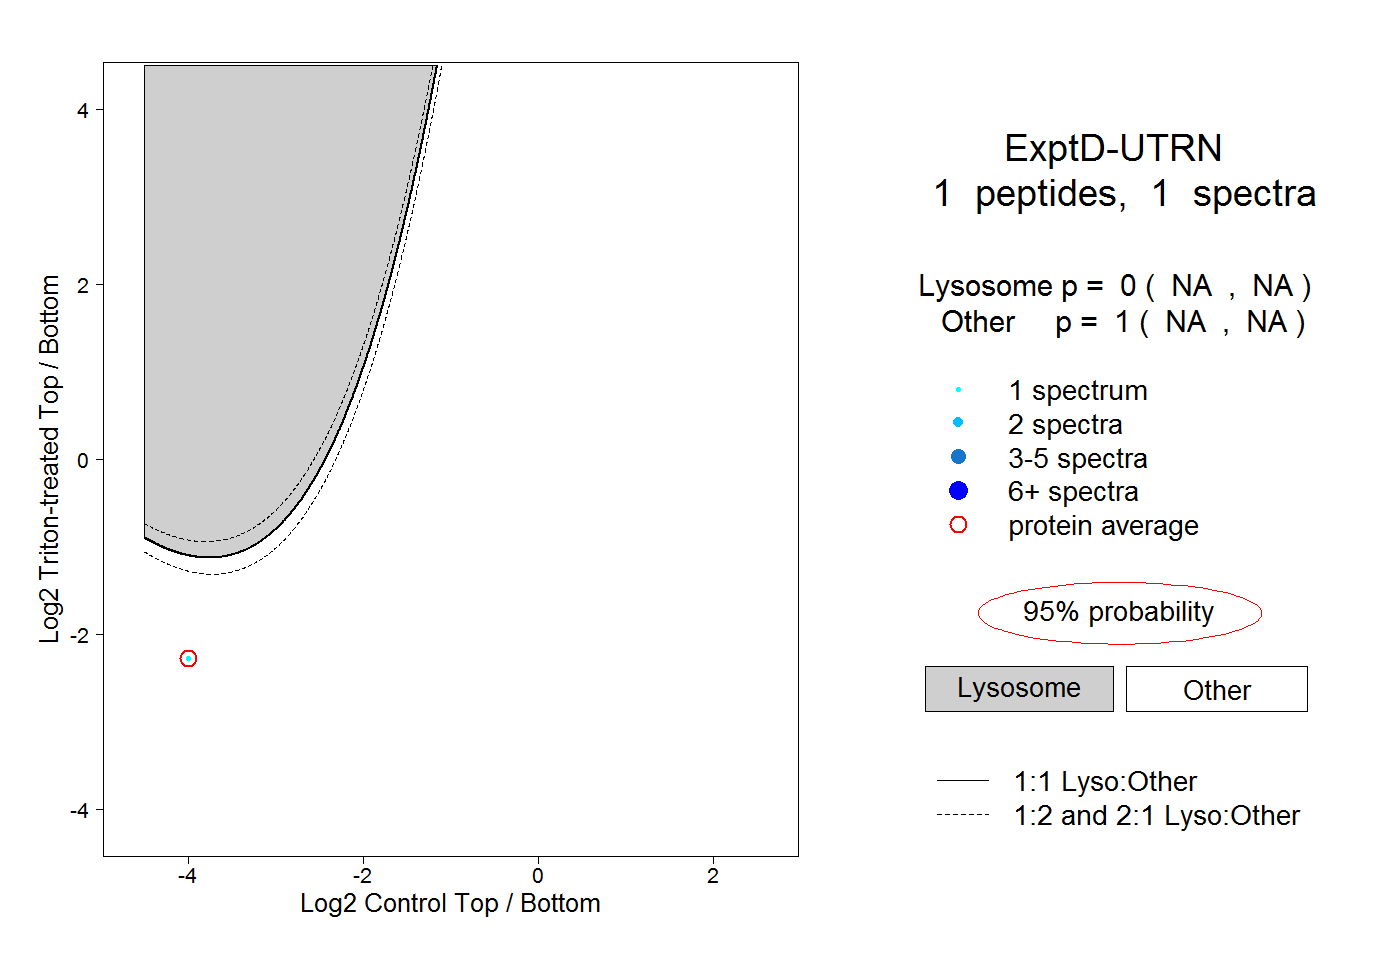
NA | NA
NA | NA