 14
14peptides
spectra
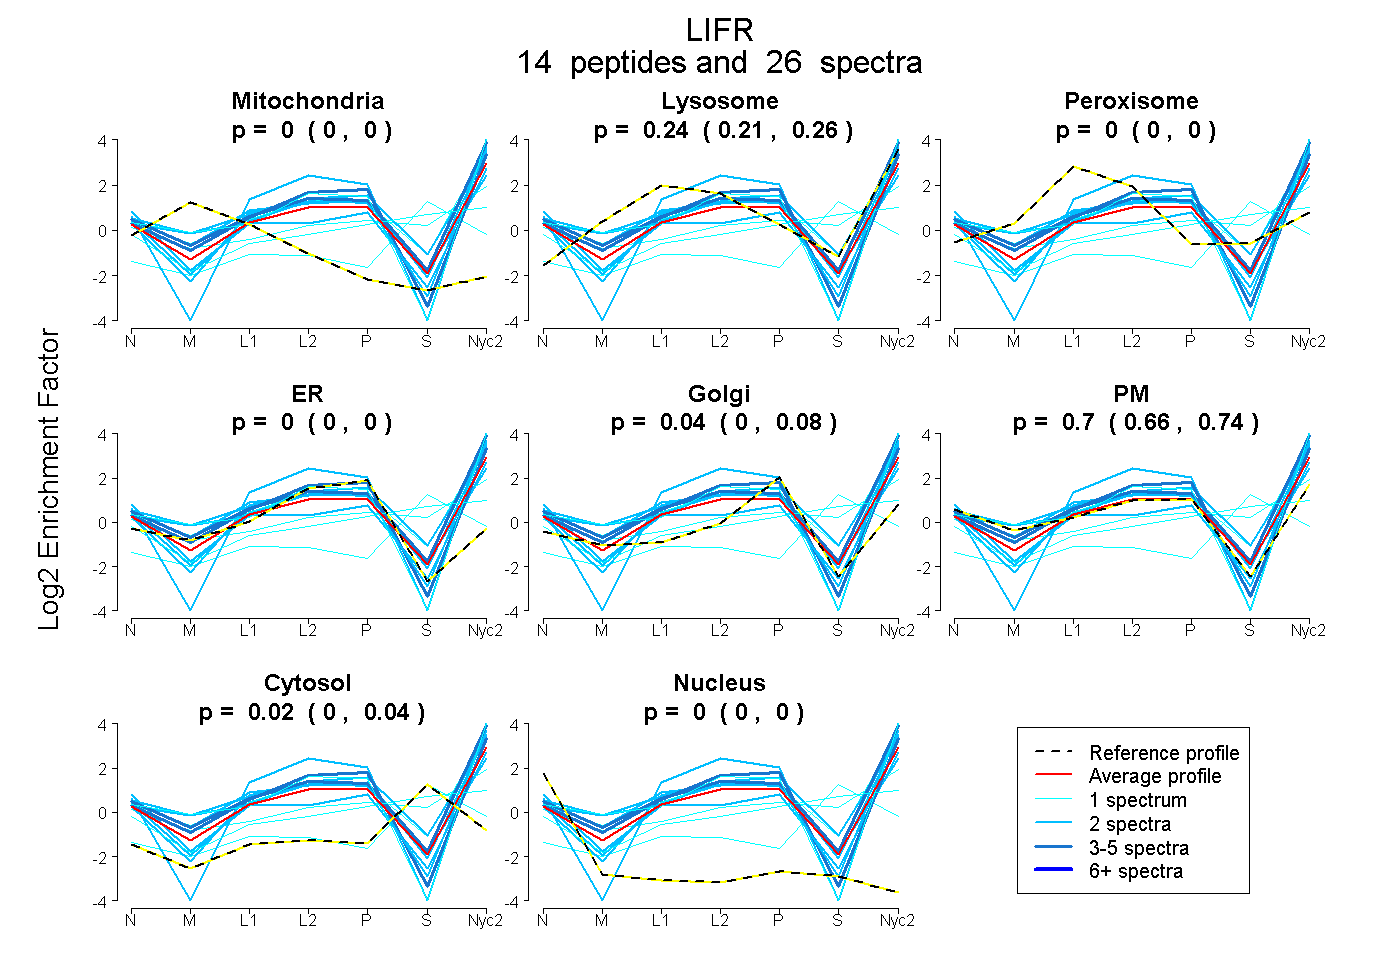
0.000 | 0.000
0.214 | 0.258
0.000 | 0.000
0.000 | 0.000
0.000 | 0.079
0.656 | 0.735
0.000 | 0.037
0.000 | 0.000
22peptides
spectra
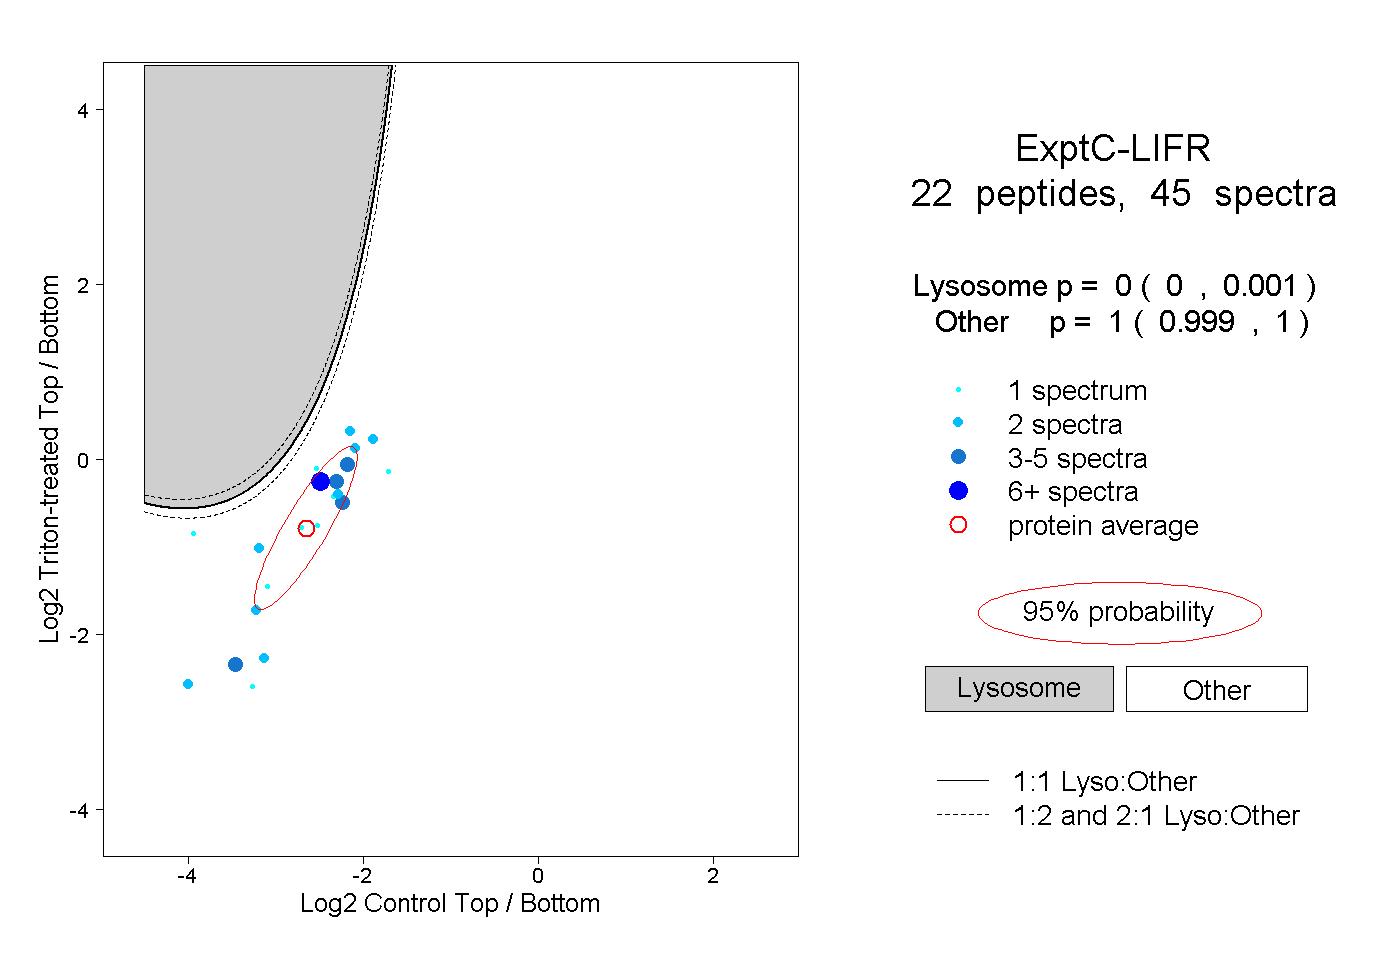
0.000 | 0.001
0.999 | 1.000
4peptides
spectra
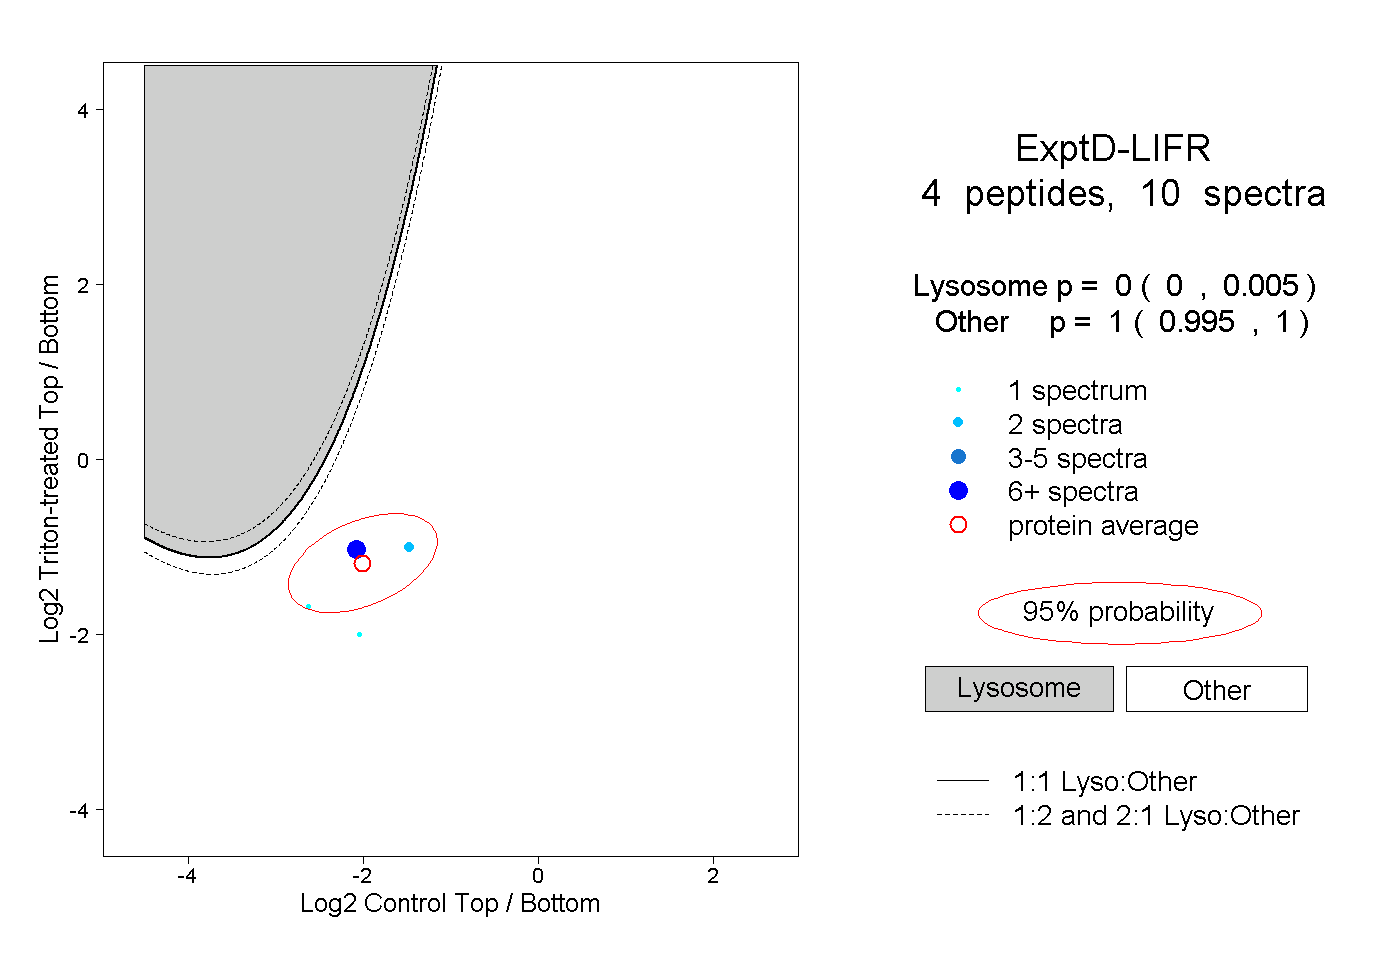
0.000 | 0.005
0.995 | 1.000