 14
14peptides
spectra
0.000 | 0.000
0.214 | 0.258
0.000 | 0.000
0.000 | 0.000
0.000 | 0.079
0.656 | 0.735
0.000 | 0.037
0.000 | 0.000
22peptides
spectra
0.000 | 0.001
0.999 | 1.000
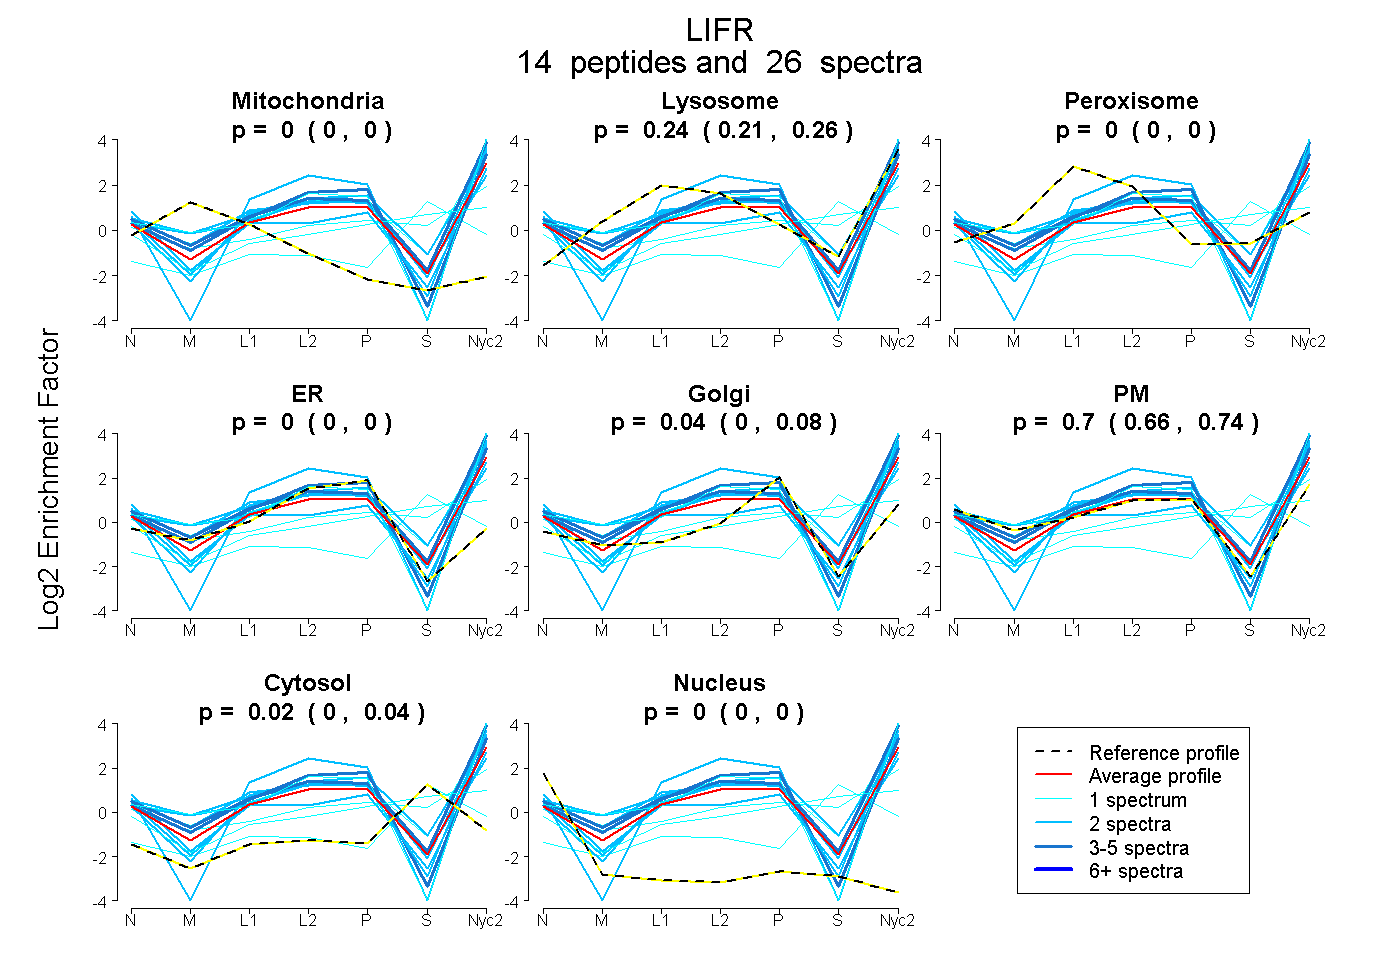
| Plot | Mito | Lyso | Perox | ER | Golgi | PM | Cytosol | Nucleus | |||||
| Expt A |
14 peptides |
26 spectra |
|
0.000 0.000 | 0.000 |
0.238 0.214 | 0.258 |
0.000 0.000 | 0.000 |
0.000 0.000 | 0.000 |
0.043 0.000 | 0.079 |
0.699 0.656 | 0.735 |
0.020 0.000 | 0.037 |
0.000 0.000 | 0.000 |
||
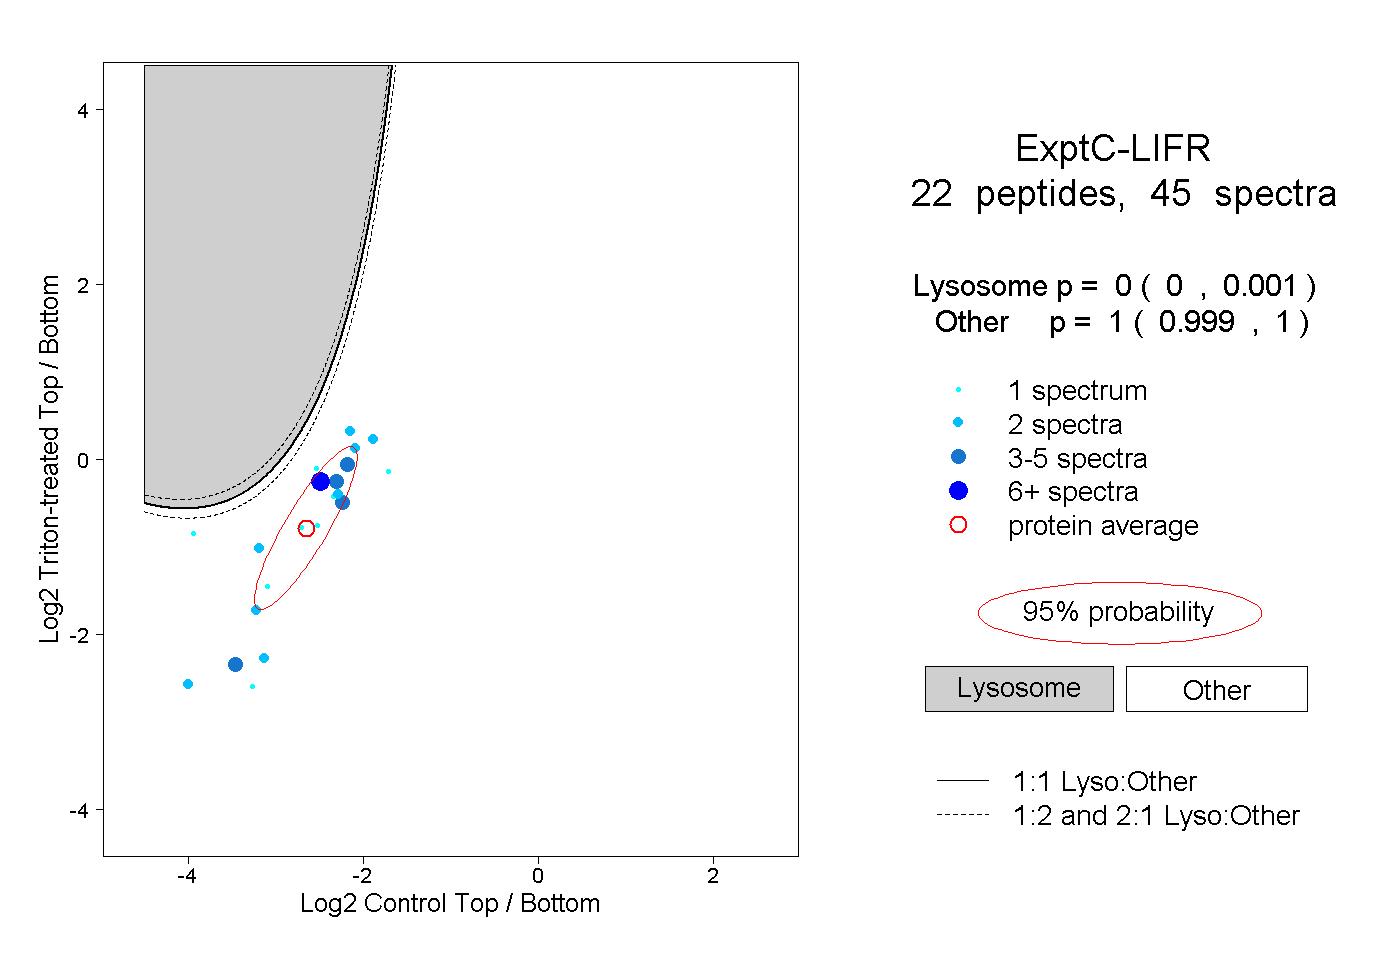
| Plot | Lyso | Other | |||||||||||
| Expt C |
22 peptides |
45 spectra |
|
0.000 0.000 | 0.001 |
1.000 0.999 | 1.000 |
| 1 spectrum, FTLNEK | 0.000 | 1.000 | ||||||||
| 1 spectrum, GAEDSTYHVAVDK | 0.000 | 1.000 | ||||||||
| 1 spectrum, TSYHLVLR | 0.000 | 1.000 | ||||||||
| 1 spectrum, SVCEGSNALK | 0.000 | 1.000 | ||||||||
| 6 spectra, ITGLVGPR | 0.000 | 1.000 | ||||||||
| 1 spectrum, STDSNSEVVSFGSPCSINSR | 0.025 | 0.975 | ||||||||
| 3 spectra, LETTNVK | 0.000 | 1.000 | ||||||||
| 2 spectra, ALQFQK | 0.000 | 1.000 | ||||||||
| 2 spectra, VALHVPISLK | 0.000 | 1.000 | ||||||||
| 1 spectrum, GYLFYFQK | 0.000 | 1.000 | ||||||||
| 2 spectra, WHIDYPR | 0.000 | 1.000 | ||||||||
| 2 spectra, TLEMNPCTPNHVEVLESR | 0.000 | 1.000 | ||||||||
| 4 spectra, EWSSDGK | 0.000 | 1.000 | ||||||||
| 2 spectra, FTLDEK | 0.000 | 1.000 | ||||||||
| 1 spectrum, NTEYTLFESISGK | 0.002 | 0.998 | ||||||||
| 1 spectrum, YLTTEATPSK | 0.000 | 1.000 | ||||||||
| 2 spectra, NSAGSSPPSK | 0.000 | 1.000 | ||||||||
| 3 spectra, LNPYTIYTFR | 0.000 | 1.000 | ||||||||
| 2 spectra, WDDIPVEELR | 0.000 | 1.000 | ||||||||
| 1 spectrum, ETFYPDIPNPENCK | 0.000 | 1.000 | ||||||||
| 2 spectra, SAVFHR | 0.000 | 1.000 | ||||||||
| 4 spectra, AYTHGGLGPEK | 0.000 | 1.000 |
| Plot | Lyso | Other | |||||||||||
| Expt D |
4 peptides |
10 spectra |
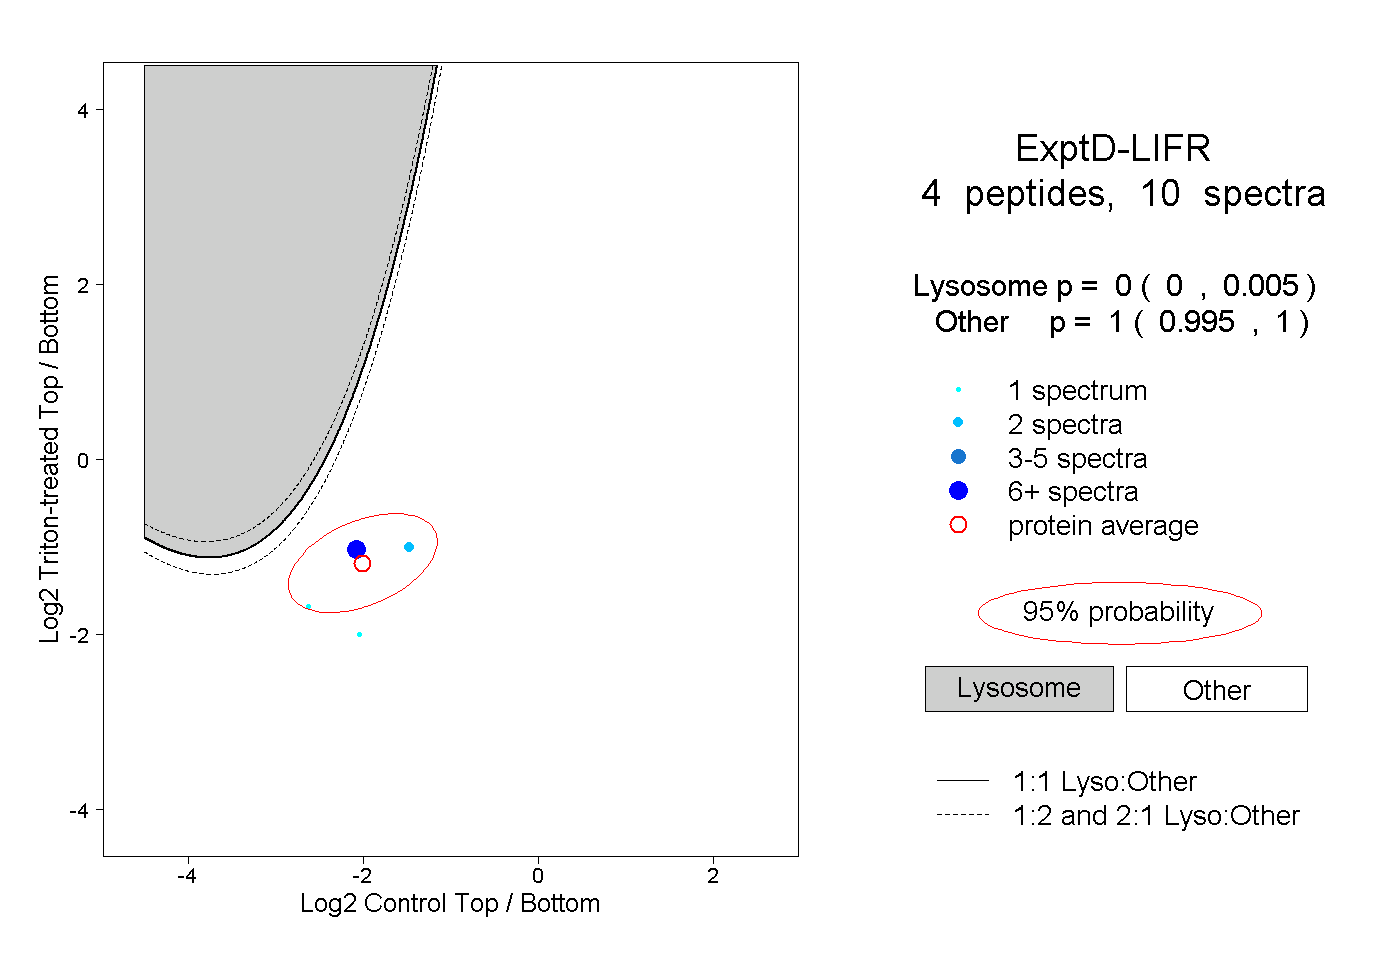 |
0.000 0.000 | 0.005 |
1.000 0.995 | 1.000 |