 14
14peptides
spectra
0.000 | 0.000
0.214 | 0.258
0.000 | 0.000
0.000 | 0.000
0.000 | 0.079
0.656 | 0.735
0.000 | 0.037
0.000 | 0.000
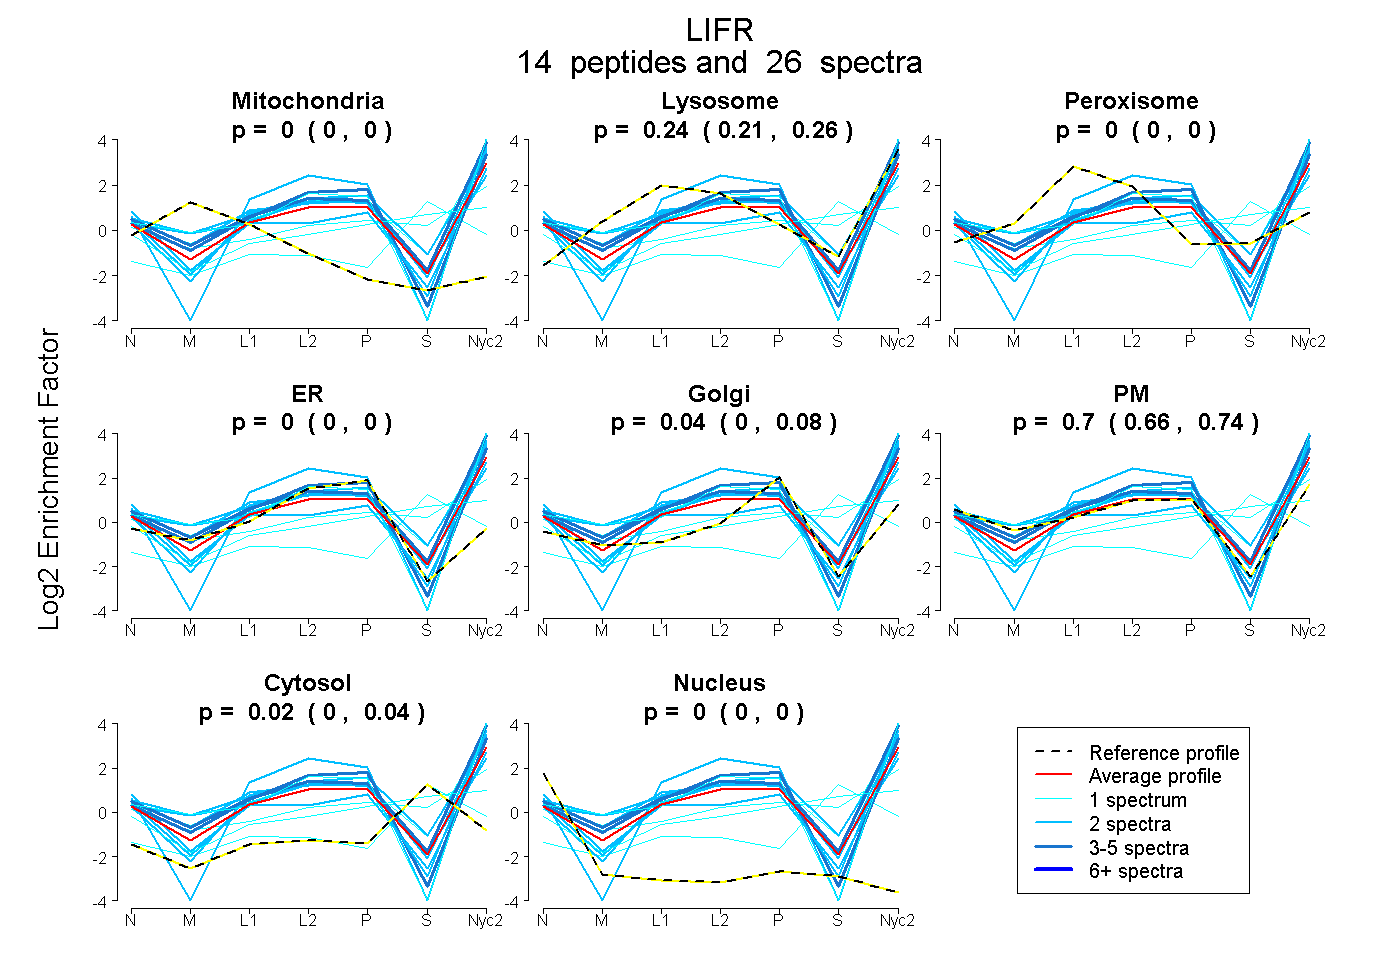
| Plot | Mito | Lyso | Perox | ER | Golgi | PM | Cytosol | Nucleus | |||||
| Expt A |
14 peptides |
26 spectra |
|
0.000 0.000 | 0.000 |
0.238 0.214 | 0.258 |
0.000 0.000 | 0.000 |
0.000 0.000 | 0.000 |
0.043 0.000 | 0.079 |
0.699 0.656 | 0.735 |
0.020 0.000 | 0.037 |
0.000 0.000 | 0.000 |
| 1 spectrum, FTLNEK | 0.000 | 0.436 | 0.000 | 0.000 | 0.000 | 0.564 | 0.000 | 0.000 | ||
| 1 spectrum, WHIDYPR | 0.000 | 0.208 | 0.000 | 0.000 | 0.000 | 0.792 | 0.000 | 0.000 | ||
| 2 spectra, TLEMNPCTPNHVEVLESR | 0.000 | 0.355 | 0.000 | 0.000 | 0.085 | 0.514 | 0.045 | 0.000 | ||
| 1 spectrum, EWSSDGK | 0.000 | 0.233 | 0.000 | 0.000 | 0.000 | 0.408 | 0.359 | 0.000 | ||
| 2 spectra, VLQNPR | 0.000 | 0.257 | 0.000 | 0.000 | 0.000 | 0.743 | 0.000 | 0.000 | ||
| 2 spectra, NTEYTLFESISGK | 0.000 | 0.106 | 0.000 | 0.000 | 0.000 | 0.894 | 0.000 | 0.000 | ||
| 1 spectrum, FTLDEK | 0.007 | 0.098 | 0.000 | 0.000 | 0.000 | 0.000 | 0.895 | 0.000 | ||
| 1 spectrum, YLTTEATPSK | 0.000 | 0.120 | 0.000 | 0.000 | 0.000 | 0.319 | 0.561 | 0.000 | ||
| 2 spectra, EIICSWNPGR | 0.000 | 0.275 | 0.000 | 0.000 | 0.000 | 0.725 | 0.000 | 0.000 | ||
| 2 spectra, EWSEWSPLK | 0.000 | 0.238 | 0.000 | 0.000 | 0.008 | 0.755 | 0.000 | 0.000 | ||
| 2 spectra, LNPYTIYTFR | 0.000 | 0.390 | 0.000 | 0.000 | 0.000 | 0.610 | 0.000 | 0.000 | ||
| 4 spectra, WDDIPVEELR | 0.000 | 0.400 | 0.000 | 0.000 | 0.000 | 0.600 | 0.000 | 0.000 | ||
| 3 spectra, VALHVPISLK | 0.000 | 0.175 | 0.000 | 0.000 | 0.000 | 0.825 | 0.000 | 0.000 | ||
| 2 spectra, GYLFYFQK | 0.000 | 0.048 | 0.000 | 0.000 | 0.000 | 0.912 | 0.011 | 0.030 |
| Plot | Lyso | Other | |||||||||||
| Expt C |
22 peptides |
45 spectra |
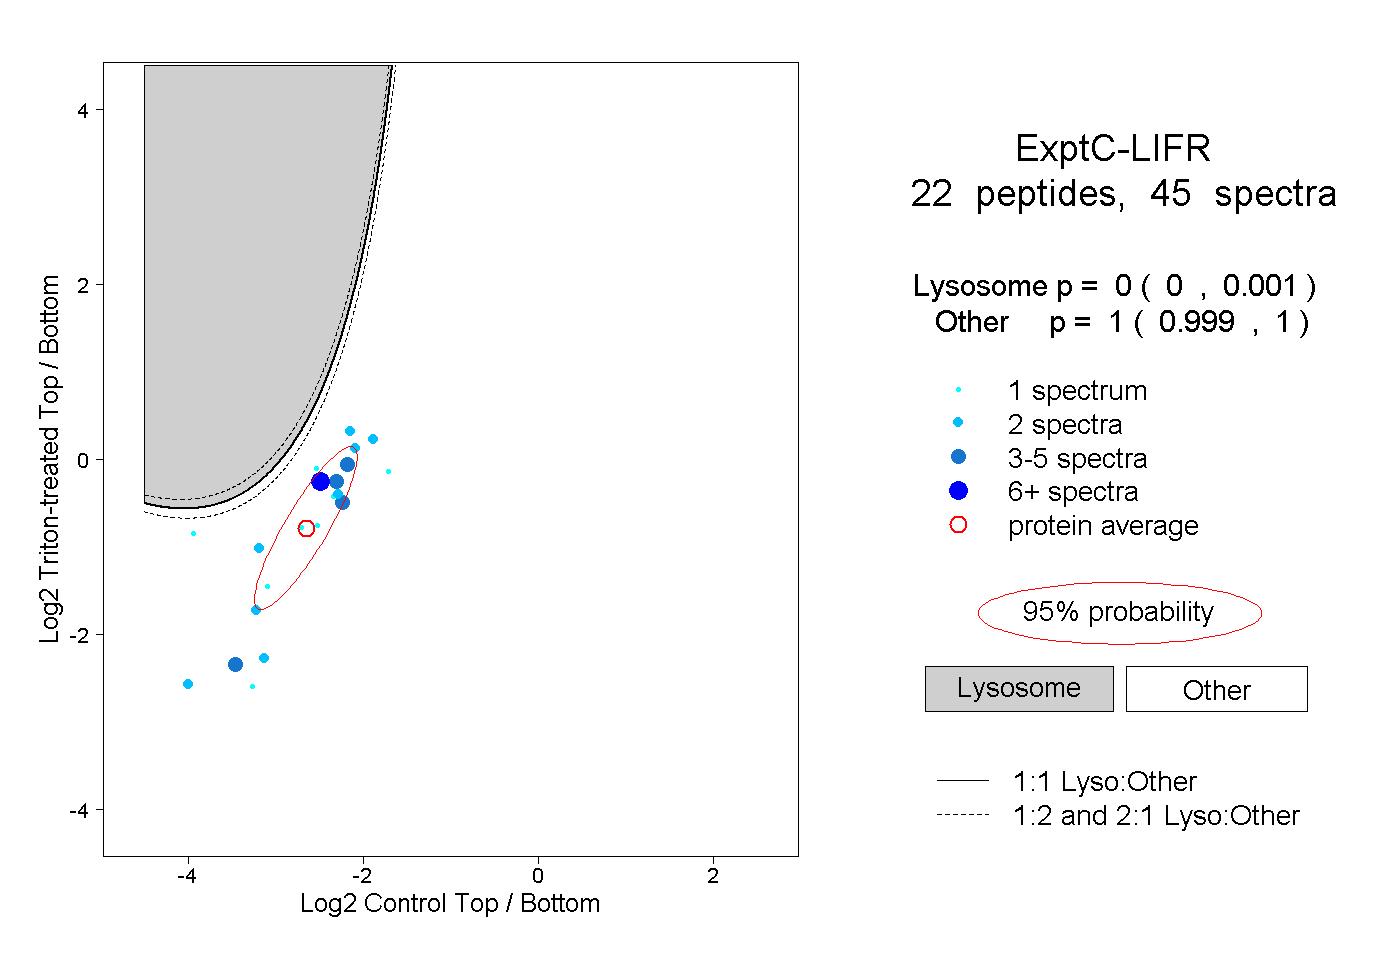 |
0.000 0.000 | 0.001 |
1.000 0.999 | 1.000 |
||||||||
| Plot | Lyso | Other | |||||||||||
| Expt D |
4 peptides |
10 spectra |
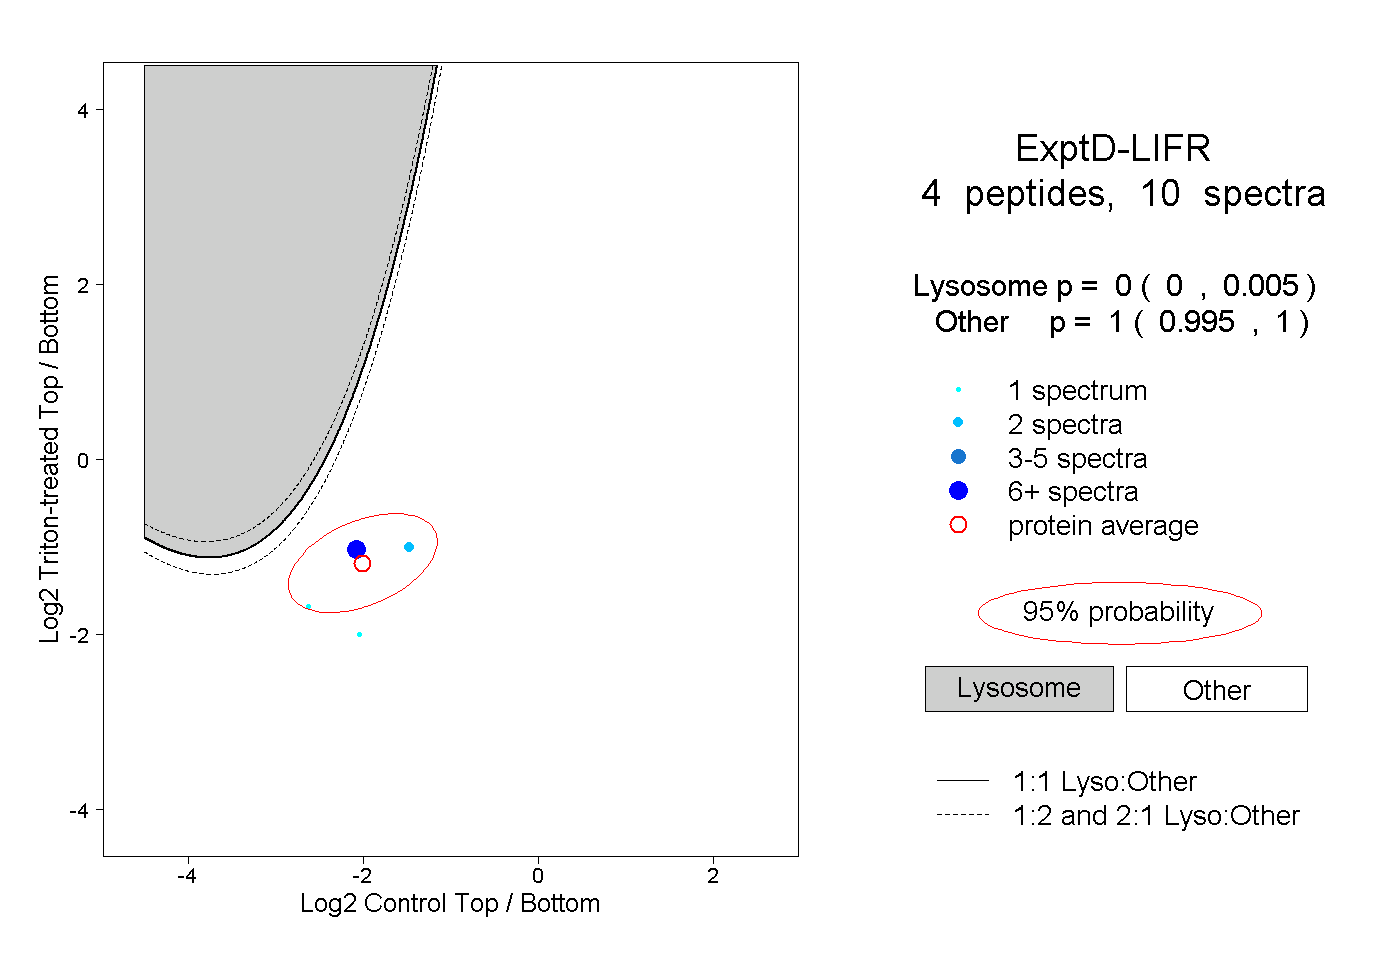 |
0.000 0.000 | 0.005 |
1.000 0.995 | 1.000 |